HAL Id: hal-00304662
https://hal.archives-ouvertes.fr/hal-00304662
Submitted on 1 Jan 2002
HAL is a multi-disciplinary open access archive for the deposit and dissemination of sci-entific research documents, whether they are pub-lished or not. The documents may come from teaching and research institutions in France or abroad, or from public or private research centers.
L’archive ouverte pluridisciplinaire HAL, est destinée au dépôt et à la diffusion de documents scientifiques de niveau recherche, publiés ou non, émanant des établissements d’enseignement et de recherche français ou étrangers, des laboratoires publics ou privés.
assessment: 2. Effects of changes in land-use under a
historical perspective
R. Rosso, M.C. Rulli
To cite this version:
R. Rosso, M.C. Rulli. An integrated simulation method for flash-flood risk assessment: 2. Effects of changes in land-use under a historical perspective. Hydrology and Earth System Sciences Discussions, European Geosciences Union, 2002, 6 (2), pp.285-294. �hal-00304662�
An integrated simulation method for flash-flood risk assessment :2. Effect of historical changes in land use Hydrology and Earth System Sciences, 6(3), 285–294 (2002) © EGS
An integrated simulation method for flash-flood risk assessment:
2. Effects of changes in land-use under a historical perspective
Renzo Rosso and Maria Cristina Rulli
Dipartimento di Ingegneria Idraulica, Ambientale, Infrastrutture Viarie e Rilevamento, Politecnico di Milano, Piazza L. da Vinci, 32 I-20133 Milano, Italy E-mail for corresponding author: [email protected]
Abstract
The influence of land use changes on flood occurrence and severity in the Bisagno River (Thyrrenian Liguria, N.W. Italy is investigated using a Monte Carlo simulation approach (Rulli and Rosso, 2002). High resolution land-use maps for the area were reconstructed and scenario simulations were made for a pre-industrial (1878), an intermediate (1930) and a current (1980) year. Land-use effects were explored to assess the consequences of distributed changes in land use due to agricultural practice and urbanisation. Hydraulic conveyance effects were considered, to assess the consequences of channel modifications associated with engineering works in the lower Bisagno River network. Flood frequency analyses of the annual flood series, retrieved from the simulations, were used to examine the effect of land-use change and river conveyance on flood regime. The impact of these effects proved to be negligible in the upper Bisagno River, moderate in the downstream river and severe in the small tributaries in the lower Bisagno valley that drain densely populated urban areas. The simulation approach is shown to be capable of incorporating historical data on landscape and river patterns into quantitative methods for risk assessment.
Keywords: flood, simulation, distributed model, land-use changes, channel modifications, historical data
Introduction
Flash-flood events have a major social and economic impact, with human losses, thousands of people losing their houses and high costs for recovering damages. After a destructive flood, it is often claimed that man-induced effects have increased its severity. The present work investigates the influence of anthropic forcings, including urbanisation, deforestation, reforestation and changes in agricultural practices, on flood occurrence and severity through a combination of stochastic and deterministic simulations and a case study on a flashy stream in northern Italy. The analysis includes a detailed historical investigation of land use in the catchment over more than a century. High resolution land-use maps were constructed for the catchment of the Bisagno River in Thyrrenian Liguria, where urbanisation, industrial development and the evolution of agricultural practices have wrought major changes in the land-use pattern.
Because of the requirement to describe the effects of land use on the basin response to storm rainfall in detail, the rainfall-runoff transformation must be approached using a spatially distributed framework. Also, the precipitation
pattern in the space time domain plays an important role in this area because of the combined effect of cyclonic blocking, local convective activity and orographic uplift. Storms, delivering about the same amount of total precipitation, were observed to produce highly different flood waves depending on the space-time distribution of rainfall rate. Accordingly, the simulation approach introduced by Rulli and Rosso (2002) is used to investigate the flood frequency regime under different historical land use scenarios. This combines the Generalised Neyman-Scott Rectangular Pulses (henceforth referred to as GNSRP) stochastic model of space-time rainfall (Cowpertwait, 1994, 1995) with the event-based flash-flood spatially distributed (henceforth referred to as FEST98) model of the rainfall-runoff transformation (Mancini, 1990; Mancini et al., 1999). In the FEST98 model local abstraction from storm rainfall is computed using the SCS method (Soil Conservation Service, 1972), which accounts explicitly for land use in the parameterisation of potential soil retention. Simulation runs are used as a surrogate for observed flood series to infer the probability distribution of extreme flows. Because
Historical information on land use
and model parameterisation
The Bisagno basin of about 92 km2, located in Thyrrhenian
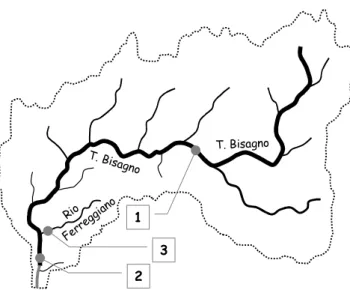
Liguria, NW Italy, is representative of flash-flood small mesoscale drainage basins of the NW Mediterranean area (Fig. 1).
The river valley was subject to urban development, particularly throughout the 20th century, with the expansion of Genoa, the third largest city in northern Italy and one of the most important ports in the Mediterranean.
Over the past two centuries, as urbanisation progressed,
the river network of the lower Bisagno was modified and narrow channels and dikes replaced natural reaches. The destructive floods of 1822, 1896, 1951, 1953, 1970 and 1992 indicate this area as a paradigm of increasing vulnerability. The analysis has considered land-use changes and river regulation works as documented over a period of two centuries, by merging a historical perspective with hydrological models for flood prediction. Accordingly, present scenarios (as obtained by the records of recent destructive floods) are compared with historical scenarios. Table 1 summarises the data collection and data assimilation procedure for developing this case study. Figure 2 illustrates the land-use distribution under historical scenarios for the years 1805, 1878, 1930, 1980 and 2000. Under three of these scenarios (1878, 1930, 1980), three river sites are examined in detail. They are:
La Presa, the location of the single streamflow gauge in
the basin, with an upstream catchment of about 34.1 km2. The upstream river network was practically
undisturbed in historical times.
Ponte Sant’Agata at the basin outlet immediately upstream
of the outlet tunnel, with a drainage basin of about 92.1 km2. The catchment reflects small mesoscale changes
in the drainage basin.
Rio Fereggiano creek at its junction with the Bisagno River,
with a catchment of about 5.1 km2, reflects microscale
changes in the basin due to extensive urbanisation. Figure 2 shows that the changes which occurred in the upper basin (as represented by the Bisagno river at La Presa) are related mainly to land reclamation involving agriculture, with urbanisation playing a minor role (see, also, Figs. 3-5). Conversely, urbanisation has produced a dramatic impact in the lower tributaries, such as Rio Fereggiano, where the forest, which covered 84% of the area at the time of the Napoleon age surveys, presently covers only 15% of the area. The changes which occurred in the lower Bisagno valley are then reflected by the land-use figures for the whole basin at Sant’Agata, where a 650% increase of the urban area (from 2 to 13% of the basin area) has occurred over two centuries with the maximum rate of increase between 1930 and 1980; the current figures indicate that the urbanisation is approaching saturation.
To analyse the potential effects of land-use changes, three different scenarios were considered (see Fig. 3).
Current Scenario. This scenario relates to land-use in 1980,
when the urban area was about 11% of the basin. This is because the FEST98 model was validated using different historical scenarios of land use can be used to
parameterise the rainfall-runoff model, scenario simulations, representative of conditions in the basin in particular years, can be obtained. These can lead to an understanding of the role of land-use changes in the evolution of flood frequency regimes for the study area.
The following scenarios are analysed:
Current Scenario. This scenario accounts for land use in
1980, when the urbanised area was about 11% of the total basin area.
Intermediate Scenario. This scenario accounts for land use
in 1930, when the urbanised area was about 7% of the total basin area.
Control Scenario. This scenario accounts for land use in
1878, taken as representative of the pre-industrial conditions in the basin.
2 3 1 T. Bisagno Rio T. Bisagno Ferre ggiano
Fig. 1. Sketch of the Bisagno river network including the three river
site considered for land use analysis (1: La Presa, 34.1 km2;
2: Sant’Agata bridge, 92.1 km2; and 3:°Rio Fereggiano at its
An integrated simulation method for flash-flood risk assessment :2. Effect of historical changes in land use
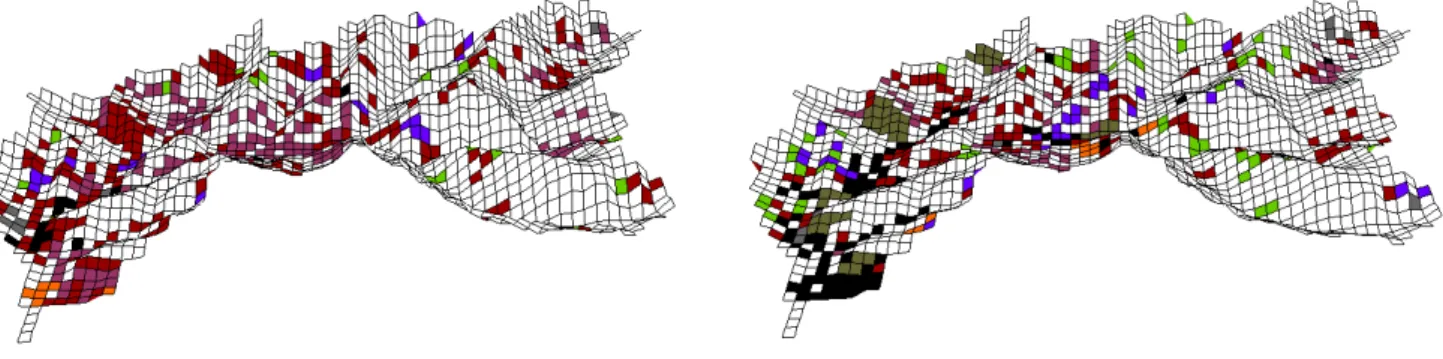
Table 1. Data synthesis for the Bisagno River
Data category Data source Description
Precipitation SIMI Hydrographic Italian Service 7 years (1990-96) of rainfall highs at hourly aggregation – Genoa level for five raingauges Daily rainfall since 1933 or later
depending on the rainstation Annual maximum precipitation heights for several durations (1, 3, 6, 12 and 24 hours respectively)
DEM DEM with a 220 x 230 m grid in digital format
Discharge SIMI Hydrographic Italian Service Annual maximum peak flow data for La Presa station, starting
– Genoa from October 1922
Hydraulic Profiles, situation 1996 Cross sections derived from a 1:500 scale map, average
engineering length 5.7 m
Reports Some reports on flood events (1953, 1970, 1992) and on river engineering works (narrow channels, dikes, covered channels) along the Bisagno river network (especially its lower part)
Geology Lithological and geomorphological This map details main soil types and lithological map (1:25.000) by Civil formations that can presently be observed Protection Service in the Bisagno river basin
Landuse Vegetal covering map Shows land zoning based on fire and landslide risk (1:25.000) by Civil Protection Service
Anthropical map (1:25.000) Shows urbanised areas and main engineering works by Civil Protection Service both along the river network and inside the basin (channels,
highways, important public buildings, etc.)
Regional technical map (1:5.000) Shows the detailed topography of the area surrounding the Bisagno river basin. Towns, contour lines, different types of vegetal covering and agriculture practices are well and clearly represented.
Hydrology Hydrological and hydraulic map Subdivided in five sections, showing respectively and (1:25.000) by Civil Protection Service soil permeability, risk areas, river shapes and processes,
hydraulics drinking waters, pollution sources
Historical maps S. Agostino Museum archive – Historical drawings of the lower river network (1:5.000 scale) Anonymous author (1797)
Papal States map (1800) Shows in good detail how towns, contour lines, different types of vegetation and agriculture practices (1:2.000 scale) were at the beginning of XIX century
IGM maps (1878 and 1930) Shows in great detail urbanised areas, contour lines, different types of vegetation and agriculture practices (1:25.000 scale) in 1878 and 1930
increase is minor (from 11 to 13%) between 1980 and 2000, so land-use modifications should be negligible. This is the business scenario for coping with floods in the area.
Intermediate Scenario. This scenario considers land-use
in 1930, when the urban area was about 7% of the basin. In these years, the outlet reach of the river was tunnelled as far as the Thyrrhenian sea. Under this scenario, which represents the pre-tunnelling conditions of the river system, the conveyance parameter of the FEST98 model is assumed to be 10% less than that of current scenario. This scenario, with the conveyance parameter’s empirically assigned value, reproduces the 1953
Fig. 2. Land use changes evolution for the five historical scenarios.
hydrographs observed from 1960 to 1990 (see Rulli and Rosso, 2002). Therefore, evaluation of the conveyance parameter in the model relies on the ability of the model to reproduce the observed flood hydrographs. The parameter values for the conveyance module of the FEST98 model are reported in Table 3 of the companion paper by Rulli and Rosso (2002). Also, the urban
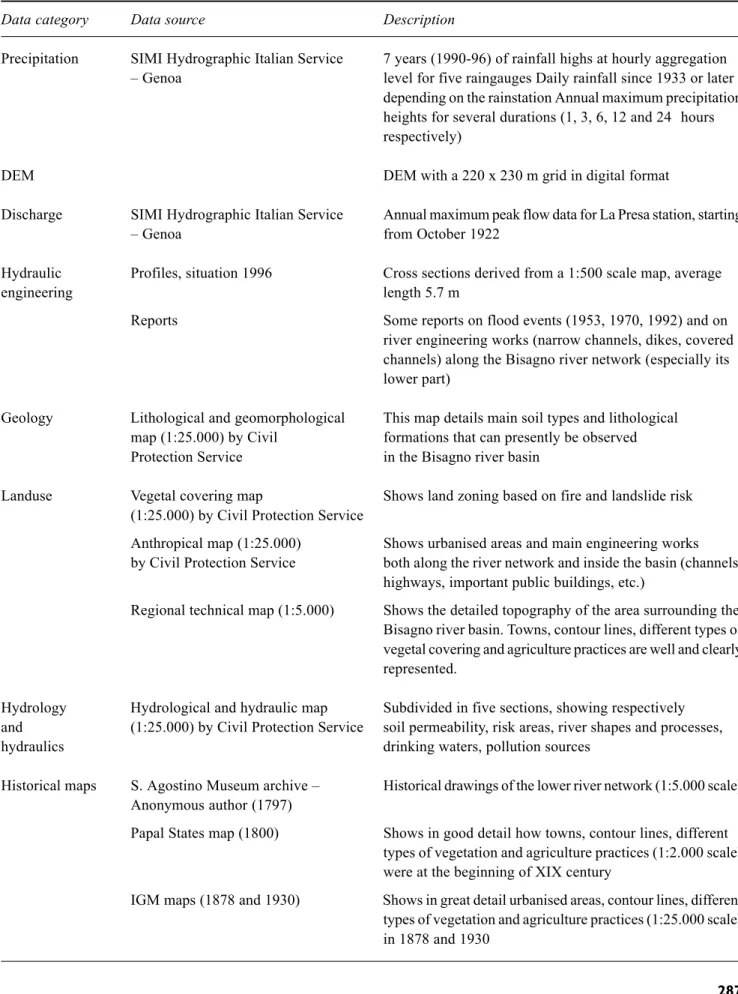
Fig. 3. Land use map referred to year 1980(a), to year 1930(b) and
to year 1878(c). Land use data are displayed on the basin DEM.
Bisagno river at La Presa
0 20 40 60 80 100 1800 1878 1930 1980 2000 Year Cumulated Percentage Special Crops Bare Soil Wineyard Crops Shrub Grass Olive Wood Urban Area
Bisagno river at Sant'Agata
0 20 40 60 80 100 1800 1878 1930 1980 2000 Year Cumulated Percentage Special Crops Bare Soil Wineyard Crops Shrub Grass Olive Wood Urban Area Rio Fereggiano 0 20 40 60 80 100 1800 1878 1930 1980 2000 Year Cumulated Percentage Special Crops Bare Soil Wineyard Crops Shrub Grass Olive Wood Urban Area
Urban area
Wood and forest
Shrub and bush
Grass
Special crops
Olive
Wineyard
Crop
Bare soil
An integrated simulation method for flash-flood risk assessment :2. Effect of historical changes in land use
observed flood hydrograph well (Fig. 4).
Control Scenario. This scenario refers to land use in 1878
and can be taken as representative of the pre industrial basin conditions. The changes, which occurred from 1805 to 1878, are minor (Fig. 2), although information on land-use for 1878 is more comprehensive than that for 1805.
Under the control scenario, the conveyance parameter of the FEST98 model is assumed to be 20% less than that of the current scenario. This accounts for the extended engineering works during the first part of the 20th century to include river areas within the city boundaries. Figure 5 shows an example of the huge engineering works that changed the river outlet by replacing the 19th century channelled reach (after the work following the 1822 destructive flood) with an undersized culvert which resulted in severe flooding of the area in the second part of the 20th
Fig. 4. FEST98 model validation. Comparison between observed and
simulated hydrographs at La Presa river cross station under 1930 land-use scenario. 0 50 100 150 200 250 300 350 400 0 4 8 12 16 20 24 28 Time(hours from 0.00 of 19thSeptember, 1953) Discharge (m3/s) 0 25 50 75 100 125 150 175 200 Rainfall (mm/h)
Fig. 5. Modification of the outlet reach of the Bisagno river by substituting its 19th century channellised course with a culvert with nominal
capability of 500 m3s–1 in year 1930.
Ponte della Pila
Sant’Agata Bridge Castelfidardo Bridge Railway Bridge Bezzecca Bridge Sant’Agata Bridge Castelfidardo Bridge Railway Bridge Roofed Concrete Channel
Year 1887
Year 1930
century. A concrete channel with a net width of 48 m had been substituted for the earlier larger river course with twin parallel wall banks. Unfortunately no hydrograph concerning this scenario is available to confirm the assumption about the river conveyance. Nevertheless, a sensitivity analysis of this parameter, for this land use scenario, showed it had little influence on basin response (Rosso and Rulli, 2000).
Figures 6 and 7 show the spatial distribution of the cells affected by the land-use changes between 1878 and 1930, and between 1930 and 1980, respectively. It is seen that these changes occurred mainly in the lower Bisagno valley from 1878 to 1930, while major changes occurred between 1930 and 1980 in the whole drainage basin. The variations in land use affect the resulting basin average SCS curve number parameterising storm abstraction. Note that the effects of changes in the Curve Number on the flood hydrograph depend strongly on the spatial distribution of these changes (Mancini and Rosso, 1989).
Simulation results and analysis
Using a seven years’ rainfall data set Monte Carlo simulation runs for 1000 years were performed by jointly using the
Fig. 6. Cells interested in land use change passing from year 1878 to year 1930 (see legend in Fig.3).
Fig. 7. Cells interested in land use change passing from year 1930 to year 1980 (see legend in Fig.3).
GNSRP and FEST98 models under the current scenario, that is, using present basin land-use (Fig. 3) to parametrise the FEST98 model (see Rulli and Rosso, 2002). This yields long sequences of 15 minute streamflow data which provide a synthetic data sample for each cross-section of the river network investigated. This procedure has been repeated to simulate a large number of runs (100) to obtain ensemble estimates of Annual Flood Series (AFS) at the chosen site, so obtaining the ensemble cumulative distribution function of maximum annual flow. The results from ensemble simulations were finally checked for accuracy using the data set of annual maximum flow available for La Presa station for a period of 48 years (Fig.8); the flood frequency curve obtained from the ensemble simulations provides a satisfactory goodness-of-fit to the sampling frequency. The seven-year record of rainfall observations was also used for river flow simulations. In spite of the small dimension of the AFS data set obtained using the seven-years recorded rainfall, a frequency analysis was carried out for comparison. This shows a minor overestimation by the flood frequency curve based on recorded rainfall on the other two curves (Fig. 9).
Flood frequency analysis of the AFS was performed using the Generalised Extreme Value (GEV) distribution.
An integrated simulation method for flash-flood risk assessment :2. Effect of historical changes in land use
Parameter estimates were obtained by the method of L-moments. Table 2 shows L-moment estimates of parameters for GEV distributions AFS, obtained both using simulated and seven years’ recorded rainfall, for the river cross-section at La Presa.
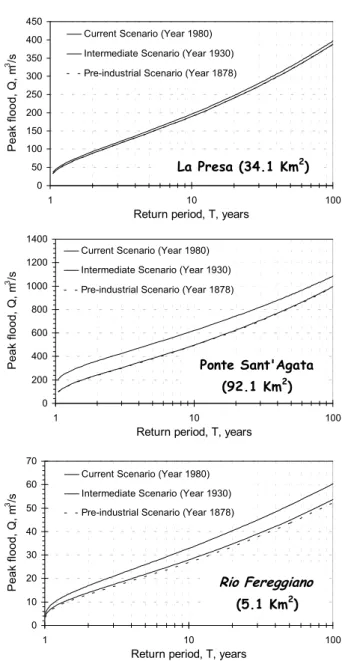
The procedure described above has been applied to the flood frequency curves which are reported for the three investigated scenarios, and for the three river sites examined in detail (Fig. 10). Table 3 reports the values of the GEV parameters.
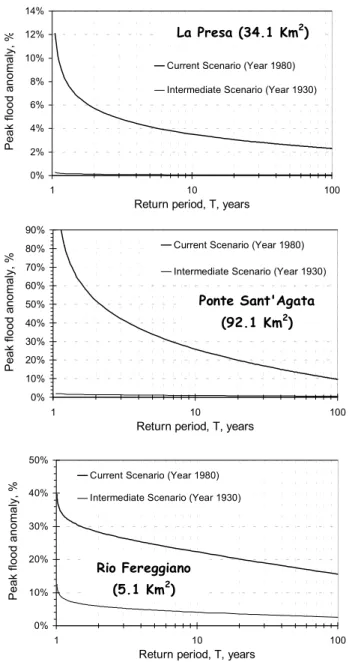
The results of the analysis are expressed also in terms of the flood prediction anomaly as the percentage change of the current and the intermediate scenarios to the preindustrial scenario, respectively (see Fig. 11). As expected, the flood
0 100 200 300 400 500 1 10 100
Return period, years
Maximum annual flow, m
3 s
-1
S-approach (Distributed Model) Observed Data
Bisagno at La Presa (34.1 Km2)
Fig. 8. Comparison of the GEV fitted to the ensemble Monte Carlo
simulations with the sampling frequency of observed flow data over 48 years for La Presa station
Bisagno at La Presa (34.1 Km2) 0 100 200 300 400 500 1 10 100
Return period, years
Maximum annual flow, m
3 s
-1 S-approach using GNSRP simulated
rainfall
S-approach using 7-years hystorical rainfall
Observed Data
Fig. 9. Comparison of the GEV fitted to the AFS obtained using the
7-years recorded rainfall with the sampling frequency of observed flow data over 48 years for La Presa station
Table 3. L-moment parameters estimates for GEV distributions of simulated AFS obtained using both simulated rainfall by GNSRP and historical 7-years data set for La Presa river cross-section.
GEV Parameters ξξξξξ ααααα k
AFS (Simulated rainfall) 78.00 41.00 –0.210 AFS (Historical 7-years data set) 87.00 42.00 –0.25
0 50 100 150 200 250 300 350 400 450 1 10 100
Return period, T, years
Peak flood, Q, m
3 /s
Current Scenario (Year 1980) Intermediate Scenario (Year 1930) Pre-industrial Scenario (Year 1878)
La Presa (34.1 Km2) 0 200 400 600 800 1000 1200 1400 1 10 100
Return period, T, years
Peak flood, Q, m
3 /s
Current Scenario (Year 1980) Intermediate Scenario (Year 1930) Pre-industrial Scenario (Year 1878)
Ponte Sant'Agata (92.1 Km2) 0 10 20 30 40 50 60 70 1 10 100
Return period, T, years
Peak flood, Q, m
3 /s
Current Scenario (Year 1980) Intermediate Scenario (Year 1930) Pre-industrial Scenario (Year 1878)
Rio Fereggiano
(5.1 Km2)
Fig. 10. Flood frequency estimates from the simulation approach to
the Bisagno river case study. The results are shown for the three land-use scenarios for three river sites: La Presa (upstream gauged site), Sant’Agata (basin outlet, that is, the inlet to the outlet tunnel) and Rio Fereggiano (major urban tributary).
anomaly for the intermediate scenario is negligible for the La Presa and Sant’Agata rivers sites, and it also appears to be very minor for Rio Fereggiano. This is because, in year 1930, the urbanisation process was at an early stage, so its effects are rather negligible. The flood anomaly for the current scenario is minor for the quasi-undisturbed catchment of the Bisagno river at La Presa, and the detected changes decrease rapidly with increasing return period.
Conversely, Rio Fereggiano displays a much larger
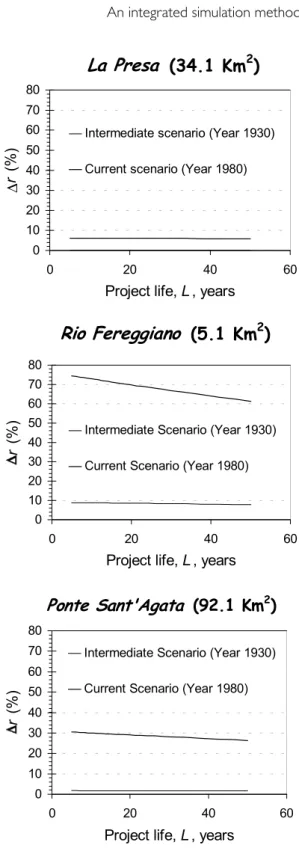
increase in flood predictions when the current scenario is compared with the pre-industrial situation. This enhancement tends, however, to decrease with return period, so the design flood estimate for civil infrastructures in Europe (that is, the 100-year return period) is only 16% larger than the (pre-industrial) control. Finally, one must consider carefully the flood anomaly for the mainstream at Sant’Agata under the current scenario. The overall changes are similar to those at Rio Fereggiano, but the increase in the 100-year flood is about 10%, whilst the increase of the mean annual flood is much higher than for Rio Fereggiano. This indicates that the changes in land use and river conveyance modify the flood frequency pattern, so affecting flows at any frequency as well as the shape of the flood frequency curve. Also, these structural modifications differ from mini-scale basins (such as Rio Fereggiano) to small mesoscale basins (such as the Bisagno River at Sant’Agata). Finally, a conventional flood risk analysis has been carried out for the land-use scenarios investigated. The risk evaluated here is the probability r that at least one flood exceeding the 200-year estimate occurs in L years, that is, in the life of the project (Fig. 12); according to present regulations this is taken as the design flood for major civil infrastructure in this area. Under both the intermediate and the current scenarios, the increase of flood risk, r, is negligible for the Bisagno River at La Presa. However, the enhancement of the risk for Rio Fereggiano is really significant in the current scenario, because it ranges from 0% 2% 4% 6% 8% 10% 12% 14% 1 10 100
Return period, T, years
Peak flood anomaly,
%
Current Scenario (Year 1980) Intermediate Scenario (Year 1930)
La Presa (34.1 Km2) 0% 10% 20% 30% 40% 50% 60% 70% 80% 90% 1 10 100
Return period, T, years
Peak flood anomaly, %
Current Scenario (Year 1980)
Intermediate Scenario (Year 1930)
Ponte Sant'Agata (92.1 Km2) 0% 10% 20% 30% 40% 50% 1 10 100
Return period, T, years
Peak flood anomaly,
% Current Scenario (Year 1980)
Intermediate Scenario (Year 1930)
Rio Fereggiano (5.1 Km2)
Fig. 11. Anomalies of flood frequency estimates from the simulation
approach to the Bisagno river case study. These anomalies show the percentage change of the flood estimate for a given return period as related to the control scenario (pre-industrial). The results are shown for three river sites: La Presa (upstream gauged site), Sant’Agata (basin outlet, that is, the inlet to the outlet tunnel) and Rio Fereggiano (major urban tributary).
Table 4. L-moment parameters estimates for GEV distribution of simulated AFS for Sant’Agata, La Presa and Rio Fereggiano river cross-sections under the three historical land use scenarios.
GEV Parameters ξ α k 1980 La Presa 78.00 41.00 –0.21 Ponte Sant’Agata 320.48 109.37 –0.17 Rio Fereggiano 14.28 6.92 –0.15 1930 La Presa 73.30 40.36 –0.21 Ponte Sant’Agata 202.07 102.98 –0.21 Rio Fereggiano 11.72 5.85 –0.18 1870 La Presa 73.20 40.35 –0.21 Ponte Sant’Agata 199.07 102.98 –0.21 Rio Fereggiano 11.01 5.67 –0.18
An integrated simulation method for flash-flood risk assessment :2. Effect of historical changes in land use
Conclusion
The collection and pre-processing of hydrological and river geomorphological data for the Bisagno river, including ancient information in maps, engineering reports and geographical treatises, information on the historical evolution of landscape and river geomorphology, has resulted in a pioneering attempt to approach flood risk assessments under historically conscious scientific grounds. The major results are concerned with the acquisition of the Bisagno River hydrology and river geomorphology data base including the drainage basin fine resolution Digital Land Use Models for five historical scenarios, i.e. years 2000, 1980, 1930, 1878 and 1805 and the hydraulic geometry of the lower river course of the Bisagno valley counting past and present high resolution figures; and with the assessment and demonstration of the stochastic-deterministic simulation procedure for flood frequency analysis based on coupling the GNSRP and FEST98 models. The analysis emphasised the need to improve various model components to assess the simulation approach. These include the internal structure of the GNSRP model, to improve the reproduction of the scaling properties of extreme storms; and the channel flow simulation module of the FEST98 model, to describe hydraulic geometry in more detail, because the present empirical conveyance parameterisation provides only an approximate description of streamflow propagation in diked river reaches. Simulations for the Pre-industrial (Year 1878), Intermediate (Year 1930) and Current (Year 1980) scenarios deal with land-use effects, with the goal of assessing distributed changes in land use due to agricultural practice and urbansation; and hydraulic conveyance effects, with the goal of assessing channel modifications associated with engineering works in the lower Bisagno River network. Because of the huge amount of simulation runs required to analyse the wide spectrum of scenarios, research was focused mainly on assessing the effects of land-use changes and, minor, river conveyance. Land-use changes proved to have a negligible impact on the upper Bisagno River, a moderate impact for the lower river, and a severe impact for the small tributaries in the lower Bisagno valley that drain densely populated urban areas. The simulation experiments, nevertheless, provide an insight into the sensitivity of the Bisagno River to land-use and river conveyance changes. The effects on the flood regime of the Bisagno River are significant, because the anthropogenic changes investigated modify the internal structure of the flood frequency pattern. Both flow behaviours at any frequency and the shape of the flood frequency curve are altered. Also, these structural modifications differ from miniscale basins to small mesoscale basins. However, the
0 10 20 30 40 50 60 70 80 0 20 40 60
Project life, L , years
∆
r (%)
Intermediate scenario (Year 1930) Current scenario (Year 1980)
La Presa
(34.1 Km
2)
0 10 20 30 40 50 60 70 80 0 20 40 60Project life, L , years
r (%)
Intermediate Scenario (Year 1930) Current Scenario (Year 1980)
Ponte Sant'Agata
(92.1 Km2) 0 10 20 30 40 50 60 70 80 0 20 40 60Project life, L , years
r (%)
Intermediate Scenario (Year 1930) Current Scenario (Year 1980)
Rio Fereggiano
(5.1 Km
2)
Fig. 12. Percentage increase of the estimated risk during the last
century for La Presa, Ponte Sant’Agata and Rio Fereggiano sites in the Bisagno river (Control Scenario: Year 1878).
70 to 60% for a project life ranging from 20 to 50 years. Finally, the risk increase for the mainstream at the basin outlet in the current scenario ranges from 22 to 18% for a project life from 10 to 50 years.
absolute anomaly decreases rapidly with return period in the Bisagno River, so the anthropogenic effects on design floods are minor as compared to other sources of uncertainty. This is because extreme floods in the basin are controlled mainly by a combination of very high storm precipitation rates, as occur in the NW Mediterranean area, and the moderate absorption capability of the basin terrain, because of the predominant soil and underlying rock types in this area of the Apennines range. The low sensitivity of extreme floods to changes in land use corresponds to the low sensitivity of extreme floods to climate change shown by Burlando et al. (1997) for the Entella River in Thyrrenian Liguria, not far from the Bisagno River.
Acknowledgements
The research was jointly supported by the European Commission through grant ENV4-CT97-0529 (FRAMEWORK project) and by CNR GNDCI of Italy through grant n.01.01072.PF42. Grateful thanks are due to Enda O’Connell and Aidan Burton (University of Newcastle-upon-Tyne) for providing rainfall modelling facilities. The hydrographic Service of Genoa is acknowledged for providing hourly rainfall data in the study area.
References
Cowpertwait, P.S.P., 1994. A generalized point process model for rainfall. Proc. Roy. Soc. London, A, 447, 23–37.
Cowpertwait, P.S.P., 1995. A generalized spatial-temporal model of rainfall based on a clustered point process. Proc. Roy. Soc.
London, A, 450, 163–175.
Burlando, P., Mancini, M. and Rosso, R., 1997. Impact of climate change on hydrological modeling and flood risk assessment. In: River basin Modelling, Management and Flood Mitigation
-RIBAMOD Concerted Action, R. Casale, K. Havno and P.
Samuels (Eds.). European Commission, Publication EUR 17456 EN, Luxemburg. 7–26.
Mancini, M., 1990. Modelling catchment hydrologic response:
effects of the spatial variability and the scale of representation of the soil absorption phenomenon. Ph.D. Thesis (in Italian),
Politecnico di Milano: Milan. 156pp.
Mancini, M., Montaldo, N. and Rosso, R., 2000. La modellistica distribuita nella valutazione degli effetti di laminazione di un sistema di invasi artificiali nel bacino del fiume Toce. L’Acqua, 4, 31–42.
Mancini, M. and Rosso, R., 1989. Using GIS to assess spatial variability of SCS Curve Number at the basin scale. IAHS Publ.
no. 181, 435–444.
Rosso, R. and Rulli, M.C., 2000. Evoluzione storica dell’uso del
suolo e portate di piena del torrente Bisagno, Atti XXVII
Convegno di Idraulica e Costruzioni Idrauliche, Genova, 12-15 settembre, 2000, 2, 267–275.
Rulli, M.C. and Rosso, R., 2002. An integrated simulation method for flash-flood risk assessment: 1. Frequency predictions in the Bisagno River by combining stochastic and deterministic methods. Hydrol. Earth Syst. Sci., 6, 267–283.
Soil Conservation Service, 1972. National Engineering Handbook,