HAL Id: hal-00317410
https://hal.archives-ouvertes.fr/hal-00317410
Submitted on 1 Jan 2002
HAL is a multi-disciplinary open access
archive for the deposit and dissemination of
sci-entific research documents, whether they are
pub-lished or not. The documents may come from
teaching and research institutions in France or
abroad, or from public or private research centers.
L’archive ouverte pluridisciplinaire HAL, est
destinée au dépôt et à la diffusion de documents
scientifiques de niveau recherche, publiés ou non,
émanant des établissements d’enseignement et de
recherche français ou étrangers, des laboratoires
publics ou privés.
observations from HRDI-UARS of the MLT region
A. H. Manson, Y. Luo, C. Meek
To cite this version:
A. H. Manson, Y. Luo, C. Meek. Global distributions of diurnal and semi-diurnal tides: observations
from HRDI-UARS of the MLT region. Annales Geophysicae, European Geosciences Union, 2002, 20
(11), pp.1877-1890. �hal-00317410�
Annales
Geophysicae
Global distributions of diurnal and semi-diurnal tides: observations
from HRDI-UARS of the MLT region
A. H. Manson, Y. Luo, and C. Meek
Institute of Space and Atmospheric Studies, University of Saskatchewan, SK, Canada Received: 14 September 2001 – Revised: 4 February 2002 – Accepted: 6 February 2002
Abstract. HRDI (High Resolution Doppler Interferometer-UARS) winds data have been analyzed in 4◦ latitude by
10◦longitude cells at 96 km to obtain global contour maps of solar-tidal amplitudes and phases, and also mean winds. The solstices June–July (1993), December–January (1993– 1994), and one equinox September–October (1994) are shown.
The 24-h diurnal tide that maximizes near the 20–25◦
lat-itude has significant seasonal changes with equinoctial max-ima, and very clear longitudinal variability. Maxima are very clear over the oceans. In contrast, the 12-h semi-diurnal tides that maximize near the 40–55◦latitude have very strong sea-sonal changes with winter maxima, and more modest longi-tudinal changes. The similarities with MLT (mesosphere-lower thermosphere) radar observations (90 km) and the GSWM (Global Scale Wave Model) are very satisfactory.
The mean winds are consistent with expectations and show clear poleward flow from summer to winter hemispheres in the solstices.
Key words. Meteorology and atmospheric dynamics (mid-dle atmosphere dynamics; waves and tides) Radio science (remote sensing)
1 Introduction
Much progress in our knowledge and understanding of so-lar tides (60–100 km) has occurred during the last fifteen years. Tidal campaigns, complete with observations and modelling, have been part of major global programmes: MAP (Middle Atmosphere Programme) 1982–1988, STEP (Solar Terrestrial Energy Programme) 1991–1997; PSMOS and S-RAMP (Planetary Scale Mesopause Observing Sys-tem; STEP-Results, Applications, and Modelling Phase) 1998–2002, and the various Phases of the American CEDAR
Correspondence to: A. H. Manson
(manson@dansas.usask.ca)
activity (Coupling Energetics and Dynamics of Atmospheric Regions).
Ground-based contributions have involved mainly MLT (Mesosphere Lower Thermosphere) radars, including the MFR (Medium Frequency Radars) and MWR (Meteor Wind Radar) systems. The most recent papers have included in-creasingly global distributions, with quite comprehensive lat-itudinal coverage (Pacific-North American) and an increase in the availability of longitudinal chains (near 50◦N). They have also shown, by comparisons modelled tides from the well known GSWM (Global Scale Wave Models 1998 and 2000; Hagan et al., 1999, 2001). This 2-D model employs observed distributions of background winds, temperatures, ozone and water vapour and involves all relevant dynamical processes, such as eddy diffusion and gravity wave-drag.
The principle papers for our purposes are Manson et al. (1999, 2001a, hereafter Paper 1), Jacobi et al. (1999) and Pancheva et al. (2002, hereafter Paper 2). They have pro-vided knowledge of tidal winds (60–100 km), their ampli-tudes and phases, for comprehensive ranges of latiampli-tudes (equator to poles) with monthly (and higher) resolution. Most recently, we have also used special experiments with a General Circulation Model called CMAM (Canadian Mid-dle Atmosphere Model), which is a full Chemical-Dynamical system (Beagley et al., 1997; Manson et al., 2002a, b), to compare with observations. Briefly, the original (1995) and new (2000) GSWMs have 24-h tidal winds in excellent agreement with the MLT radar winds, while agreement for the 12-h tide is rather more modest. In contrast, the CMAM provides excellent 12-h tides and poorer 24-h tides. De-tailed assessment or diagnosis of these models, particularly CMAM, with the view of understanding these successes and comparative features is proceeding. One significant weak-ness of these tidal studies has been the lack of full longitudi-nal coverage.
Satellite observations have contributed significantly in other ways: the HRDI (High Resolution Doppler Imager) and WINDII (Wind Imaging Interferometer) systems of UARS (Upper Atmosphere Research Satellite) have been
0 5 10 15 20 25 30 35 40 45 50 55 Amplitude (m/s)
HRDI 24h wave amplitudes for zonal wind at 96km, Jun-Jul/93
-180 -150 -120 -90 -60 -30 0 30 60 90 120 150 180 Longitude -70 -60 -50 -40 -30 -20 -10 0 10 20 30 40 50 60 70 Latitude Ave./GSWM 0 10 20 30 40 50 Amplitude (m/s) -70 -60 -50 -40 -30 -20 -10 0 10 20 30 40 50 60 70 0 5 10 15 20 25 30 35 40 45 50 55 Amplitude (m/s)
HRDI 24h wave amplitudes for meridional wind at 96km, Jun-Jul/93
-180 -150 -120 -90 -60 -30 0 30 60 90 120 150 180 Longitude -70 -60 -50 -40 -30 -20 -10 0 10 20 30 40 50 60 70 Latitude Ave./GSWM 0 10 20 30 40 50 Amplitude (m/s) -70 -60 -50 -40 -30 -20 -10 0 10 20 30 40 50 60 70
Fig. 1. Contoured plots of 24-h tidal amplitudes for June–July 1993 from HRDI. The longitudinal averages are to the right (solid line), and also the GSWM-2000 values (dotted).
dominant. The early comprehensive papers included those by McLandress et al. (1996), Burrage et al. (1996) and Khat-tatov et al. (1996), while more recent, focused studies include Yudin et al. (1997), who used assimilation techniques in their model. Although the dynamical dominance of the tidal oscil-lations in the MLT is evident in the WINDII-HRDI data at all longitudes and latitudes, the majority of the published stud-ies have focused on the lower-latitude 24-h tide (S11 mode) and in global Hough-mode analyses, i.e. the global tide, with no longitudinal dependence. A study of the global 12-h tide at latitudes from 0◦to 50◦, which also depend upon Hough-mode fitting and solutions (Mark Burrage, private communi-cation), was reported by Manson et al. (1999).
A method of tidal analysis based upon the formation of lo-cal time sequences of winds over about 2 months from satel-lite data (HRDI) was employed by Khattatov et al. (1996) for a limited range of (radar) locations. Since then it has been little used. The method is naturally attractive to ground-based observers, who have noted longitudinal variations in tidal amplitudes, and who analyze their local time-sequences of data in similar fashions. Here we will use the HRDI data from 96 km, where there are daytime and nighttime
obser-vations, to provide global latitudinal (0–70◦) and longitudi-nal distributions of the solstitial and equinoctial 12- and 24-h tides.
There has been growing interest in the causes of longi-tudinal tidal variability, which include tropospheric latent-heat release in the tropical troposphere, e.g. Forbes et al. (1997), plus longitudinal variations of water vapour (Hagan et al., 1997a). In Hagan et al. (1997b), the latent-heat ef-fects upon the 24-h tide were further investigated using the GSWM, with the addition of non solar-migrating tidal modes to provide longitudinal tidal structures (at four 90◦sectors).
The comparative WINDII data were used to form two-month wind time-sequences from which 24-h tidal amplitudes were obtained for each 90◦sector, over latitudes from 0 to 40◦N/S. The HRDI data used here will provide global 12- and 24-h tidal amplitudes and phases, from 4◦latitude and 10◦ longi-tude cells, for the solstices of June–July (1993), December– January (1993/1994) and the equinox of September–October (1994). No tidal spatial (Hough) modes will be assumed for the solutions, but simply the local temporal wind variations will be used to define the tidal characteristics.
0 1 2 3 4 5 6 7 8 9 10 11 12 13 14 15 16 17 18 19 20 21 22 23 24 Local Ti me (Hr)
HRDI 24h wave phases for zonal wind at 96km, Jun-Jul/93
-180 -150 -120 -90 -60 -30 0 30 60 90 120 150 180 Longitude -70 -60 -50 -40 -30 -20 -10 0 10 20 30 40 50 60 70 Latitude 0 1 2 3 4 5 6 7 8 9 10 11 12 13 14 15 16 17 18 19 20 21 22 23 24 Local Ti me (Hr)
HRDI 24h wave phases for meridional wind at 96km, Jun-Jul/93
-180 -150 -120 -90 -60 -30 0 30 60 90 120 150 180 Longitude -70 -60 -50 -40 -30 -20 -10 0 10 20 30 40 50 60 70 Latitude
Fig. 2. Contoured plots of 24-h tidal phases for June–July 1993 from HRDI.
observations. The 24-h tidal-wind amplitudes and phases for the three seasons will be presented in Sect. 3, and those for the 12-h tide in Sect. 4. The mean winds are discussed in Sect. 5. There will be a discussion of comparative radar data and the GSWM results in each section.
2 HRDI wind analysis
The High-Resolution Doppler Imager (HRDI) is an in-strument aboard the Upper Atmosphere Research Satellite (UARS). HRDI measures the horizontal winds by observ-ing the Doppler shift of the emission and absorption lines of molecular oxygen in small atmospheric volumes (4 km in height by 50 km in width) above the limb of the Earth. In this paper, HRDI winds data are obtained from the God-dard Space Flight Center (GSFC) Distributed Active Archive Center (DAAC) in Level 3AL format for the three intervals.
The height of 96 km is selected for our tidal studies because around this altitude, a narrow chemical source emission layer makes nighttime observations available. At a given latitude and longitude, the temporal resolution of HRDI measure-ments is determined by the slow precession of the UARS orbit; local times of observations differ by about 20 min on consecutive days due to the UARS orbit precession. There-fore, about 36 days of observations on both ascending and descending portions of the orbit are needed to cover all local times.
In this paper, at each 4◦by 10◦(latitude/longitude) area or cell, time sequences of the HRDI winds for the two months were reformed into 24 h mean-days only, according to their local time of day. After that, a harmonic fitting was applied to the mean-day data, to obtain the mean winds, and the am-plitudes and phases of the 24- and 12-h tides. When the time coverage of the mean-day data was larger than 16 hours for
0 5 10 15 20 25 30 35 40 45 50 55 Amplitude (m/s)
HRDI 24h wave amplitudes for zonal wind at 96km, Dec/93-Jan/94
-180 -150 -120 -90 -60 -30 0 30 60 90 120 150 180 Longitude -70 -60 -50 -40 -30 -20 -10 0 10 20 30 40 50 60 70 Latitude Ave./GSWM 0 10 20 30 40 50 Amplitude (m/s) -70 -60 -50 -40 -30 -20 -10 0 10 20 30 40 50 60 70 0 5 10 15 20 25 30 35 40 45 50 55 Amplitude (m/s)
HRDI 24h wave amplitudes for meridional wind at 96km, Dec/93-Jan/94
-180 -150 -120 -90 -60 -30 0 30 60 90 120 150 180 Longitude -70 -60 -50 -40 -30 -20 -10 0 10 20 30 40 50 60 70 Latitude Ave./GSWM 0 10 20 30 40 50 Amplitude (m/s) -70 -60 -50 -40 -30 -20 -10 0 10 20 30 40 50 60 70
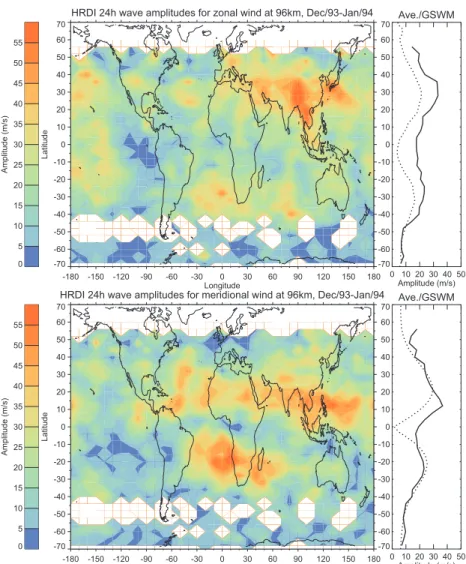
Fig. 3. Contoured plots of 24-h
tidal amplitudes for December 1993– January 1994 from HRDI. The longi-tudinal averages are to the right (solid line), and also the GSWM-2000 values (dotted).
a day, the mean wind and 24- and 12-h oscillations were all fitted. However, when the data yield was low (<16 h, but
>8 h was required), typically above 50◦, due to the lack of daytime or nighttime data, depending upon the local time of the UARS orbit, only 12-h oscillation fitting was accepted. Analyses of radar data in this way has been shown to be ap-propriate by us, using MFRs (unpublished), and by Jacobi et al. (1999). Also at the higher latitudes, where the 12-h oscil-lation fitting was done, the 24-h tidal amplitudes are small, and so is the induced error. The 12h-only fitting was useful from 45–70◦in NH and SH summers. It became clear as the
analyses proceeded that excellent consistency was occurring between neighbouring cells for amplitude and phase. The presentation style is, therefore, one of showing a full global grid of latitudes and longitudes, with land images, and color contours for the amplitudes and phases.
Significance estimates suggested that amplitudes less than 5–10 m/s were noisy, and this will be confirmed in Sects. 3 and 4 by inspection of the phase contours, which show more random phases in these regions. Otherwise, the phases will show large areas of common phase.
3 HRDI tidal winds: 24-h oscillations 3.1 Solstices
The tidal amplitudes and phases for June–July (1993) are shown in Figs. 1 and 2 and those for December–January (1993–1994) in Figs. 3 and 4. Tidal data are mainly available from 40◦ to 55◦, with the winter season having the greater coverage in each solstice. The plot at the right of the ampli-tude figures contains the longitudinal means (solid line) and the GSWM 2000 results (dotted) for 96 km.
We comment first upon the longitudinal means. Looking at the June–July solstice (Fig. 1), the GSWM 2000 and obser-vations for the meridional component show winter maxima near 20–30◦S. The agreement between the two is very good, although the GSWM amplitudes are larger. The agreement is less so for the zonal, where no low-latitude maxima are ob-served, although the winter amplitudes at these latitudes are larger in the winter than the summer hemispheres. There are also interesting maxima near 50◦S, which are not realized with GSWM. The winter-season amplitudes are also larger in December–January (Fig. 3), with the 20–30◦N maxima
be-0 1 2 3 4 5 6 7 8 9 10 11 12 13 14 15 16 17 18 19 20 21 22 23 24 Local Ti me (Hr)
HRDI 24h wave phases for zonal wind at 96km, Dec/93-Jan/94
-180 -150 -120 -90 -60 -30 0 30 60 90 120 150 180 Longitude -70 -60 -50 -40 -30 -20 -10 0 10 20 30 40 50 60 70 Latitude 0 1 2 3 4 5 6 7 8 9 10 11 12 13 14 15 16 17 18 19 20 21 22 23 24 Local Ti me (Hr)
HRDI 24h wave phases for meridional wind at 96km, Dec/93-Jan/94
-180 -150 -120 -90 -60 -30 0 30 60 90 120 150 180 Longitude -70 -60 -50 -40 -30 -20 -10 0 10 20 30 40 50 60 70 Latitude
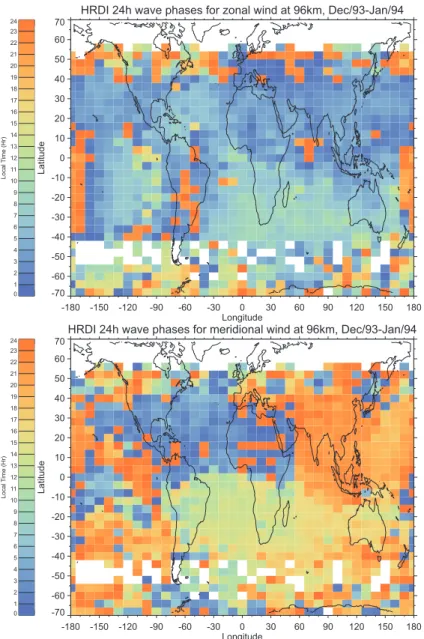
Fig. 4. Contoured plots of 24-h tidal phases for December 1993–January 1994 from HRDI.
ing clear in the GSWM 2000 and HRDI observations. Agree-ment between the observations and the model for the merid-ional component is again better, with the observed zonal am-plitudes being larger than GSWM 2000. There are no indi-cations of 50◦N maxima in Fig. 3.
It is important to note that comparisons between tidal winds from near 90 km for MLT radars and GSWM (1995 and 2000) have also been excellent agreement, in general, for all months of the year: Manson et al. (1999, 2002a) used radars from the North American-East Pacific sector (81◦W– 157◦W), and Pancheva et al. (2002) used a larger number of radars, including systems in Europe, Japan and the South-ern Hemisphere. We will not show any detailed radar-HRDI comparisons here, mainly because the heights above 90 km are known to provide speed-biased winds from the MFR’s (at least a factor of 1.5 reduction is common, Paper 1 ), and also because our emphasis here is upon the new HRDI tidal results and their global structure. In summary, previous work
has shown that for this tide, the longitudinally selected or av-eraged MLT radar and GSWM tidal winds at 90 km are in excellent agreement, and the HRDI and GSWM tidal winds at 96 km (Figs. 1 and 3) are also very similar.
The longitudinal variations in Figs. 1 and 3 are a unique and fascinating HRDI-derived tidal data set. Variations by factors of two or more are evident. The zonal component, for both solstices, show maxima in the major oceans (Pacific, At-lantic and Indian), particularly in the Southern Hemisphere (SH). This is consistent with water vapour and latent heat re-gional sources (Sect. 1). There is also a strong maximum in the NH from Europe to Asia during their winter (December– January) (Fig. 3). The meridional component shows max-ima for the June-July solstice in the SH Indian and eastern-Pacific oceans and for December–January in the Atlantic and western-Indian oceans. The Europe-Asia maximum is again evident in the NH winter (Fig. 3) but displaced southward to 20◦, which is consistent with the GSWM plot. Minima are
0 5 10 15 20 25 30 35 40 45 50 55 Amplitude (m/s)
HRDI 24h wave amplitudes for zonal wind at 96km, Sep-Oct/94
-180 -150 -120 -90 -60 -30 0 30 60 90 120 150 180 Longitude -70 -60 -50 -40 -30 -20 -10 0 10 20 30 40 50 60 70 Latitude Ave./GSWM 0 10 20 30 40 50 Amplitude (m/s) -70 -60 -50 -40 -30 -20 -10 0 10 20 30 40 50 60 70 0 5 10 15 20 25 30 35 40 45 50 55 Amplitude (m/s)
HRDI 24h wave amplitudes for meridional wind at 96km, Sep-Oct/94
-180 -150 -120 -90 -60 -30 0 30 60 90 120 150 180 Longitude -70 -60 -50 -40 -30 -20 -10 0 10 20 30 40 50 60 70 Latitude Ave./GSWM 0 10 20 30 40 50 Amplitude (m/s) -70 -60 -50 -40 -30 -20 -10 0 10 20 30 40 50 60 70
Fig. 5. Contoured plots of 24-h
tidal amplitudes for September–Octo-ber 1994 from HRDI. The longitudinal averages are to the right (solid line), and also the GSWM-2000 values (dotted).
often seen in the eastern-Pacific.
The MLT radar studies of longitudinal variations are mini-mal, but consistent in general terms with these new tidal data. Pancheva et al. (2002), using data from 46–55◦N for the summer of 1999, found the ratio of North American ampli-tudes compared to eastern Europe to be about 1.4. This is of similar size to the typical HRDI ratios (yellow to light blue) of near 2. Unfortunately in June–July, the 24-h tidal cover-age extends to 40◦only (Fig. 1), so direct comparisons can-not be made. In December–January (Fig. 3) when the HRDI colour-structures are often different, eastern-European am-plitudes are greater than North American for the zonal com-ponent, but similar for the meridional. There are no radar comparison results available. We have compared the 90 km MFR data available for the North American-Pacific sector (Manson et al., 1999; Saskatoon (52◦N, 107◦W), London (43◦N, 81◦W), Hawaii (21◦N, 157◦W), and Xmas Island (2◦N, 157◦W)), with the regional areas of Figs. 1 and 3, and found useful similarities: both show highest values near 20– 30◦N (as do the longitudinal mean data and GSWM 2-D val-ues in Figs. 1 and 3), while HRDI valval-ues are either equal to the MFR values or larger by up to 100%. This is
consis-tent with the speed bias of 15–40% (low) for MFR speeds up to near 90 km (Manson et al. 1999) and the greater heights of the HRDI data (96 versus 90 km). Considering that the HRDI data are a mean over 2 months, where the local times are spread sequentially over the 2 months, and the MLT data have most local times available each day, the similarities ev-idenced in the MLT-MFR longitudinal comparisons are rea-sonable.
The corresponding 24-h tidal phases from HRDI are shown in Figs. 2 and 4. Generally speaking, and visually very clearly, there are large areas of consistent phase, especially where the amplitudes are the largest. The rotation sense of the tides is generally consistent with a well-behaved tide: in Fig. 2 for June–July, the SH rotation of the zonal wind per-turbation (light blue) to the meridional (yellow-green) is anti-clockwise (∼6-h difference). In the NH, the colour contrast is not as clear, but an ∼6-h rotation from (meridional) blue to zonal (light-green) is in the expected clockwise sense, but again not exact quadrature (this latter state is only expected for a pure tidal mode). We note that there are longitudinal phase structures (modest colour changes) which correspond to the amplitude structures very well. This is expected, as
0 1 2 3 4 5 6 7 8 9 10 11 12 13 14 15 16 17 18 19 20 21 22 23 24 Local Ti me (Hr)
HRDI 24h wave phases for zonal wind at 96km, Sep-Oct/94
-180 -150 -120 -90 -60 -30 0 30 60 90 120 150 180 Longitude -70 -60 -50 -40 -30 -20 -10 0 10 20 30 40 50 60 70 Latitude 0 1 2 3 4 5 6 7 8 9 10 11 12 13 14 15 16 17 18 19 20 21 22 23 24 Local Ti me (Hr)
HRDI 24h wave phases for meridional wind at 96km, Sep-Oct/94
-180 -150 -120 -90 -60 -30 0 30 60 90 120 150 180 Longitude -70 -60 -50 -40 -30 -20 -10 0 10 20 30 40 50 60 70 Latitude
Fig. 6. Contoured plots of 24-h tidal phases for September–October 1994 from HRDI.
superposition of the solar-migrating modes and modes as-sociated with the larger regional tidal features will lead to changes in measured phase compared to the areas of small-amplitude regional tidal features. The MLT radar phases (Pancheva et al., 2002; Manson et al., 1999, 2002a) are in excellent agreement with those in Fig. 2, e.g. typical zonal phases at 20◦–30◦N are near 12:00 LT (darkish green).
The December–January phases (Fig. 4) are also well-behaved; and again, the winter hemisphere with the largest amplitudes (average and regionally) show the largest areas of consistency (single colour, or sharp-colour jump as we move from 24:00 to 01:00 LT). The rotation senses and phase differences (again ∼6 h) are very consistent for each hemi-sphere. Also the phase (colour) differences between June– July and December–January are consistent with the signif-icant seasonal NH changes noted in Manson et al. (1999, 2002a). Again, the 90 km MLT radar-derived tidal phases
from the above paper are consistent with those in Fig. 4: the HRDI phases are a few hours smaller than the MLT radars. This is consistent with downward phase propagation of the tide, which has smaller wavelengths in winter. We note that the radar data show that the interannual phase variabilities are quite modest, so comparisons of HRDI 1993/1994 data with MLT radar 1990–1997 data are acceptable.
3.2 Equinox, September–October 1994
We have completed the analysis for one equinox. These are not the best times for such an analysis, which ideally should be conducted during two-month intervals (Sect. 2) that are close to stationary. Our studies, e.g. Manson et al. (1999), and CIRA-1986 (Rees et al., 1990), show very clearly that the background winds are more variable then than during the solstices, and that the 12-h tide at mid-latitudes undergoes strong changes in amplitude and phase. However, the
low-0 5 10 15 20 25 30 35 40 45 50 55 Amplitude (m/s)
HRDI 12h wave amplitudes for zonal wind at 96km, Jun-Jul/93
-180 -150 -120 -90 -60 -30 0 30 60 90 120 150 180 Longitude -70 -60 -50 -40 -30 -20 -10 0 10 20 30 40 50 60 70 Latitude Ave./GSWM 0 10 20 30 40 50 Amplitude (m/s) -70 -60 -50 -40 -30 -20 -10 0 10 20 30 40 50 60 70 0 5 10 15 20 25 30 35 40 45 50 55 Amplitude (m/s)
HRDI 12h wave amplitudes for meridional wind at 96km, Jun-Jul/93
-180 -150 -120 -90 -60 -30 0 30 60 90 120 150 180 Longitude -70 -60 -50 -40 -30 -20 -10 0 10 20 30 40 50 60 70 Latitude Ave./GSWM 0 10 20 30 40 50 Amplitude (m/s) -70 -60 -50 -40 -30 -20 -10 0 10 20 30 40 50 60 70
Fig. 7. Contoured plots of 12-h tidal amplitudes for June–July 1993 from HRDI. The longitudinal averages are to the right (solid line), and also the GSWM-2000 values (dotted).
latitude 24-h tide is less variable, and the analysis is worth-while as the expectations are for a very large tide.
The tidal amplitudes and phases are shown in Figs. 5 and 6. These are to be taken as a seasonal indicator only, as the tide for September or October individually could differ in some detail. This is unlike the solstice situation. However, the longitudinal averages show clear symmetrical and quite large amplitudes about the equator near 20–25◦, especially for the meridional component. Note that the values are less than GSWM, whereas for the solstices they were very simi-lar. Radar values were also somewhat smaller than GSWM (Paper 1) in the equinoctial months. The longitudinal vari-ability strongly favours the oceans for the largest tides in the zonal component, and there are large regions of enhanced amplitude for the meridional component.
The hemispheric symmetry favours the dominance of sym-metric tidal modes, especially the S11 mode, and the phases of Fig. 6 are consistent with this: the zonal phases at 20– 30◦ show symmetry (in-phase) and the meridional out-of-phase behaviour about the equator. They are rotating ap-propriately, but the component-phase differences are usually 6–8 h rather than exact quadrature. Again, the actual
phase-values are quite consistent with the GSWM and MLT radar values of Manson et al. (1999, 2002a) for 90 km at mid-latitudes, which are 2–3 h later in time due to downward phase propagation. Note that over the eastern Pacific near Hawaii (21◦N, 155◦W) component-phases differ by just a few hours at 96 km, as did the MLT radars phases in the ear-lier studies.
4 HRDI tidal winds: 12-h oscillations
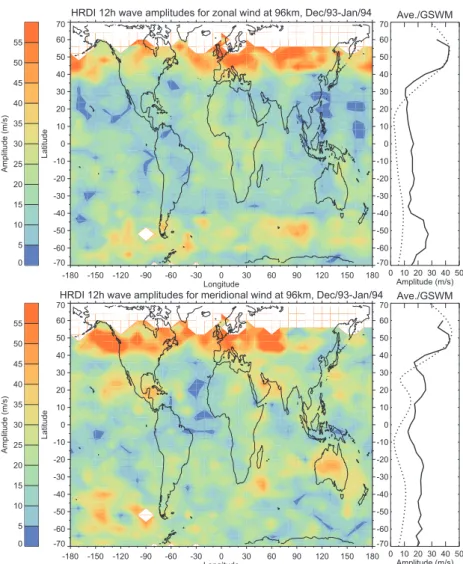
The global amplitude plots (Figs. 7 and 9), and also the lon-gitudinal means and GSWM (2-D) show the expected dom-inance of the winter tide over the summer, for both zonal and meridional components (Paper 1). Unlike the 24-h tide, this tide maximizes at higher latitudes near 40–55◦. Notice, however, that the summer amplitudes of the June-July sol-stice are larger than for December–January, with the merid-ional values approaching those of the winter hemisphere. And finally, the longitudinal means of Figs. 7 and 9 ex-ceed the GSWM significantly in the summer hemispheres, but match well in the winter. This was also clearly evident
0 1 2 3 4 5 6 7 8 9 10 11 12 Local Ti me (Hr)
HRDI 12h wave phases for zonal wind at 96km, Jun-Jul/93
-180 -150 -120 -90 -60 -30 0 30 60 90 120 150 180 Longitude -70 -60 -50 -40 -30 -20 -10 0 10 20 30 40 50 60 70 Latitude 0 1 2 3 4 5 6 7 8 9 10 11 12 Local Ti me (Hr)
HRDI 12h wave phases for meridional wind at 96km, Jun-Jul/93
-180 -150 -120 -90 -60 -30 0 30 60 90 120 150 180 Longitude -70 -60 -50 -40 -30 -20 -10 0 10 20 30 40 50 60 70 Latitude
Fig. 8. Contoured plots of 12-h tidal phases for June–July 1993 from HRDI.
in the MLT radar studies of Paper 1 for the North American-Pacific sector, and in Paper 2 for the June–August interval of 1999. In these studies, the GSWM was shown to com-pare in this and other ways (wavelengths, phases) less well with the MLT radars than for the 24-h tide. Finally, we note a strong equatorial maximum in the amplitudes of the ob-served meridional tide during the June–July solstice, which is not seen in the GSWM. Otherwise, although such a lo-cal maximum is not seen in the zonal component of Fig. 7 or during the December–January solstice (Fig. 9), the HRDI data at the equator do show consistently greater amplitudes than GSWM.
The radar comparisons are again useful. Paper 2 showed for the summer of 1999 larger amplitudes over eastern Eu-rope than Canada/North America. The HRDI data for 1993 (Fig. 7) also show somewhat larger yellow regions (higher amplitudes) there than does North America. However, Ja-cobi et al. (1999) (using similar radars for 1985–1995) found no difference between eastern Europe and western Canada. Finally, in the winter, Jacobi et al. (1999) showed larger am-plitudes over western Canada than over eastern Europe. In
contrast, HRDI (1993/1994) shows little indication of such longitudinal change; indeed for the zonal component west-ern Canada is weaker than Europe. We have compared the MFR data (Paper 1) from the North American-Pacific quad-rant for 1990–1996, especially 1993, with the regional areas of Figs. 7 and 9 and found useful similarities again: both gen-erally show the highest values near 40–50◦N in winter, while HRDI values are either equal to the MFR values or larger by up to 100%. This is consistent with the speed bias for the MFR systems and the greater height of the HRDI data (96 versus 90 km).
The comparisons have again been useful; however, differ-ences in the years involved, the use of different types of MLT radars, and the higher altitude for the HRDI data than that preferred for the radars (∼90 km) make longitudinal assess-ments from radars very challenging. The HRDI tidal plots are clearly superior for such longitudinal assessments.
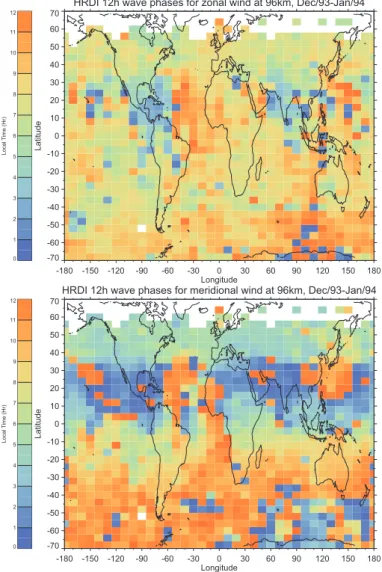
The corresponding 12-h tidal phases are shown in Figs. 8 and 10. There are again large areas of common phase, show-ing modest longitudinal change for this tide, for both sol-stices. The phase differences between EW and NS
compo-0 5 10 15 20 25 30 35 40 45 50 55 Amplitude (m/s)
HRDI 12h wave amplitudes for zonal wind at 96km, Dec/93-Jan/94
-180 -150 -120 -90 -60 -30 0 30 60 90 120 150 180 Longitude -70 -60 -50 -40 -30 -20 -10 0 10 20 30 40 50 60 70 Latitude Ave./GSWM 0 10 20 30 40 50 Amplitude (m/s) -70 -60 -50 -40 -30 -20 -10 0 10 20 30 40 50 60 70 0 5 10 15 20 25 30 35 40 45 50 55 Amplitude (m/s)
HRDI 12h wave amplitudes for meridional wind at 96km, Dec/93-Jan/94
-180 -150 -120 -90 -60 -30 0 30 60 90 120 150 180 Longitude -70 -60 -50 -40 -30 -20 -10 0 10 20 30 40 50 60 70 Latitude Ave./GSWM 0 10 20 30 40 50 Amplitude (m/s) -70 -60 -50 -40 -30 -20 -10 0 10 20 30 40 50 60 70
Fig. 9. Contoured plots of 12-h
tidal amplitudes for December 1993– January 1994 from HRDI. The longi-tudinal averages are to the right (solid line), and also the GSWM-2000 values (dotted).
nents are again most evident in the winter seasons, but even in the summers the phases are well defined.
In June–July (Fig. 8), the tide rotation is clockwise above 15◦N and anti-clockwise beyond 30◦S, as expected, and close to quadrature. Also for December–January (Fig. 10), the higher latitude relative EW and NS phases are well be-haved and in quadrature, and are also consistent with the MLT radars. In the summer hemispheres where the verti-cal wavelengths are long (ca. 100 km, Paper 1), HRDI and radar phase values are very similar to those in Paper 1 and Paper 2 (90–95 km). Notice that in both figures, the win-ter hemisphere shows strong latitudinal trends in colours and phases; these are also features of GSWM and the MLTs (see above papers again).
Just as there are weaker longitudinal amplitude-structures for the semidiurnal tide, the phase structures are also less ap-parent. There is a phase-change or structure over northern Asia in June–July, but the tidal rotation sense is unchanged; and also one in the southern Arctic Ocean, south of Australia in December–January, when the times-phases are advanced in each component but remain in quadrature. Pancheva et al. (2002) and Jacobi et al. (1999) show longitudinal phase
variations (90–95 km) in the June–August interval for 43– 56◦N, with somewhat irregular differences of about 1 h over the longitudinal-range from eastern Europe to North Amer-ica; this is consistent with Fig. 8. And in January, Jacobi et al. (1999) shows slightly larger variations (∼1.5 h) between eastern Europe and Canada, but these are again not smoothly varying with longitude; this is similar to Fig. 8, where the colour changes are irregular and of 2 h or so. In general, the years in the MLT radar and HRDI Northern Hemisphere comparisons differ, but the general character of small vari-ability with longitude is the same for both seasons.
5 HRDI mean winds: soltices and September/October equinox
Although the tides were of greater interest, the 96 km mean winds, which are another product of the harmonic analysis, are valuable as a further indication of the robustness of the analysis. Figures 11 and 12 show that the strongest east-ward winds are in the middle latitudes of the summer hemi-spheres, while the winter hemispheres demonstrate weaker
0 1 2 3 4 5 6 7 8 9 10 11 12 Local Ti me (Hr)
HRDI 12h wave phases for zonal wind at 96km, Dec/93-Jan/94
-180 -150 -120 -90 -60 -30 0 30 60 90 120 150 180 Longitude -70 -60 -50 -40 -30 -20 -10 0 10 20 30 40 50 60 70 Latitude 0 1 2 3 4 5 6 7 8 9 10 11 12 Local Ti me (Hr)
HRDI 12h wave phases for meridional wind at 96km, Dec/93-Jan/94
-180 -150 -120 -90 -60 -30 0 30 60 90 120 150 180 Longitude -70 -60 -50 -40 -30 -20 -10 0 10 20 30 40 50 60 70 Latitude
Fig. 10. Contoured plots of 12-h tidal phases for December 1993–January 1994 from HRDI.
eastward winds. This is consistent with the earlier papers from HRDI and the MLT radars, e.g. Manson et al. (1991), referenced in the Introduction: the strong summer flow is part of the very strong cell sitting on top of the stratosphericme-sospheric westward jet, and the weaker winter flow is the remnant of the stratospheric-mesospheric eastward jet. The meridional flows are beautifully consistent between the two solstices, with the flow from the summer to the winter hemi-sphere (as expected) in each case. The longitudinal variabil-ities are consistent with expectations, with the summer flows showing little structure, and the winter flows showing struc-ture consistent with standing waves (wave numbers one and two (CIRA-1986)).
Finally, the equinoctial winds of Fig. 13 show symmet-rical and eastward winds at middle latitudes, since in the Northern Hemisphere we are in the early stages of winter-like flow and in the Southern Hemisphere we are in the conclu-sion of winter and the beginnings of the spring-summer flow. Note that the winter/summer-like flows last approximately 5– 7 months (Manson et al., 1991), so the hemispheric flows are not in anti-phases for each month of those seasons. The
two-month flow pattern obscures this little-appreciated fact, and this means that the individual months would differ from the September–October mean. The meridional flow might be ex-pected, over the two months, to have close to zero values and so illustrates the transition between the two poleward flows (Figs. 11, 12). This in fact is very clear from Fig. 13.
6 Conclusion
There has been significant discussion throughout the paper, so that this will be relatively brief. The HRDI 96 km tidal wind-oscillations are beautifully revealed in longitudinal-latitudinal contours when harmonic analysis is applied to two-month sequences for each of the 10◦ and 4◦ areas of sampled global-space. The 24-h tide for 3 seasons is gen-erally the largest near 20–30◦and is very similar in latitudi-nal structure and amplitude to the GSWM 2000 and to MLT radar data at 90–95 km. The phases are well revealed, the rotation sense appropriate, and phase differences approach quadrature for zonal and meridional winds. There is strong
-50 -40 -30 -20 -10 0 15 30 45 60 75 Amplitude (m/s)
HRDI mean wind, zonal, 96km, Jun-Jul/93
-180 -150 -120 -90 -60 -30 0 30 60 90 120 150 180 Longitude -70 -60 -50 -40 -30 -20 -10 0 10 20 30 40 50 60 70 Latitude Ave./GSWM -20 0 20 40 60 Amplitude (m/s) -70 -60 -50 -40 -30 -20 -10 0 10 20 30 40 50 60 70 -50 -40 -30 -20 -10 0 15 30 45 60 75 Amplitude (m/s)
HRDI mean wind, meridional, 96km, Jun-Jul/93
-180 -150 -120 -90 -60 -30 0 30 60 90 120 150 180 Longitude -70 -60 -50 -40 -30 -20 -10 0 10 20 30 40 50 60 70 Latitude Ave./GSWM -20 0 20 40 60 Amplitude (m/s) -70 -60 -50 -40 -30 -20 -10 0 10 20 30 40 50 60 70
Fig. 11. Mean winds at 96 km for June– July 1993. -50 -40 -30 -20 -10 0 15 30 45 60 75 Amplitude (m/s)
HRDI mean wind, zonal, 96km, Dec/93-Jan/94
-180 -150 -120 -90 -60 -30 0 30 60 90 120 150 180 Longitude -70 -60 -50 -40 -30 -20 -10 0 10 20 30 40 50 60 70 Latitude Ave./GSWM -20 0 20 40 60 Amplitude (m/s) -70 -60 -50 -40 -30 -20 -10 0 10 20 30 40 50 60 70 -50 -40 -30 -20 -10 0 15 30 45 60 75 Amplitude (m/s)
HRDI mean wind, meridional, 96km, Dec/93-Jan/94
-180 -150 -120 -90 -60 -30 0 30 60 90 120 150 180 Longitude -70 -60 -50 -40 -30 -20 -10 0 10 20 30 40 50 60 70 Latitude Ave./GSWM -20 0 20 40 60 Amplitude (m/s) -70 -60 -50 -40 -30 -20 -10 0 10 20 30 40 50 60 70
Fig. 12. Mean winds at 96 km for
-50 -40 -30 -20 -10 0 10 20 30 40 50 Amplitude (m/s)
HRDI mean wind, zonal, 96km, Sep-Oct/94
-180 -150 -120 -90 -60 -30 0 30 60 90 120 150 180 Longitude -70 -60 -50 -40 -30 -20 -10 0 10 20 30 40 50 60 70 Latitude Ave./GSWM -30 -10 10 30 Amplitude (m/s) -70 -60 -50 -40 -30 -20 -10 0 10 20 30 40 50 60 70 -50 -40 -30 -20 -10 0 10 20 30 40 50 Amplitude (m/s)
HRDI mean wind, meridional, 96km, Sep-Oct/94
-180 -150 -120 -90 -60 -30 0 30 60 90 120 150 180 Longitude -70 -60 -50 -40 -30 -20 -10 0 10 20 30 40 50 60 70 Latitude Ave./GSWM -30 -10 10 30 Amplitude (m/s) -70 -60 -50 -40 -30 -20 -10 0 10 20 30 40 50 60 70
Fig. 13. Mean winds at 96 km for
September–October 1994.
longitudinal variability, especially of amplitude, with a pref-erence for larger tides over the oceans.
The 12-h tides for two seasons shows the largest ampli-tudes at 40–55◦, and in the winter hemispheres: phases are well behaved and in component-quadrature, and the longi-tudinal variabilities are relatively smaller. The HRDI am-plitudes, like the MLT radar values, are often greater than GSWM 2000 in the summer hemispheres.
The mean winds are well behaved with stronger eastward flows in the summer hemispheres, and clear meridional flows toward the winter-poles.
These new HRDI results have enormous potential for fur-ther and deeper analysis. There are several years of data available for interannual variability studies. Availability of longitudinal variabilities, now possible because mode-fitting was not used, has revealed unique structures that can be compared with expected sources of non solar-migrating tidal modes. We encourage others to join in further HRDI analy-sis.
Acknowledgements. We note the support of the University of
Saskatchewan through the Institute of Space and Atmospheric Stud-ies, and also the Canadian granting agency, NSERC.
Topical Editor D. Murtagh thanks D. Pancheva and C. Fesen for their help in evaluating this paper.
References
Beagley, S.R., deGrandpre, J., Koshyk, J. M., McFarlane, N. A., and Shepherd, T. G.: Radiative dynamical climatology of the first
generation Canadian middle atmosphere model, Atmosphere-Ocean, 293–331, 1997.
Burrage, M. D., Skinner, W. R., Gell, D. A., Hays, P. B., Mar-shall, A. R., Ortland, D. A., Manson, A. H., Franke, S. J., Fritts, D. C., Hoffman, P., McLandress, C., Nicijewski, R., Schmidlin, F. J., Shepherd, G. G., Singer, W., Tsuda, T., and Vincent, R. A.: Validation of mesosphere and lower thermosphere winds from the high-resolution Doppler imager on UARS, J. Geophys. Res., 101, 10 365–10 392, 1996.
Forbes, J. M., Hagan, M. E., Zhang, X., and Hamilton, K.: Upper-atmosphere tidal oscillations due to latent heat release in the tropical troposphere, Ann. Geophysicae (Atmospheres, Hydro-spheres and Space Sciences), 15, 9, 1165, 1997.
Hagan, M. E., Chang, J. L., and Avery, S. K.: GSWM estimates of non-migrating tidal effects, J. Geophys. Res., 102, 16 439– 16 452, 1997a.
Hagan, M. E., McLandress, C., and Forbes, J. M.: Diurnal tidal vari-ability in the upper mesosphere and lower thermosphere, Annales Geophysicae (Atmospheres, Hydrospheres and Space Sciences), 15, 9, 1176, 1997b.
Hagan, M. E., Burrage, M. D., Forbes, J. M., Hackney, J., Randel, W. J., and Zhang, X.: GSWM-98: Results for migrating solar tides, J. Geophys. Res., 104, A4 6813, 1999.
Hagan, M. E., Roble, R. G., and Hackney, J.: Migrating thermo-spheric tides, J.Geophys. Res., 106, 12739–12752, 2001. Jacobi, Ch., Portnyagin, Y. I., Solovjova, T. V., Hoffman, P., Singer,
W., Fahrutdinova, A. N., Ishmuratov, R. A., Beard, A. G., Mitchell, N. J., Muller, H. G., Schminder, R., Kurschner, D., Manson, A. H., and Meek, C. E.: Climatology of the semidiurnal
tide at 52–56◦N from ground-based radar wind measurements 1985–1995, J. Atmos. Solar-Terr. Phys., 61, 975–991, 1999. Khattatov, B. V., Geller, M. A., Yudin, V. A., Hays, P. B.,
Skin-ner, W. R., Burrage, M. D., Franke, S. J., Fritts, D. C., Isler, J. R., Manson, A. H., Meek, C. E., Singer, W., Hoffman, P., and Vincent, R. A.: Dynamics of the mesosphere and lower thermo-sphere as seen by MF radars and by HRDI UARS, J. Geophys. Res., 101, 10 333–10 404, 1996.
Manson, A. H., Meek, C. E., Fleming, E., Chandra, S., Vin-cent, R. A., Phillips, A., Avery, S. K., Fraser, G. J., Smith, M. J., Fellous, J. L., and Massebeuf, M.: Comparisons between Satellite-derived Gradient Winds and Radar-derived Winds from the CIRA-86, J. Atmos. Sciences, 48, 3, 1991.
Manson, A. H., Meek, C. E., Hagan, M., Hall, C., Hocking, W., MacDougall, J., Franke, S., Riggin, D., Fritts, D., Vincent, R., and Burrage, M.: Seasonal variations of the semi-diurnal and diurnal tides in the MLT: multi-year MF radar observations from
2 to 70◦N, and the GSWM tidal model, J. Atmos. Solar-Terr.
Phys., 61, 809–828, 1999.
Manson, A. H., Meek, C. E., Hagan, M., Koshyk, J., Franke, S., Fritts, D., Hall, C., Hocking, W., Igarashi, K., MacDougall, J., Riggin, D., Vincent, R.: Seasonal Variations of the Semi-Diurnal and Diurnal Tides in the MLT: Multi-Year MF Radar
Obser-vations from 2-70◦N, Modelled Tides (GSWM, CMAM), Ann.
Geophysicae, in press, 2002a.
Manson, A. H., Meek, C. E., Koshyk, J., Franke, S., Fritts, D., Rig-gin, D., Hall, C., Hocking, W., MacDougall, J., Igarashi, K., and Vincent, B.: Gravity Wave Activity and Dynamical effects in the Middle Atmosphere (60–90km): Observations from an MF/MLT Radar Network, and results from the Canadian Middle Atmo-sphere Model (CMAM), J. Atmos. Solar-Terr. Phys., 64, 65–90, 2002b.
McLandress, C., Shepherd, G. G., and Solheim, B. H.: Satellite ob-servations of thermospheric tides: results from the Wind Imag-ing Interferometer on UARS, J. Geophys. Res., 101, 4093–4114, 1996.
Pancheva, D. N. et al.: Global scale tidal structure in the meso-sphere and lower thermomeso-sphere during the PSMOS campaign of June–August 1999 and comparisons with the Global Scale Wave Model, J. Atmos. Solar-Terr. Phys. (in press), 2002.
Rees, D., Barnett, J. J., and Labitzke, K.: COSPAR International Reference Atmosphere: 1986 Part II: Middle Atmosphere Mod-els, Advances in Space Research, 10, 12, 1990.
Yudin, V. A., Khattatov, B. V., Geller, M. A., Ortland, D. A., McLandress, C., and Shepherd, G. G., Thermal tides and studies to tune the mechanistic tidal model using UARS observations, Ann. Geophysicae (Atmospheres Hydrospheres and Space Sci-ences), 15, 9, 1205, 1997.