HAL Id: hal-01342466
https://hal-brgm.archives-ouvertes.fr/hal-01342466
Submitted on 6 Jul 2016
HAL is a multi-disciplinary open access
archive for the deposit and dissemination of
sci-entific research documents, whether they are
pub-lished or not. The documents may come from
teaching and research institutions in France or
abroad, or from public or private research centers.
L’archive ouverte pluridisciplinaire HAL, est
destinée au dépôt et à la diffusion de documents
scientifiques de niveau recherche, publiés ou non,
émanant des établissements d’enseignement et de
recherche français ou étrangers, des laboratoires
publics ou privés.
Environmental forensics in groundwater coupling passive
sampling and high resolution mass spectrometry for
screening
Coralie Soulier, Charlotte Coureau, Anne Togola
To cite this version:
Coralie Soulier, Charlotte Coureau, Anne Togola. Environmental forensics in groundwater coupling
passive sampling and high resolution mass spectrometry for screening. Science of the Total
Environ-ment, Elsevier, 2016, 563-564, �10.1016/j.scitotenv.2016.01.056�. �hal-01342466�
Environmental forensics in groundwater
1coupling passive sampling and high resolution
2mass spectrometry for screening
3Coralie Soulier, Charlotte Coureau and Anne Togola 4
BRGM Laboratory Division, 3 avenue C. Guillemin, 45100 Orléans, FRANCE 5
6
E-mail contact: [email protected] 7
Abstract
8
One of the difficulties encountered when monitoring groundwater quality is low and fluctuating 9
concentration levels and complex mixtures of micropollutants, including emerging substances or 10
transformation products. Combining passive sampling techniques with analysis by high resolution mass 11
spectrometry (HRMS) should improve environmental metrology. Passive samplers accumulate compounds 12
during exposure, which improves the detection of organic compounds and integrates pollution fluctuations. 13
The Polar Organic Chemical Integrative Sampler (POCIS) were used in this study to sequester polar to semi-14
polar compounds. The methodology described here improves our knowledge of environmental pollution by 15
highlighting and identifying pertinent compounds to be monitored in groundwater. 16
The advantage of combining these two approaches is demonstrated on two different sites impacted by 17
agricultural and/or urban pollution sources where groundwater was sampled for several months. Grab and 18
passive sampling were done and analyzed by liquid chromatography coupled to a hybrid quadrupole time-19
of-flight mass spectrometer (LC-QTOF). Various data processing approaches were used (target, suspect and 20
non-target screening). Target screening was based on research from compounds listed in a homemade 21
database and suspect screening used a database compiled using literature data. The non-target screening was 22
done using statistical tools such as principal components analysis (PCA) with direct connections between 23
original chromatograms and ion intensity. Trend plots were used to highlight relevant compounds for their 24
identification. 25
The advantage of using POCIS to improve screening of polar organic compounds was demonstrated. 26
Compounds undetected in water samples were detected with these tools. The subsequent data processing 27
identified sentinel molecules, molecular clusters as compounds never revealed in these sampling sites, and 28
molecular fingerprints. Samples were compared and multidimensional visualization of chemical patterns 29
such as molecular fingerprints and recurrent or specific markers of each site were given. 30
Keywords: target screening, suspect screening, non-target screening, High Resolution Mass Spectrometry, 1 POCIS, Time-of-Flight 2
1 Introduction
3Many micropollutants in the aquatic environment come from human and animal sources such as wastewater 4
treatment plants, septic tanks, landfills, sewers, livestock and agricultural activities, etc. (Focazio et al., 5
2008; Mueller et al., 2011). More than 10,000 chemicals are registered under the European Union's REACH 6
(Registration, Evaluation, Authorisation and Restriction of Chemicals) regulation (Directive REACH 7
2006/1907, 2006REACH 1907) and these can reach aquatic systems. These chemicals represent a wide 8
range of physico-chemical properties and have different impacts in term of toxicity and potential harm. Only 9
some of them are regulated in Europe for water pollution assessments by the Water Framework Directive 10
(Directive 2000/60/EC, Directive 2000/60/EC, 2000). A text dealing specifically with groundwater 11
protection from pollution and deterioration was written in 2006 (Directive 2006/118/EC, 2006Directive 12
2006/118/EC of the European Parliament and of the Council on the protection of groundwater against 13
pollution and deterioration.) and revised in 2014 (Directive 2014/80/EU, Directive 2014/80/EU, 2014). In 14
addition to these regulated compounds, others such as pharmaceutical compounds (PhACs), pesticides, 15
personal care products (PCPs), endocrine disrupting compounds, surfactants, perfluorinated compounds, and 16
industrial agents, which are known as emerging contaminants, are also detected in environmental samples 17
(Bletsou et al., 2015; Lopez et al., 2015). Furthermore, regulated and non-regulated compounds can be 18
degraded by various biotic and abiotic processes to form transformation products (TPs) that might be more 19
persistent and toxic than their parent compounds and should be taken into consideration in environmental 20
risk assessments (Escher and Fenner, 2011). 21
One challenge facing the scientific community is how to improve environmental monitoring. Whereas triple 22
quadrupole analyzers currently enable us to seek only a pre-defined list of compounds in samples, new 23
methodologies such as high resolution mass spectrometry (HRMS) enable comprehensive screening. 24
Coupled with high pressure liquid chromatography (HPLC), HRMS makes it possible to detect, in one 25
injection of a sample, several thousand compounds without pre-selection. Nevertheless, the physico-26
chemical properties range of organic compounds detected or identified with this technique is limited by 27
sample pretreatment, chromatographic or ionization conditions. All of the detectable information is recorded 28
and enables an a posteriori data search. HRMS is an analytical technique which allows identifying 29
compounds and provides a level of confidence on target and non-target screening based on mass accuracy 30
(Hug et al., 2014; Martinez Bueno et al., 2012). The quadrupole time-of-flight (QTOF) analyzer can be used 31
in environmental analysis both for identifying TPs (Boix et al., 2014; Durand et al., 2006; Ibanez et al., 32
2006; Jelic et al., 2013) and for screening (Ferrer and Thurman, 2012; Guibal et al., 2015; Hernandez et al., 33
2015; Ibanez et al., 2005; Leendert et al., 2015). 34
The second constraint with regard to micropollutants is that they are present in the environment in mixtures 1
at sub-ppb concentrations and at variable times and locations. Water samples are usually collected by spot 2
sampling, which provides merely a snapshot of contamination at a given time and place. Better knowledge 3
of these variables or of episodic pollution requires a multiplication of sample collection in time and space. 4
To overcome these limitations passive sampling devices are able to provide time weighted average (TWA) 5
concentrations, which are averaged concentrations over the exposure time of this type of tool (Vrana et al., 6
2005). They simplify sampling and decrease the conventional limit of detection (LOD) of the sampled 7
compound. Polar Organic Chemical Integrative Samplers (POCIS) can be used for polar compounds such as 8
pesticides, PhACs and steroids. These integrative passive samplers can remain in the aqueous medium for 9
over two months (Vrana et al., 2005). Numerous compounds such as Polycyclic Aromatic Hydrocarbons 10
(Tapie et al., 2011), pesticides (Alvarez et al., 2004; Berho et al., 2013; Guibal et al., 2015; Ibrahim et al., 11
2013a; Mazzella et al., 2007), alkylphenols (Arditsoglou and Voutsa, 2008; Harman et al., 2009; Li et al., 12
2010), PhACs (Bartelt-Hunt et al., 2009; Martínez Bueno et al., 2009; Metcalfe et al., 2011; Togola and 13
Budzinski, 2007), and perfluorinated compounds (Kovarova et al., 2012) have been detected with POCIS in 14
various aquatic systems. 15
Using POCIS to improve conventional LOD coupled with LC-HRMS should improve the screening of 16
micropollutants in aquatic samples. To our knowledge, only the published work of Guibal and co-workers 17
deals with the combination of passive sampler and LC-HRMS (Guibal et al., 2015). Our study used POCIS 18
to screen polar organic compounds in environmental samples, implemented a workflow for HRMS data 19
processing, and applied it to two groundwater sites. 20
2 Materials and methods
21
2.1 Chemicals and reagents
22
Analytical standards (purity >98%) were purchased from Cluzeau Info Labo (CIL, Sainte-Foy-La Grande, 23
France), TechLab (Metz, France), Sigma-Aldrich (Saint-Quentin Fallavier, France), and LGC standard 24
(Molsheim, France). 25
The acetonitrile and methanol (HPLC grade) used for extraction were purchased from Fisher Chemical 26
(Ilkirch, France). Ultrapure water was produced using a Millipore Direct-Ultrapure Water System. Oasis® 27
HLB (divinylbenzene/N-vinylpyrrolidone copolymer) extraction cartridges (500 mg, 6cc, 60 µm) were 28
purchased from Waters Corporation (Guyancourt, France). Empty polypropylene SPE tubes with 29
polyethylene frits were supplied by Supelco (Saint-Quentin Fallavier, France). The POCIS were purchased 30
from Exposmeter SA (Tavelsjö, Sweden). Their pharmaceutical configuration consists of two 0.1-µm 31
PolyEther Sulfone (PES) membranes containing OASIS® HLB sorbent. 32
The solvents used for the HPLC-HRMS analysis included acetonitrile and water (UPLC/MS grade) 1
purchased from Biosolve (Dieuze, France), and formic acid (99%, LC/MS grade) purchased from Avantor 2
(Deventer, the Netherlands). The lock mass used as an internal reference in the mass spectrometer's 3
ionization source, Leucine Enkephalin (LeuEnk), was purchased from Waters Corporation and the calibrant 4
for the mass spectrometer, sodium formate, was prepared with sodium hydroxide, purchased from Sigma 5
Aldrich. 6
2.2 Sampling sites
7
Groundwater was sampled at two sites in France over a period of several months in 2014. Grab and passive 8
sampling were done at the same time. 9
Site 1 is an alluvial aquifer impacted by diffuse agricultural pollution and urban effluents. Six successive 10
one-month sampling campaigns were done from July to December 2014. A grab sample was collected at the 11
beginning and end of each POCIS sampling campaign (7 samples). The POCISs were done in triplicate (18 12
samples). 13
Site 2 is an alluvial aquifer impacted only by diffuse agricultural pollution. Groundwater was sampled every 14
15 days from January to December 2014. A grab sample was collected at the beginning and the end of each 15
15-day POCIS sampling campaign (24 samples). The POCISs were done in triplicate (72 samples). 16
In order to compare results from these two sites, we took into account the same number of samples (n=6 for 17
water samples and n=18 for POCIS). Both sites have comparable conditions concerning water velocity (both 18
in alluvial plain). Temperature and pH were stable during exposure: 13.4±2.3 °C and 7.2±0.2 in site 1 and 19 12.8±1.7°C and 7.0±0.2 in site 2. 20 2.3 Samples treatment 21 2.3.1 Water analyses 22
Water samples were extracted by solid-phase extraction (SPE) at neutral pH using the autotrace SPE 23
workstation (Caliper LifeSciences, Villepinte, France). The SPE procedure is described elsewhere (Berho et 24
al., 2013). SPE was done twice, once with methanol and once with acetonitrile elution, with Oasis® HLB 25
cartridges in order to increase the range of physico-chemical properties of sampled compounds and to 26
compare the results with those of passive sampling (POCIS). 27
One liter of sample was passed through the cartridge under vacuum at a flow rate of 20 mL/min. The 28
cartridges were then dried under vacuum for one hour before elution. The extracts obtained were evaporated 29
to 1 mL at a flow rate of 3 mL/min in a nitrogen stream and transferred into injection vials. 30
2.3.2 POCIS
1
POCIS extraction is described in detail elsewhere (Ibrahim et al., 2013b). After sorbent retrieval, elution was 2
done with 8 mL of acetonitrile and then 8 mL of methanol. The eluate was reduced to 500 µL in a gentle 3
stream of nitrogen and transferred to an injection vial for analysis. Field blanks were treated in the same 4
manner as the exposed POCIS. 5
2.4 HPLC-HRMS analysis
6
Chromatographic separation was done with a Waters Acquity UPLC I-Class system (Waters, Guyancourt, 7
France) using a 150 mm×2.1 mm ACQUITY BEH C18 1.7 µm column (Waters). A sample volume of 2 µL 8
was injected with an Acquity UPLC fixed loop autosampler. For positive ionization, the mobile phase was 9
composed of solvent A (0.05 % formic acid in water) and solvent B (0.05 % formic acid in acetonitrile) at a 10
constant flow of 0.5 mL/min. The initial amount of B was 2 % for 0.5 min and this increased linearly to 99 11
% in 18 min, followed by a 4 min isocratic mode and a rapid return to the initial conditions. These 12
conditions were maintained until 2.5 min. The total run time was 25 min. Column and autosampler 13
temperatures were maintained at 35 °C and 10 °C, respectively. 14
Mass spectrometry was done on a hybrid quadrupole time-of-flight mass spectrometer (XEVO G2S QTOF, 15
Waters, Manchester, United Kingdom) using an electrospray ionization interface (ESI) operating in the 16
positive ionization mode. MS data were acquired in centroid, resolution and MSE modes over a m/z range of 17
50-1,200. Typical interface conditions were optimized for maximum intensity of the mixture of target 18
compounds as follows: nebulizer and desolvatation (drying gas) N2 (from a nitrogen generator) flows were
19
set at 900 and 50 L/h, respectively, and source block and desolvatation temperatures were 120 and 600 °C, 20
respectively. A cone voltage of 30 V and a capillary voltage of 0.5 kV were used. The collision gas was 21
Argon (purity 99.9999 %) at a pressure of 1.3×10⁻⁴ mBar. The resolution of QTOF-MS was between 24,000 22
and 29,000 in resolution mode at m/z 556.2771 (positive ionization). 23
The MSE mode creates two parallel alternating scan functions with different collision energies. Function 1 24
operates at a low collision energy (LE) of 6 eV, whereas Function 2 operates at a high collision energy (HE) 25
with a ramp ranging from 6 to 45 eV. All mass spectra acquired at each collision energy from 6 to 45 eV 26
overlap. All of the information concerning precursor and fragment ions was present on the high energy mass 27
spectra. Functions 1 and 2 have scan time values and an inter-scan delay of 0.25 s and 0.015 s, respectively. 28
This acquisition mode enables us to obtain precursor and fragment ions in one injection with no need to 29
select the precursor ion as required in MS/MS experiments. 30
Sodium formate (0.5 mM), a 1/300 mixture of formic acid at 10 % with 0.5 mM sodium hydroxide in 90/10 31
2-propanol/water, enabled calibration from m/z 50-1,200. Mass calibration was done weekly using a 32
reference pump connected directly to the interface at a flow rate of 20 µL/min. 33
A lock mass, Leucine Enkephalin (LeuEnk, 1 ng/µL), was introduced into the interface through the lock 1
spray needle at a flow rate of 10 µL/min every 15 seconds during the injection. The lock spray capillary 2
voltage was 3 kV. The protonated form of LeuEnk (m/z 556.2771) was used to refocus the mass axis and 3
ensure a robust accurate mass measurement throughout the procedure (Hernandez et al., 2011). The potential 4
mass deviation was corrected automatically during the injection. 5
The data station was controlled by MassLynx software (v 4.1). 6
2.5 Databases
7
Information from chromatographs (retention time) and mass spectra (accurate mass, adducts, fragment ions) 8
enabled us to identify compounds. In order to facilitate and improve the reliability of the identification 9
process, two databases were used: a homemade database that we developed with an injected reference 10
standard and a database from the literature. 11
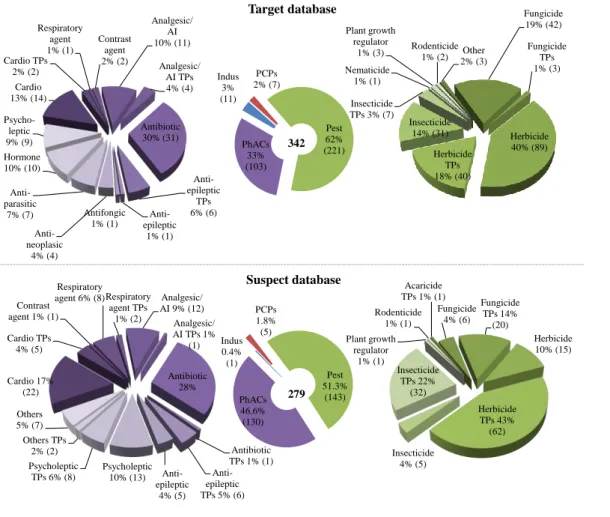
The first database, called the "target" database, contains more than 340 compounds analyzed in positive 12
ionization. The compounds were divided into four groups, each group containing several classes of 13
compounds. Pesticides and their TPs represent 62 % of the target compounds and include herbicides, 14
insecticides, fungicides, etc. PhACs and their TPs represent 33 % of these compounds and include 15
antibiotics, antiepileptics, analgesics/anti-inflammatories, cardiovascular agents, psycholeptics, etc. Three 16
percent of the target compounds are industrial compounds, while PCPs and their TPs represent 2 % (Figure
17
1Figure 1). The reference standards for all of these were injected and their retention times, adducts, accurate 18
masses and fragment ions were available. 19
The second database, which we call the "suspect" database, contains data from the literature for about 350 20
compounds analyzed with positive ionization. We focused, in our study, on the 280 for which fragment 21
information is available. Once again, we divided the compounds into four groups, each group containing 22
several classes of compounds. Pesticides and their TPs represent 61.3 % of the suspect compounds and 23
include herbicides, insecticides, fungicides, pesticides, etc. PhACs and their TPs represent 46.6 % of these 24
compounds and include antibiotics, antiepileptics, analgesics/ anti-inflammatories, cardiovascular agents, 25
psycholeptics, etc. Industrial compounds represent 0.4 % and PCPs and their TPs 1.8 % (Figure 1Figure 1). 26
Only the retention times are not available for the suspect database because there has been no injection of 27
reference standards with the analytical methodology used in this study. Target and suspect lists are similar 28
and around 60 compounds are found in both and therefore validate the data processing. 29
1
Figure 1: Details of organic compounds detected in positive ionization, in target and suspect databases. The compounds were divided 2
into four groups, each group contained different classes of compounds where Pest is pesticides, Indus is industrial, PhACs is 3
Pharmaceuticals compounds, PCPs is Personal Care Products, Cardio is cardiovascular agents, TPs is transformation products, and AI 4
is anti-inflammatory. Numbers in brackets refer to the number of compounds in each group or class. 5
2.6 Data processing
6
Data were processed using the ChromaLynx XS Application Manager together with 2 homemade databases 7
and MarkerLynx XS for non-target screening. 8
Identifying all of the organic compounds present in a sample is a laborious, difficult, and time consuming 9
task especially when compounds are present at trace levels (Hernandez et al., 2012). As a result of the 10
increased interest in suspect and non-target analysis, Schymanski and co-workers (Schymanski et al., 2014) 11
have proposed a system of 5 identification confidence levels. Based on this system, we used three 12
approaches or levels in this study ( 13
Figure 2Figure 2Figure 2) in the ascending order of confidence: target, suspect and non-target. 14 Indus 3% (11) PCPs 2% (7) Pest 62% (221) PhACs 33% (103) Other 2% (3) Fungicide 19% (42) Fungicide TPs 1% (3) Herbicide 40% (89) Herbicide TPs 18% (40) Insecticide 14% (31) Insecticide TPs 3% (7) Nematicide 1% (1) Plant growth regulator 1% (3) Rodenticide 1% (2) Cardio 13% (14) Cardio TPs 2% (2) Respiratory agent 1% (1) Contrast agent 2% (2) Analgesic/ AI 10% (11) Analgesic/ AI TPs 4% (4) Antibiotic 30% (31) Anti-epileptic TPs 6% (6) Anti-epileptic 1% (1) Antifongic 1% (1) Anti-neoplasic 4% (4) Anti-parasitic 7% (7) Hormone 10% (10) Psycho-leptic 9% (9) Target database 342 Indus 0.4% (1) PCPs 1.8% (5) Pest 51.3% (143) PhACs 46.6% (130) 279 Cardio 17% (22) Cardio TPs 4% (5) Contrast agent 1% (1) Respiratory agent 6% (8)Respiratory agent TPs 1% (2) Analgesic/ AI 9% (12) Analgesic/ AI TPs 1% (1) Antibiotic 28% Antibiotic TPs 1% (1) Anti-epileptic TPs 5% (6) Anti-epileptic 4% (5) Psycholeptic 10% (13) Psycholeptic TPs 6% (8) Others TPs 2% (2) Others 5% (7) Acaricide TPs 1% (1) Fungicide 4% (6) Fungicide TPs 14% (20) Herbicide 10% (15) Herbicide TPs 43% (62) Insecticide 4% (5) Insecticide TPs 22% (32) Plant growth regulator 1% (1) Rodenticide 1% (1) Suspect database
Mis en forme : Non souligné, Français
1
Figure 2: Data processing of environmental samples 2
2.6.1 Target and suspect screening
3
For both the target and suspect approaches, the ChromaLynx XS application was used in the target mode 4
(targeted analysis with fragment ion confirmation) to extract exact mass chromatograms of compounds and 5
fragments specified in the target database using narrow-window extracted ion chromatograms (nw-XICs) of 6
approximately 10 mDa. To validate the identification, the target retention time tolerance was set at 0.2 min, 7
and the mass accuracy at 3 mDa. The target and suspect approaches differ only in the databases used – the 8
homemade target database and the literature-derived suspect database, respectively. Results from POCIS 9
blanks were considered by comparison in terms of peaks intensity with samples. No identified compounds in 10
samples were significantly present in blanks. 11
2.6.2 Non-target screening
12
To save time and minimize the difficulties involved when attempting to identify all non-attributed signals 13
and to select relevant compounds, the MarkerLynx XS application was used for non-target screening. 14
Results from POCIS blanks were not considered in this approach. This application manager uses statistics to 15
preselect relevant compounds depending on the aim of a study. Samples must be injected in replicate, after 16
which MarkerLynx XS compares them to others and identifies markers from large sample sets. Each marker 17
is characterized by a retention time, an exact mass and an intensity. The application first detects 18
chromatographic peaks using nw-XICs of 50 mDa and outputs a results matrix of exact mass, retention time 19
and intensity pairs (under the name of markers). It then presents the results in tabular form and, finally, it 20
conducts principal component analysis (PCA) on the data. The three main detection method parameters are 21
peak width at 5 % height and peak to peak baseline noise, both of which were automatically determined, and 22
the marker intensity threshold, which was set at 20,000 counts. The results appear as a list of markers found 23
F
irst
ap
p
ro
ac
h
:
T
ar
g
et
•List of target compounds (accurate mass, retention time and fragmentation data) •ChromaLynx XS •nw-XICs for each compounds (10 mDa) •Exact mass filtering (3 mDa)•Retention time filtrering (±0.2 min) •Fragment ions filtrering (HE)
S
ec
o
n
d
a
p
p
ro
ac
h
:
S
u
sp
ec
t
•List of suspect compounds (accurate mass and fragmentation data)•ChromaLynx XS •nw-XICs for each compounds (10 mDa) •Exact mass filtering (3m Da)
•Fragment ions filtrering
(HE)
Th
ird
a
p
p
ro
ac
h
:
No
n
-tar
g
et
•Injection in replicate •MarkerLynx XS •nw-XICs for each compounds (50 mDa) •Identify peaks and build a results matrix of exact mass, retention time and intensity pairs •Data are statistically analyzed•Principal component analysis (PCA) of the data
in selected samples with accurate mass, retention time and intensity. After the aim of the study has been 1
identified, the data are analyzed by multivariate analysis and the results are presented in a report. 2
3 Results and discussion
3
3.1 Advantages of POCIS for screening
4
We used the same sorbent for both solid phase extraction (for water samples) and POCIS and the elution 5
conditions were very similar. This suggests that there should be little difference in the compounds 6
determined by the two methods. The sampling step is different – water samples were collected by grab 7
sampling (1 liter), which provides only a snapshot of contamination, whereas with POCIS, the sorbent might 8
be directly exposed for several days, weeks or months to the medium (Vrana et al., 2005), which 9
corresponds to several liters of extracted water. 10
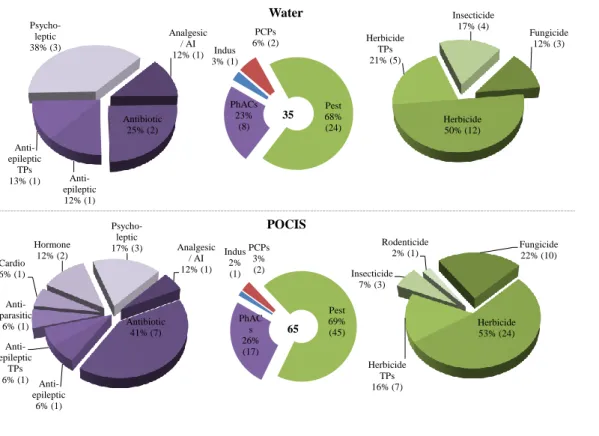
Figure 3 presents the results of target compounds identified from POCIS (triplicate for the six sampling 11
periods, n=18) and water samples (for each sampling period, n=6) in site 1. 12
The proportion of the four classes of compounds is approximatively the same in the target database and 13
samples (water and POCIS) (Figure 3Figure 3). However, 65 compounds were identified in POCIS and only 14
35 in water samples. More pesticides and PhACs were identified in POCIS (e.g. herbicides (24 rather than 15
12) and their TPs (7 rather than 5), fungicides (10 rather than 3), and antibiotics (7 rather than 2). Some 16
compounds were only detected in POCIS (1 rodenticide, 2 hormones, 1 antiparasitic and 1 cardiovascular 17
agent) (Figure 3Figure 3). 18
Some compounds detected in water samples are not in POCIS. Beflubutamid, a hydrophobic herbicide (log 19
KOW: 4.28), for example, was detected in all of the water samples (n=6) but never in POCIS (n=18), possibly
20
due to the presence of a PES membrane in POCIS, which is used to separate the sorbent from the sampled 21
medium and to control the mass transfer of analyte to the sorbent (Vrana et al., 2005). The diffusion 22
coefficient of hydrophobic compounds through the PES membrane is low (Harman et al., 2008; Vermeirssen 23
et al., 2012). They have a biphasic absorption in the PES membrane, pass through the water-filled pores of 24
the membrane and then through the polymer (Alvarez et al., 2007). In some cases, hydrophobic compounds 25
are present in the PES membrane and do not pass into the sorbent, which would explain why there is no 26
detection in POCIS extracts. 27
1
Figure 3: Percentage of detection of target compounds in site 1 for different groups and classes of organic pollutants from the 2
homemade target database in POCIS and water samples in positive ionization, where Pest are pesticides, Indus is industrial, PhACs are 3
Pharmaceuticals compounds, PCPs are Personal Care Products, Cardio are cardiovascular agents, TPs are transformation products, 4
and AI is anti-inflammatory. Numbers in brackets refer to the number of compounds in each group or class. 5
One advantage of POCIS is that it is highly sensitive (Alvarez et al., 2005), which is clearly a benefit for 6
screening by increasing the compound concentration in the extract. More compounds were detected with this 7
tool (Figure 3Figure 3). This is a higher confidence identification level of compounds because the detection 8
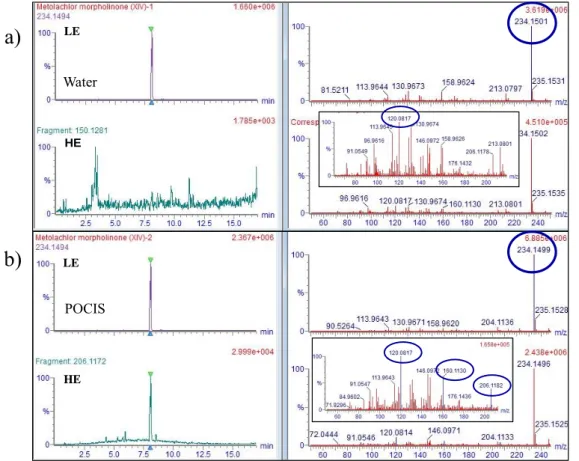
of fragments obtained in MSE acquisition mode was better (Figure 4Figure 4). In the case of metolachlor 9
morpholinone chromatographic signals were higher in POCIS sample than water. More fragments were 10
detected in POCIS extract than water and the intensity of ions (monoisotopic and fragments) were higher 11 (Figure 4Figure 4). 12 Indus 3% (1) PCPs 6% (2) Pest 68% (24) PhACs 23% (8) Indus 2% (1) PCPs 3% (2) Pest 69% (45) PhAC s 26% (17) Fungicide 12% (3) Herbicide 50% (12) Herbicide TPs 21% (5) Insecticide 17% (4) Analgesic / AI 12% (1) Antibiotic 25% (2) Anti-epileptic 12% (1) Anti-epileptic TPs 13% (1) Psycho-leptic 38% (3) Analgesic / AI 12% (1) Antibiotic 41% (7) Anti-epileptic 6% (1) Anti-epileptic TPs 6% (1) Anti-parasitic 6% (1) Cardio 6% (1) Hormone 12% (2) Psycho-leptic 17% (3) Fungicide 22% (10) Herbicide 53% (24) Herbicide TPs 16% (7) Insecticide 7% (3) Rodenticide 2% (1) Water POCIS 35 65
1
Figure 4 : Comparison of chromatogram and mass spectrum of metolachlor morpholinone detected in water and POCIS samples. a) 2
chromatograms and spectrums of water sample, b) chromatograms and spectrums of POCIS sample. LE is Low Energy (Function 1) 3
and HE is High Energy (Function 2) in MSE acquisition mode. 4
3.2 Influence of source contamination on compound distribution
5
3.2.1 Target screening
6
To highlight compounds specific to each source of contamination, all target compounds identified in both 7
sites were compared with the target database. Both sites have agricultural sources of contamination whereas 8
only site 1 is impacted by urban effluents. Sixty-four compounds were identified as target compounds in site 9
1 and 72 in site 2, of which 38 are identified in both (Figure 5Figure 5). 10
Sixty-eight percent of the shared target compounds are pesticides (26 compounds), 42% being herbicides 11
and TPs with atrazine and its TPs (atrazine-desethyl and atrazine-desisopropyl), and terbumeton and its TP 12
(desethyl-terbumeton), and 21% being fungicides with carbendazim and cyproconazole. PhACs represent 24 13
% of the total, with 9 compounds including tramadol, which is an analgesic/anti-inflammatory drug and 14
oxazepam which is a psycholeptic drug. Six percent were PCPs and their TPs, which included caffeine and 15
1,7-dimethylxanthine. One industrial compound was detected, tolyltriazole (Figure 5Figure 5). 16 HE HE LE LE Water POCIS
a)
b)
The presence of pesticides and their TPs on both sites was expected and in agreement with an agricultural 1
source. Some of the detected pesticides are banned in France (i.e. atrazine, simazine and their TPs). 2
However, these compounds are detected most frequently (Lopez et al., 2015; Postigo and Barcelo, 2015; 3
Van Stempvoort et al., 2013). Caffeine and its TP (1,7-dimethylxanthine) were detected in almost all POCIS 4
samples (n=18) in both sites. They are generally considered to be tracers of anthropogenic activity (Lopez et 5
al., 2015). Tolyltriazole, a corrosion inhibitor for copper and its alloys, is frequently detected in groundwater 6
(Lopez et al., 2015; Postigo and Barcelo, 2015). The presence of PhACs in groundwater usually implies 7
wastewater input (Van Stempvoort et al., 2013). However, some analgesic/anti-inflammatory drugs and 8
antibiotics, such as tramadol, flumequine, oxazepam, and sulfamethoxazole, might also be used as veterinary 9
drugs in agriculture (Lopez et al., 2015). The occurrence of carbamazepine, an antiepileptic drug and 10
wastewater tracer, is unexplained in site 2. Nevertheless, the detection frequency of carbamazepine is clearly 11
different in the two sites (17 out of 18 samples in site 1 vs. 4 out of 18 in site 2), which reflects the 12
difference in urban pressure in the two sites. 13
Target compounds specific to each site are identified in Figure 5Figure 5. Twenty-six were identified only in 14
site 1 – 18 pesticides and their TPs (69 %) and 8 PhACs (31 %). Among the pesticides, 4 herbicides 15
(tebutam, benfluraline, sebuthylazine and terbuthylazine) and 1 insecticide (carbosulfan) were detected in 16
more than half of the 18 samples. Only two herbicide TPs were detected in fewer than three samples. 17
Concerning PhACs, marbofloxacin and norgestrel were detected in more than 9 samples. Carbamazepine-18
10,11-epoxide, an active carbamazepine TP, was identified in 16 samples. This compound might be present 19
in wastewater and sorbed on soil and its mobility is greater than that of its parent compound (Fenet et al., 20
2012). 21
Thirty-four target compounds were identified in site 2 (Figure 5Figure 5). These included 23 pesticides and 22
their TPs (67 %), 10 PhACs (30 %) and 1 PCP (3 %). Compared to what was found in site 1, more 23
pesticides and TPs were identified in more than half of the samples in site 2 – 3 fungicides (azoxystrobine, 24
difeconazole and metalaxyl), 2 herbicides (metsulfuron-methyl and chlorotoluron), 4 metolachlor TPs 25
(deschlorometolachlor, 2-hydroxymetolachlor, deschloroacetylmetolachlor and metolachlor morpholinone), 26
and 2 acetochlor or metolachlor TPs (2’-ethyl-6’methylacetanilide and 2-hydroxy-2’-ethyl-6’-27
methylacetanilide). These results agree with those of Amalric and co-workers (Amalric et al., 2013), even if 28
the use of POCIS makes it possible to identify more TPs. Some of these compounds could be used as tracers 29
of agricultural activities, especially in cropped areas. Other targeted compounds (PhACs) were identified 30
less frequently than pesticides and were detected in less than 3 samples. This might indicate a slighter 31
impact of wastewater in site 2. 32
1
Figure 5: Comparison of the percentage of detection of target compounds for different classes of organic pollutants in POCIS samples in 2
sites 1 and 2 in positive ionization where Indus is industrial, PCPs are Personal Care Products, Cardio are cardiovascular agents, TPs 3
are transformation products, and AI is anti-inflammatory. Numbers in brackets refer to the number of compounds in each class. 4
3.2.2 Suspect screening
5
Suspect compounds were identified using data in our suspect database. The level of identification 6
confidence of compounds identified as suspect is lower than that of target compounds because their presence 7
is not confirmed by the injection of a reference standard. Twenty-seven of the 280 compounds in the suspect 8
database were identified in site 1 and 32 were identified in site 2 (Table 1Table 1). Most of the compounds 9
identified as suspect are PhACs (more than 70 %). Eighteen suspect compounds were detected in both sites 10
and 11 of these in more than half of the 18 samples – 4 or 5-methyl-1H-benzotriazole being one of the 11
industrial compounds, atrazine, pirimicarb and 2-aminobenzimidazole (TP of carbendazim) three of the 12
pesticides, guaifenesin and desmethyl-dextrophan (TP of dextromethorphan) two of the respiratory agents, 13
tramadol and ketorolac two of the analgesic/anti-inflammatory agents, des-venlafaxine and didesmethyl-14
venlafaxine (TPs of venlafaxine) two of the psycholeptics, and primidone one of the antiepileptics. The 15
detection of pesticides was expected in these sites, as was that of 2-aminobenzimidazole, in agreement with 16
the presence of the target compound carbendazim. Methylbenzotriazole was detected in both site 1 (n=16) 17
and site 2 (n=6). This is in agreement with this type of contamination source. Concerning the PhACs, some 18 34 38 26 Site 1 Site 2 Indus 2% (1) PCPs 3% (1) PCPs TPs 3% (1) Fungicide 21% (8) Herbicide 29% (11) Herbicide TPs 13% (5) Insecticide 5% (2) Analgesic/ AI 3% (1) Antibiotic10% (4) Anti epileptic 3% (1) Psycho leptic 8% (3) Fungicide 7% (2) Herbicide 46% (12) Herbicide TPs 8% (2) Insecticide 4% (1) Rodenti cide 4% (1) Antibiotic 11% (3) Anti-e pileptic 4% (1) Anti parasitic 4% (1) Cardio 4% (1)Hormone8% (2 PCPs 3% (1) Fongicide 15% (5) Herbicide 20% (7) Herbicide TPs 26% (9) Insecticide 6% (2) Cardio 18% (6) Analgesic/ AI 3% (1) Psycho-leptic 9% (3)
compounds are also used in veterinary medicine in France. These include guaifenesin (equine), 1
dextromethorphan (canine), tramadol, ketorolac (equine) and primidone (feline and canine). However, their 2
veterinary use cannot alone explain their presence in site 2, which is contaminated only by agricultural 3
sources. This might suggest a slight input of wastewater, which is consistent with the conclusion on the 4
presence of carbamazepine in site 2. 5
Table 1: Positive identification of suspect compounds for various groups of organic pollutants in POCIS in sites 1 and 2 using suspect 6
database with number of compounds and proportion of each class, where TPs are transformation products 7
Groups of compounds
Number of POCIS Site 1 POCIS Site 2compounds Proportion (%) Number of compounds Proportion (%) Industrial compounds 1 4 1 3 Pesticides 3 11 6 19 Pharmaceuticals 21 78 23 72
Personal care products 2 7 2 6
Total 27 32 Details Pesticides Fungicides Precursor 1 17 TPs 1 33 1 17 Herbicides Precursor 1 33 1 17 TPs 2 33 Insecticides Precursor 1 33 1 17 Pharmaceuticals
Cardiovascular agents Precursor 2 10 2 9
TPs 1 5 2 9
Respiratory agents Precursor 2 10 2 9
TPs 1 5 1 4 Analgesic/Anti-inflammatory agents Precursor 2 10 3 13 Antibiotics Precursor 2 10 3 13 Antiepileptics Precursor 4 19 2 9 TPs 1 5 1 4 Psycholeptics Precursor 4 19 3 13 TPs 1 5 4 17 Other Precursor 1 5
Personal care products
Precursor 1 50 1 50
TPs 1 50 1 50
8
Nine suspect compounds were identified as specific to site 1, including four PhACs detected in more than 9
half of the samples – carbamazepine and lamotrigine (antiepileptics), irbesartan (cardiovascular agents) and 10
diazepam (psycholeptics). These compounds have been detected elsewhere in France in surface water 11
downstream from effluent discharge points (Ferrer and Thurman, 2012) and irbesartan has been detected in 12
groundwater in Switzerland (Huntscha et al., 2012). 13
Fourteen suspect compounds were specific to site 2, including two herbicides – simazine-2-hydroxy (a TP of 14
simazine) and terbuthylazine-desethyl-2-hydroxy (a TP of terbuthylazine), and one cardiovascular agent – 15
dehydrofedipine (a TP of nifedipine), which were detected in more than in 9 samples. Terbuthylazine-16
desethyl-2-hydroxy and simazine-2-hydroxy have the same exact mass which correspond to C7H13N5O.
1
Their differentiation has been possible because they have not the same fragments. Terbuthylazine-desethyl-2
2-hydroxy has two fragments: 128.0566 and 86.0348 (Huntscha et al., 2012). And simazine-2-hydroxy have 3
four fragments: 184.1207, 114.0659, 97.0389 and 69.0094 (Diaz et al., 2011). The presence of two herbicide 4
TPs confirms the principal agricultural source of contamination for site 2. Terbuthylazine-desethyl-2-5
hydroxy has been detected in groundwater elsewhere (Huntscha et al., 2012). Nifedipine is also used in 6
veterinary medicine (to decrease cholesterol accumulation). As stated above, this compound might come 7
from either wastewater or livestock. 8
Using the suspect database enabled us to increase the number of identified compounds by making use of 9
literature data and databases on line while limiting the cost of purchasing and analyzing reference standards. 10
However, retention times and complete mass spectra, needed to confirm the presence of a compound, are not 11
included in on-line databases and can be determined only by injecting standards into the same apparatus as 12
the samples. 13
3.2.3 Non-target screening
14
For the non-target analysis, MarkerLynx XS software filters the markers (characterized by retention time, 15
exact mass and intensity) that are identified in at least two samples of a sample set (containing 18 POCIS for 16
each site). In these 36 samples, about 12,000 markers were detected for the sample sets for both sites. Many 17
of these, such as natural or widespread compounds, are not discriminants. Among them are the compounds 18
identified with both of the approaches described above (target and suspect). 19
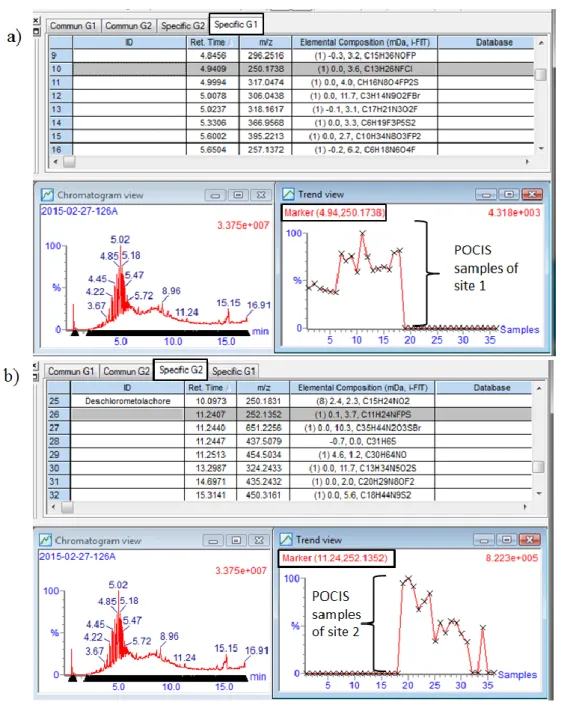
PCA enabled us to highlight specific markers for each site. 41 markers were specific to site 1 and 36 20
markers to site 2 after manually checking that each marker was detected in two samples in a triplicate. For 21
each marker, the retention time, accurate mass and the trend view were provided (Figure 6Figure 5). It is 22
also possible to access the elemental composition of each marker based on accurate mass (Figure 6Figure 5). 23
At most, twenty results of elemental compositions could be calculated, and these were ranked by mass error. 24
The best choices must be made as a function of mass error, isotopic pattern, fragment ions, analyst 25
knowledge and online database data. 26
The trend view is a plot of the relative normalized intensities of a selected marker throughout the triplicates 27
of POCIS, sampling period and sampled sites. The first 18 samples correspond to 18 samples from site 1 and 28
the others to samples from site 2. Markers specific to site 1 were present only in the first 18 samples as 29
shown in Figure 6Figure 6a for the marker detected at 4.94 min with m/z 250.1738, whereas markers 30
specific to site 2 were present only in the last 18 samples (Figure 6Figure 6b). This information might be 31
used later to identify relevant markers. 32
1
Figure 6: Results for non-target screening from MarkerLynx XS software. a) Example of results for a marker specific to site 1 with 2
trend view of marker at 4.94 min and with a m/z 250.1738. b) Example of results for a marker specific to site 2 with trend view of 3
marker at 11.24 min and with a m/z 252.1352. The trend view is a plot of the relative normalized intensities of the selected marker (y-4
axis) throughout samples (x-axis). 5
At present, each site can be characterized by the molecular fingerprints obtained here. Thereafter, it will be 6
possible to compare the molecular fingerprints of these sites whose sources of pollution are known and 7
enable us to clearly differentiate the two sites in order to improve the relevance of the pollution fingerprint. 8
This data processing could be used as a warning system in sensitive areas (water supply, aquaculture, etc.) 9
more appropriate than predefined monitoring approaches that require a prior knowledge of the contaminants 1
that must be monitored. 2
4 Conclusions
3
This study demonstrates the advantage of using POCIS for organic chemical screening. More organic 4
compounds were detected and identified with this tool than by analyzing grab samples due to POCIS's 5
accumulation capability. HRMS makes it possible to identify, in only one injection, targeted compounds 6
and/or suggest non-targeted compounds using a database compiled with literature and on-line data. The 7
combination of both these tools can significantly improve environmental monitoring programs. 8
The data processing described here enabled us to identify organic compounds in groundwater by target and 9
suspect screening. Their presence is in agreement with the previously-known types of pollution sources for 10
each site (agricultural and urban effluents for site 1 and an agricultural source for site 2), with the exception 11
of some PhACs in site 2 that seem to indicate an impact of effluents from wastewater treatment plants. 12
This methodology revealed the presence of transformation products that had never been identified before in 13
the sites. Their presence might be problematic with regard to current legislation on drinking water, which 14
stipulates that the total concentration of all pesticides and their TPs must be lower than 0.4 µg/L. 15
The use of statistics for non-target screening facilitates the process by highlighting relevant markers to 16
identify. A molecular fingerprint was made for both sites and should be continuously improved by 17
identifying the unknown compounds. Various methods for accomplishing this are currently under 18
investigation. These include i) working on the implementation of target and suspect databases, ii) ensure 19
developing a specific suspect database, and iii) comparing the pollution footprint as a function of the site 20
and/or the pollution source. A complementary approach using temporal variation analysis will be applied on 21
the sample sets to highlight differences among sampling periods, concerning for example pesticides with 22
different application periods. This work may potentially bring supplementary information. 23
Acknowledgements
24
This study was funded by BRGM. Authors would like to thank A.K. Bourg for its edits and reviews of this 25
document 26
Bibliography
27
Alvarez DA, Huckins JN, Petty JD, Jones-Lepp T, Stuer-Lauridsen F, Getting DT, et al. Tool for monitoring 28
hydrophilic contaminants in water: polar organic chemical integrative sampler (POCIS). In: R. 29
Greenwood GMaBV, editor. Passive Sampling Techniques in Environmental Monitoring. Volume 30
48. Elsevier, 2007, pp. 171-197. 31
Alvarez DA, Petty JD, Huckins JN, Jones-Lepp TL, Getting DT, Goddard JP, et al. Development of a 1
passive, in situ, integrative sampler for hydrophilic organic contaminants in aquatic environments. 2
Environmental Toxicology and Chemistry 2004; 23: 1640-1648. 3
Alvarez DA, Stackelberg PE, Petty JD, Huckins JN, Furlong ET, Zaugg SD, et al. Comparison of a novel 4
passive sampler to standard water-column sampling for organic contaminants associated with 5
wastewater effluents entering a New Jersey stream. Chemosphere 2005; 61: 610-622. 6
Amalric L, Baran N, Coureau C, Maingot L, Buron F, Routier S. Analytical developments for 47 pesticides: 7
first identification of neutral chloroacetanilide derivatives in French groundwater. International 8
Journal of Environmental Analytical Chemistry 2013; 93: 1660-1675. 9
Arditsoglou A, Voutsa D. Passive sampling of selected endocrine disrupting compounds using polar organic 10
chemical integrative samplers. Environmental Pollution 2008; 156: 316-324. 11
Bartelt-Hunt SL, Snow DD, Damon T, Shockley J, Hoagland K. The occurrence of illicit and therapeutic 12
pharmaceuticals in wastewater effluent and surface waters in Nebraska. Environmental Pollution 13
2009; 157: 786-791. 14
Berho C, Togola A, Coureau C, Ghestem J-P, Amalric L. Applicability of polar organic compound 15
integrative samplers for monitoring pesticides in groundwater. Environmental Science and Pollution 16
Research 2013; 20: 5220-5228. 17
Bletsou AA, Jeon J, Hollender J, Archontaki E, Thomaidis NS. Targeted and non-targeted liquid 18
chromatography-mass spectrometric workflows for identification of transformation products of 19
emerging pollutants in the aquatic environment. Trac-Trends in Analytical Chemistry 2015; 66: 32-20
44. 21
Boix C, Ibanez M, Zamora T, Sancho JV, Niessen WMA, Hernandez F. Identification of new omeprazole 22
metabolites in wastewaters and surface waters. Science of the Total Environment 2014; 468: 706-23
714. 24
Diaz R, Ibanez M, Sancho JV, Hernandez F. Building an empirical mass spectra library for screening of 25
organic pollutants by ultra-high-pressure liquid chromatography/hybrid quadrupole time-of-flight 26
mass spectrometry. Rapid Communications in Mass Spectrometry 2011; 25: 355-369. 27
Directive 2000/60/EC establishing a framework for Community action in the field of water policy. 28
22/12/2000. Official Journal L 327. pages 1–73 29
Directive 2006/118/EC of the European Parliament and of the Council on the protection of groundwater 30
against pollution and deterioration. 31
32
Directive 2014/80/EU amending Annex II to Directive 2006/118/EC of the European Parliament and of the 33
Council on the protection of groundwater against pollution and deterioration. 20/06/2014. Official 34
Journal L 182/52. Pages 0052. 35
36
Durand S, Legeret B, Martin A-S, Sancelme M, Delort A-M, Besse-Hoggan P, et al. Biotransformation of 37
the triketone herbicide mesotrione by a Bacillus strain. Metabolite profiling using liquid 38
chromatography/electrospray ionization quadrupole time-of-flight mass spectrometry. Rapid 39
Communications in Mass Spectrometry 2006; 20: 2603-2613. 40
Escher BI, Fenner K. Recent Advances in Environmental Risk Assessment of Transformation Products. 41
Environmental Science & Technology 2011; 45: 3835-3847. 42
Fenet H, Mathieu O, Mahjoub O, Li Z, Hillaire-Buys D, Casellas C, et al. Carbamazepine, carbamazepine 43
epoxide and dihydroxycarbamazepine sorption to soil and occurrence in a wastewater reuse site in 44
Tunisia. Chemosphere 2012; 88: 49-54. 45
Ferrer I, Thurman EM. Analysis of 100 pharmaceuticals and their degradates in water samples by liquid 46
chromatography/quadrupole time-of-flight mass spectrometry. Journal of Chromatography A 2012; 47
1259: 148-157. 48
Focazio MJ, Kolpin DW, Barnes KK, Furlong ET, Meyer MT, Zaugg SD, et al. A national reconnaissance 49
for pharmaceuticals and other organic wastewater contaminants in the United States - II) Untreated 50
drinking water sources. Science of the Total Environment 2008; 402: 201-216. 51
Guibal R, Lissalde S, Charriau A, Poulier G, Mazzella N, Guibaud G. Coupling passive sampling and time 1
of flight mass spectrometry for a better estimation of polar pesticide freshwater contamination: 2
Simultaneous target quantification and screening analysis. Journal of Chromatography A 2015; 1387: 3
75-85. 4
Harman C, Thomas KV, Tollefsen KE, Meier S, Boyum O, Grung M. Monitoring the freely dissolved 5
concentrations of polycyclic aromatic hydrocarbons (PAH) and alkylphenols (AP) around a 6
Norwegian oil platform by holistic passive sampling. Marine Pollution Bulletin 2009; 58: 1671-7
1679. 8
Harman C, Tollefsen KE, Boyum O, Thomas K, Grung M. Uptake rates of alkylphenols, PAHs and 9
carbazoles in semipermeable membrane devices (SPMDs) and polar organic chemical integrative 10
samplers (POCIS). Chemosphere 2008; 72: 1510-1516. 11
Hernandez F, Bijlsma L, Sancho JV, Diaz R, Ibanez M. Rapid wide-scope screening of drugs of abuse, 12
prescription drugs with potential for abuse and their metabolites in influent and effluent urban 13
wastewater by ultrahigh pressure liquid chromatography-quadrupole-time-of-flight-mass 14
spectrometry. Analytica Chimica Acta 2011; 684: 96-106. 15
Hernandez F, Ibanez M, Botero-Coy A-M, Bade R, Bustos-Lopez MC, Rincon J, et al. LC-QTOF MS 16
screening of more than 1,000 licit and illicit drugs and their metabolites in wastewater and surface 17
waters from the area of Bogota, Colombia. Analytical and bioanalytical chemistry 2015; 407: 6405-18
16. 19
Hernandez F, Sancho JV, Ibanez M, Abad E, Portoles T, Mattioli L. Current use of high-resolution mass 20
spectrometry in the environmental sciences. Analytical and Bioanalytical Chemistry 2012; 403: 21
1251-1264. 22
Hug C, Ulrich N, Schulze T, Brack W, Krauss M. Identification of novel micropollutants in wastewater by a 23
combination of suspect and nontarget screening. Environmental Pollution 2014; 184: 25-32. 24
Huntscha S, Singer HP, McArdell CS, Frank CE, Hollender J. Multiresidue analysis of 88 polar organic 25
micropollutants in ground, surface and wastewater using online mixed-bed multilayer solid-phase 26
extraction coupled to high performance liquid chromatography-tandem mass spectrometry. Journal 27
of Chromatography A 2012; 1268: 74-83. 28
Ibanez M, Sancho JV, Pozo OJ, Hernandez F. Use of liquid chromatography quadrupole time-of-flight mass 29
spectrometry in the elucidation of transformation products and metabolites of pesticides. Diazinon as 30
a case study. Analytical and Bioanalytical Chemistry 2006; 384: 448-457. 31
Ibanez M, Sancho JV, Pozo OJ, Niessen W, Hernandez F. Use of quadrupole time-of-flight mass 32
spectrometry in the elucidation of unknown compounds present in environmental water. Rapid 33
Communications in Mass Spectrometry 2005; 19: 169-178. 34
Ibrahim I, Togola A, Gonzalez C. In-situ calibration of POCIS for the sampling of polar pesticides and 35
metabolites in surface water. Talanta 2013a; 116: 495-500. 36
Ibrahim I, Togola A, Gonzalez C. Polar organic chemical integrative sampler (POCIS) uptake rates for 17 37
polar pesticides and degradation products: laboratory calibration. Environmental Science and 38
Pollution Research 2013b; 20: 3679-3687. 39
Jelic A, Michael I, Achilleos A, Hapeshi E, Lambropoulou D, Perez S, et al. Transformation products and 40
reaction pathways of carbamazepine during photocatalytic and sonophotocatalytic treatment. Journal 41
of Hazardous Materials 2013; 263: 177-186. 42
Kovarova J, Marsalek P, Blahova J, Jurcikova J, Kasikova B, Svobodova Z. Occurrence of Perfluoroalkyl 43
Substances in Fish and Water from the Svitava and Svratka Rivers, Czech Republic. Bulletin of 44
Environmental Contamination and Toxicology 2012; 88: 456-460. 45
Leendert V, Van Langenhove H, Demeestere K. Trends in liquid chromatography coupled to high-resolution 46
mass spectrometry for multi-residue analysis of organic micropollutants in aquatic environments. 47
Trac-Trends in Analytical Chemistry 2015; 67: 192-208. 48
Li H, Vermeirssen EL, Helm PA, Metcalfe CD. Controlled field evaluation of water flow rate effects on 49
sampling polar organic compounds using polar organic chemical integrative samplers. 50
Environmental Toxicology and Chemistry 2010; 29: 2461-2469. 51
Lopez B, Ollivier P, Togola A, Baran N, Ghestem J-P. Screening of French groundwater for regulated and 52
emerging contaminants. Science of the Total Environment 2015; 518: 562-573. 53
Martínez Bueno MJ, Hernando MD, Agüera A, Fernández-Alba AR. Application of passive sampling 1
devices for screening of micro-pollutants in marine aquaculture using LC-MS/MS. Talanta 2009; 77: 2
1518-1527. 3
Martinez Bueno MJ, Ulaszewska MM, Gomez MJ, Hernando MD, Fernandez-Alba AR. Simultaneous 4
measurement in mass and mass/mass mode for accurate qualitative and quantitative screening 5
analysis of pharmaceuticals in river water. Journal of Chromatography A 2012; 1256: 80-88. 6
Mazzella N, Dubernet J-F, Delmas F. Determination of kinetic and equilibrium regimes in the operation of 7
polar organic chemical integrative samplers - Application to the passive sampling of the polar 8
herbicides in aquatic environments. Journal of Chromatography A 2007; 1154: 42-51. 9
Metcalfe CD, Beddows PA, Gold Bouchot G, Metcalfe TL, Li H, Van Lavieren H. Contaminants in the 10
coastal karst aquifer system along the Caribbean coast of the Yucatan Peninsula, Mexico. 11
Environmental Pollution 2011; 159: 991-997. 12
Mueller A, Schulz W, Ruck WKL, Weber WH. A new approach to data evaluation in the non-target 13
screening of organic trace substances in water analysis. Chemosphere 2011; 85: 1211-1219. 14
Postigo C, Barcelo D. Synthetic organic compounds and their transformation products in groundwater: 15
Occurrence, fate and mitigation. Science of the Total Environment 2015; 503: 32-47. 16
Regulation (EC) No 1907/2006 of 18 December 2006 concerning the Registration, Evaluation, 17
Authorisation and Restriction of Chemicals (REACH) and establishing a European Chemicals 18
Agency. 19
20
Schymanski EL, Jeon J, Gulde R, Fenner K, Ruff M, Singer HP, et al. Identifying Small Molecules via High 21
Resolution Mass Spectrometry: Communicating Confidence. Environmental Science & Technology 22
2014; 48: 2097-2098. 23
Tapie N, Devier MH, Soulier C, Creusot N, Le Menach K, Ait-Aissa S, et al. Passive samplers for chemical 24
substance monitoring and associated toxicity assessment in water. Water Science and Technology 25
2011; 63: 2418-2426. 26
Togola A, Budzinski H. Development of polar organic integrative samplers for analysis of pharmaceuticals 27
in aquatic systems. Analytical Chemistry 2007; 79: 6734-6741. 28
Van Stempvoort DR, Roy JW, Grabuski J, Brown SJ, Bickerton G, Sverko E. An artificial sweetener and 29
pharmaceutical compounds as co-tracers of urban wastewater in groundwater. Science of the Total 30
Environment 2013; 461: 348-359. 31
Vermeirssen ELM, Dietschweiler C, Escher BI, Van Der Voet J, Hollender J. Transfer kinetics of polar 32
organic compounds over polyethersulfone membranes in the passive samplers pocis and 33
chemcatcher. Environmental Science and Technology 2012; 46: 6759-6766. 34
Vrana B, Mills GA, Allan IJ, Dominiak E, Svensson K, Knutsson J, et al. Passive sampling techniques for 35
monitoring pollutants in water. Trac-Trends in Analytical Chemistry 2005; 24: 845-868. 36
37