Table S1. Genetic divergence (FST) between pairs of populations of Alcantarea ‘inselberg’ bromeliads.
Population names follow the tables and figures of the main paper. All FST estimates were highly significant
at p<0.005.
BRA GIM GRC IIM IVV MAR NEV
BRA 0.000 0.541 0.603 0.454 0.420 0.579 0.616 GIM 0.000 0.092 0.386 0.336 0.517 0.660 GRC 0.000 0.506 0.443 0.604 0.706 IIM 0.000 0.143 0.536 0.639 IVV 0.000 0.456 0.599 MAR 0.000 0.707 NEV 0.000
Table S2. Estimates of effective population sizes (Ne) and migration rates (Nem) for all studied
Alcantarea species, including maximum likelihood estimates (MLE) and 0.025 and 0.975 percentiles. The directions of Nem are indicated by population numbers, with the first number indicating the
source and the second one the receiving population. Species names are BRA, A. brasiliana; GEN, A. geniculata; IMP, A. imperialis; MAR, A. martinellii; NEV, A. nevaresii. Species comparisons with significantly asymmetric migration based on 95% confidence intervals are indicated in bold type.
Population Parameter 0.025 percentile MLE 0.975 percentile
BRA (pop1) Ne1 2453 2610 2787
GEN (pop2) Ne2 2248 2460 2677
IMP (pop3) Ne3 2579 2860 3187
MAR (pop4) Ne4 2108 2422 2810
NEV (pop5) Ne5 1981 2190 2452
GEN -> BRA Nem_21 0.116 0.162 0.221
IMP -> BRA Nem_31 0.123 0.169 0.230
MAR -> BRA Nem_41 0.074 0.110 0.157
NEV -> BRA Nem_51 0.118 0.164 0.223
BRA -> GEN Nem_12 0.104 0.151 0.211
IMP -> GEN Nem_32 0.140 0.195 0.264
MAR -> GEN Nem_42 0.098 0.141 0.199
NEV -> GEN Nem_52 0.065 0.099 0.146
BRA -> IMP Nem_13 0.235 0.322 0.441
MAR -> IMP Nem_43 0.191 0.268 0.374
NEV -> IMP Nem_53 0.082 0.129 0.195
BRA -> MAR Nem_14 0.040 0.070 0.117
GEN -> MAR Nem_24 0.131 0.192 0.280
IMP -> MAR Nem_34 0.148 0.216 0.312
NEV -> MAR Nem_54 0.050 0.086 0.141
BRA -> NEV Nem_15 0.048 0.075 0.116
GEN -> NEV Nem_25 0.048 0.077 0.118
IMP -> NEV Nem_35 0.044 0.071 0.111
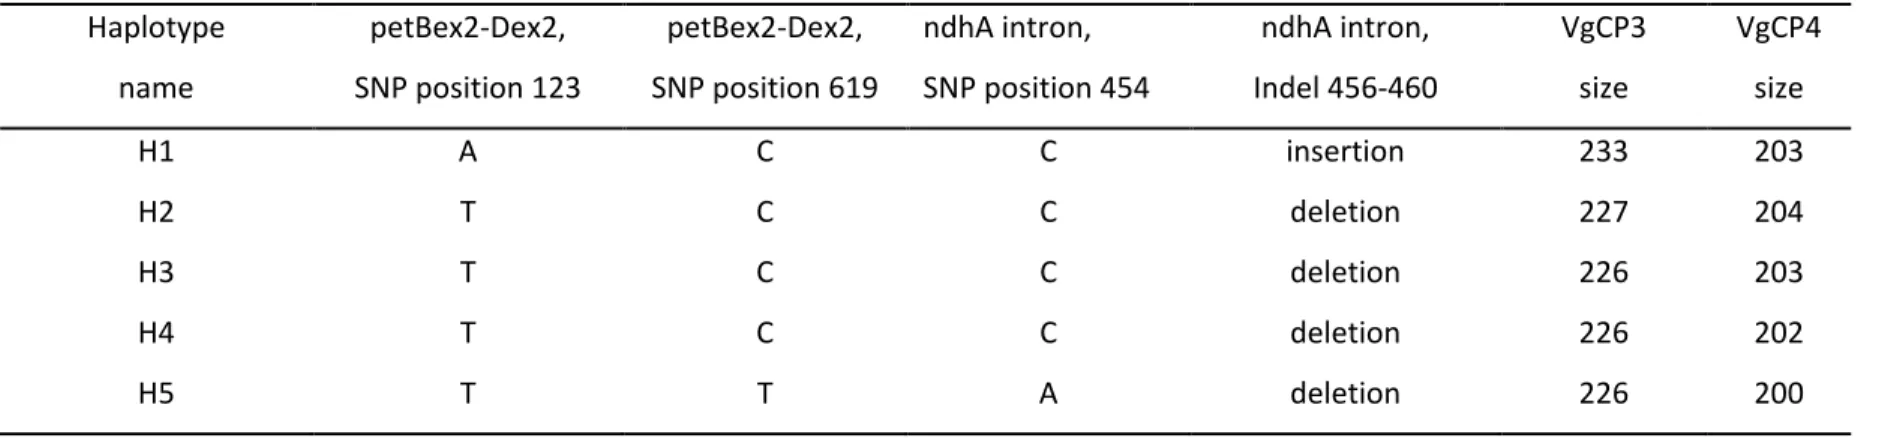
Table S3. Definition of plastid DNA haplotypes based on two Single Nucleotide Polymorphisms (SNPs) in region petBex2-Dex2 (Ebert & Peakall, 2009), one SNP and one indel in region ndhA intron (Shaw et al., 2007), and fragment sizes at the two plastid microsatellite markers VgCP3 and VgCP4 (Palma-Silva et al., 2009). For references see main paper. Sequences were deposited in Genbank (submission ID: 1862480; accession numbers to be updated until online-publication).
Haplotype name petBex2-Dex2, SNP position 123 petBex2-Dex2, SNP position 619 ndhA intron, SNP position 454 ndhA intron, Indel 456-460 VgCP3 size VgCP4 size H1 A C C insertion 233 203 H2 T C C deletion 227 204 H3 T C C deletion 226 203 H4 T C C deletion 226 202 H5 T T A deletion 226 200