HAL Id: hal-00798556
https://hal.archives-ouvertes.fr/hal-00798556
Submitted on 4 Jan 2018HAL is a multi-disciplinary open access archive for the deposit and dissemination of sci-entific research documents, whether they are pub-lished or not. The documents may come from teaching and research institutions in France or abroad, or from public or private research centers.
L’archive ouverte pluridisciplinaire HAL, est destinée au dépôt et à la diffusion de documents scientifiques de niveau recherche, publiés ou non, émanant des établissements d’enseignement et de recherche français ou étrangers, des laboratoires publics ou privés.
Distributed under a Creative Commons Attribution - NonCommercial| 4.0 International License
Crystallographic and Pressure-Temperature State
Diagram Approach for the Phase Behavior and
Polymorphism Study of Glutaric Acid
Philippe Espeau, Philippe Négrier, Yohann Corvis
To cite this version:
Philippe Espeau, Philippe Négrier, Yohann Corvis. Crystallographic and Pressure-Temperature State Diagram Approach for the Phase Behavior and Polymorphism Study of Glutaric Acid. Crystal Growth & Design, American Chemical Society, 2013, 13 (2), pp.723-730. �10.1021/cg301442f�. �hal-00798556�
Crystallographic and Pressure
−Temperature State Diagram
Approach for the Phase Behavior and Polymorphism Study of
Glutaric Acid
Philippe Espeau,*
,†Philippe Ne
́grier,
‡and Yohann Corvis
††EA 4066, Physico Chimie Industrielle du Médicament, Sorbonne Paris Cité, Faculté des Sciences Pharmaceutiques et Biologiques,
Université Paris Descartes, 4 Avenue de l’Observatoire, 75 006 Paris, France
‡LOMA, UMR 5798, Université Bordeaux, 33400 Talence, France
ABSTRACT: The two known polymorphs of glutaric acid were studied from
a crystallographic and a thermal point of view. The crystal structure of theα phase was determined by means of X ray powder diffraction experiments at 75 °C. The relative stability of both solid phases was established as a function of temperature and pressure. The thus obtained state diagram indicates that the diacid exhibits an enantiotropic and a monotropic behavior at low and high pressure, respectively.
■
INTRODUCTIONGlutaric acid, a five carbon dicarboxylic acid, has several interesting physicochemical properties. Hence, it is often used to cocrystallize active pharmaceutical ingredients (API) in order to modify the physical properties of drugs, such as solubility, dissolution rate, stability, hygroscopisity, and compressibility, but without altering their pharmacological behavior.1−3Besides, glutaric acid has the lowest melting point of all the dicarboxylic acid compounds.
Upon heating, glutaric acid exhibits aβ toward α solid−solid transition before melting. The two polymorphs have been identified, and their crystal structure has been characterized. Both phases crystallize in a C2/c monoclinic space group with Z = 4 for theβ phase4 and Z = 8 for the α one.5 However, regarding theα phase, it has recently been reported that, at 173 K,5 only the unit cell parameters obtained from embedded nanocrystals in controlled pore glass were provided, with no further information regarding the crystal structure, e.g., atomic coordinates, conformations of the molecules, and bond lengths. This is why the crystal structure of theα phase was solved from high resolution X ray powder diffraction (XRPD) experiments. In addition, the corresponding structure parameters were obtained at a temperature where the phase is stable, i.e., 75°C. As previously reported, glutaric acid has an enantiotropic behavior at low pressures.5The present work aims to determine whether the nature of the thermodynamic behavior is enantiotropic or monotropic when the pressure increases. Indeed, two cases may arise: the curve of the solid−solid equilibrium and the curve of the solid−liquid equilibrium converge either at high or low pressure. The first case
corresponds to a monotropic high pressure behavior. As for the second case, an enantiotropic behavior is encountered whatever the pressure imposed on the system. For that reason, the state diagram of the substance has been established as a function of temperature and pressure. It is well known that the effect of temperature and/or pressure increase on the equilibrium can be qualitatively predicted by applying Le Chatelier’s principle. Quantitatively, this principle is expressed by the Clapeyron equation. The latter equation will be used to determine the slopes corresponding to the two phase equilibria between the solids, on the one hand, and between each solid and the liquid, on the other hand, in order to subsequently establish the frontiers between the pure phases.
■
MATERIALS AND METHODSChemicals. Glutaric acid (purity higher than 99%) was purchased from Aldrich. The product was used without further purification.
Thermal Analysis. Temperatures and enthalpies of fusion were determined by using a differential scanning calorimeter 822e (Mettler Toledo, Switzerland); scan rate: 10°C min−1. The calibration was made by using high purity indium (Tfus= 156.6°C, ΔfusH = 3.27 kJ
mol−1). Six independent measurements were carried out on heating and cooling. The errors on the enthalpies and the temperatures resulted from the calculation of the standard deviation from the average value.
The molar heat capacities (Cp) were also determined through the
The samples were ground beforehand in a mortar to minimize the interstices between particles, then weighed with a microbalance sensitive to 1 μg, and finally sealed in 40 μL aluminum pans. To optimize the measurement errors, the pans were completely filled before being sealed. A differential scanning calorimetry (DSC) experimental procedure based on sapphire reference with a 15 °C min−1scan rate allowed us to obtain the evolution of the heatflow as a function of temperature. This method had been previously validated.6 The baseline used for the signal integration was established by an isothermal run of 10 min before and after the dynamic run described above. The uncertainty was determined by calculating the standard deviation (±2.4% for the α and β solid states and ±1.4% for the liquid state) from the average value errors of eight independent measure ments for each physical state.
X-ray Powder Diffraction. The experiments were performed with a horizontally mounted cylindrical position sensitive detector CPS 120 (Debye−Scherrer geometry, transmission mode) from INEL, using the Cu Kα1radiation (λ = 1.5406 Å). The samples were gently crushed
before being introduced into 0.5 mm inner diameter Lindemann glass capillaries. The high resolution XRPD patterns were indexed using the peak picking option of the software package of Materials Studio Modeling 5.5.7 Potential solutions for unit cell parameters and the space group were found using the X cell algorithm.8 The unit cell dimensions were refined using a Pawley profile fitting procedure.9This procedure was also followed to determine unit cell parameters as a function of temperature. For structure determination, the Dreiding force field procedure10 was used to get the distances, angles, and torsions in the molecule.
Specific Volumes in the Liquid State. The specific volumes as a function of temperature were determined using a method that has already been described.11 A known mass m of glutaric acid was introduced in a calibrated cylindrical silica tube whose inner diameter d was measured with a precision of 0.01 mm. The tube was then placed vertically in an oven with a controlled temperature (±1 °C), in the 25−300 °C range. The height h of melt glutaric acid was measured by means of a cathetometer sensitive to 2μm. The specific volume V/m of the molten phase was thus determined as follows: V/m =πd2h/
(4m).
Pressure−Temperature State Diagram Determination. For a state (or a phase) of a pure substance, the Gibbs energy G is a function of pressure and temperature and may be represented by a surface in the G−P−T space,12each phase having its own G surface. Two phases
are in equilibrium when they have the same thermodynamic potential. This is materialized by the intersection of the two G surfaces. The projection of these intersections on a P−T plane gives the two phase equilibrium curve. Along the two phase equilibrium curve, the change inΔG must be equal to zero. Then
ΔG = −ΔS T+ ΔV P= d( ) d d 0 (1) As a consequence, = Δ Δ ⎜ ⎟ ⎛ ⎝ TP⎞⎠ S V d d (2)
where T andΔH stand for the transition temperature and enthalpy, respectively.ΔV corresponds to the change of specific volume at the transition point.
This equation, named the Clapeyron equation, helps to calculate the slope of the equilibrium curve.
Since at any transition pointΔS = ΔH/T, then
= Δ Δ ⎜ ⎟ ⎛ ⎝ ⎞⎠ P T H T V d d (3)
The slope of each two phase equilibrium line is thus given by this equation in the P−T plane.
In most cases, the equilibrium curves, not involving the gas phase, are modeled as straight lines.12As mentioned above, an enantiotropic behavior at low pressure leads to two possible P−T diagrams depending on the slopes of the solid−solid and solid−liquid equilibria (Scheme 1). Assuming that the slope corresponding to the solid−
liquid equilibrium is positive (which is often the case), in the case of monotropic high pressure behavior, the slope corresponding to the solid−solid equilibrium will necessarily be positive but lower than the slope of the solid−liquid equilibrium (Scheme 1, red arrow). In the case of overall enantiotropic behavior, starting from the same assumption for the solid−liquid equilibrium, it is imperative that the solid−solid equilibrium slope is higher, or even negative, with respect to the solid−liquid one (Scheme 1, blue arrow).
When a pure substance presents three phases, this leads to three two phase equilibrium lines which intersect at a triple point where the three phases are in equilibrium. In the present case, the pure substance presents four phases (two solid, one liquid, and one vapor phases). Therefore, phases taken two by two lead to six two phase equilibrium lines. Indeed, from a mathematical point of view, the number of arrangements, without repetition, of four elements taken two by two is equal to 4× 3/2 = 6. As far as the triple points are concerned, the number of arrangements of the four phases taken three by three is equal to 4× 3/3 = 4.
On this thermodynamic construction basis, the relative stability of the two polymorphic forms of glutaric acid will be apprehended.
■
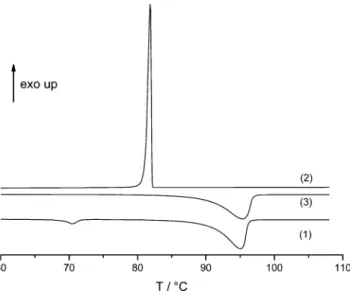
RESULTS AND DISCUSSIONThermodynamic Behavior of Glutaric Acid. Upon heating of a GA sample, the endothermic signal associated to theβ → α transition was found at 68.0 ± 0.4 °C (Figure 1, Table 1) with a 2.37± 0.03 kJ.mol−1heat. If the solid−solid transition enthalpy, as proposed here, matches the literature data, such is not the case for the corresponding transition temperature. Some authors determined the transition temper ature at temperatures higher than 68°C. This may be explained by the fact that the authors took into consideration the maximum of the peak even though the corresponding onset was set at∼70 °C. Since the calibration procedure can be done either by considering the onset or maximum of the peak and since no indication had been given by these authors on the adopted procedure, the misinterpretation of the results may be an issue.
The thermal properties corresponding to the melting point of the glutaric acidα phase were also determined to be Tfus= 90.9± 0.4 °C and ΔfusH = 19.9± 0.3 kJ mol−1. Both values are
Scheme 1. Illustration of the Enantiotropic Behavior at Low Pressurea
aThe monotropic and the enantiotropic behaviors at high pressure
result from the position of the solid−solid equilibrium (S−S) (dashed line) compared to the solid−liquid equilibrium (S−L). The monotropic high pressure behavior is obtained by taking into account the dashed line obtained by the red arrow rotation, and the overall enantiotropic behavior arises when the dashed line obtained by the blue arrow rotation is considered.
lower than those reported in the related literature (Table 1). The discrepancy in the temperature data is probably due to the same issue as the one reported for the solid−solid transition.
Upon cooling of molten GA, the acid crystallizes at 82± 1 °C (Figure 1) with a −19.9 ± 0.3 kJ mol−1associated enthalpy.
Despite a 10°C difference, the crystallization enthalpy is thus the same as the melting one. This result indicates that (i) α phase recrystallization is complete and (ii) the Cp variation between the liquid and theα phase is negligible, at least from 82 to 91 °C. This second argument was confirmed by Cp
measurements performed for both the solidα and liquid states (Table 2). Indeed, the Cp variations calculated between the
liquid and the solid, in the 82−91 °C temperature range, are defined as follows: ∫82.090.9(Cpliq− Cpαsol) dT = 0.2 kJ mol−1.
It has to be noted that upon cooling theα phase, the α → β transition does not systematically occur (no exothermic signal, Figure 1 curve 2). As a result, upon heating the recrystallized GA, the only melting peak of theα phase is obtained (Figure 1 curve 3), with the same temperature and enthalpy values as the one obtained after thefirst heating run. This result confirms the
complete recrystallization of GA into the α phase from its molten state.
After the molten GA sample was annealed at room temperature for several hours, XRPD experiments showed that the recrystallizedα phase always transits toward the stable phase, namely, theβ polymorph (results not shown).
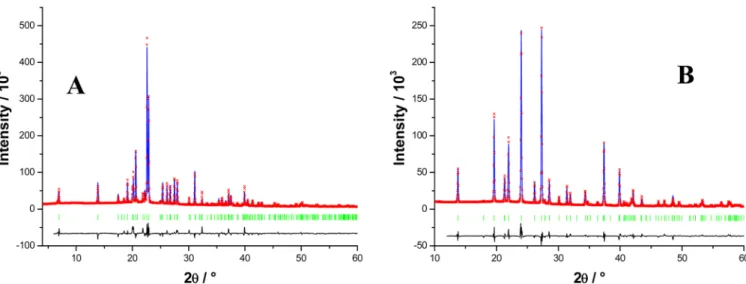
Crystal Structures of the β and α Phases. Since no crystal data of theα phase is available, the structure of the latter phase was refined from the experimental XRPD profiles obtained at 75 °C. The space group and unit cell dimensions best reproducing the diffraction pattern were found to be monoclinic space group C2/c (Z = 8) with unit cell parameters a = 25.593(1) Å, b = 5.0024(3) Å, c = 10.1667(5) Å, andβ = 92.740(2)°. A final Rietveld refinement (including Pawley refined parameters) converged to a final Rwp value of 7.19% (Figure 2A). The space group and the unit cell parameters are in good agreement with those reported in ref 5. The only differences are probably due to the different acquisition temperature. The results of the refinement associated to the refinement from ref 5 are given in Table 3.
The X ray crystallographic file (CIF) is available at www. ccdc.cam.ac.uk/data request/cif with deposition number CCDC 891105.
The crystal structure of theβ phase was also refined, at T = 22°C, from experimental XRPD profiles. The space group and unit cell parameters obtained this way are as follows: monoclinic space group C2/c (Z = 4) with unit cell parameters a = 12.8992(4) Å, b = 4.8202(2) Å, c = 9.9441(4) Å, andβ = 96.870(2)°. A final Rwp value of 6.56% is then obtained (Figure 2B). The results match those reported in ref 4 (Table 3).
Figure 1.Thermograms of glutaric acid obtained at 5°C min−1. (1) First heating, (2) cooling, and (3) second heating.
Table 1. Temperatures and Enthalpies of the Transition Points of Glutaric Acida
mass (mg) Ttrans(°C) ΔtransH (kJ mol−1) Tfus(°C) ΔfusH (kJ mol−1) Tcryst(°C) ΔcrystH (kJ mol−1) ref
6.84 68.23 2.35 90.56 19.63 83.51 19.42 this work 67.58 90.97 19.44 5.17 68.41 2.38 90.88 19.64 81.93 20.12 67.56 91.38 19.91 10.22 68.17 2.37 90.63 19.89 81.98 19.88 67.73 2.36 90.82 19.94 6.98 68.42 2.40 90.40 20.03 83.80 20.27 67.67 91.40 19.99 3.18 68.40 2.33 90.98 19.60 80.36 19.72 67.66 91.35 19.69
mean values 68.0± 0.4 2.37± 0.03 90.9± 0.4 19.8± 0.3 82± 1 19.9± 0.3 this work 76 2.34± 0.06 99 21.3± 0.6 80 95 20.7± 0.4 5
75.5 2.464 98 20.899 13
63 14
65 2.4 15
aEach sample was measured twice, onfirst and second heating.
Table 2. Coefficients of Regression a and b for Cp(J mol−1
°C−1) =aT + b and Their Corresponding Standard
Deviations, whereT Stands for the Temperature in °C
a b
solidβ 0.8001± 0.0076 154.2± 0.2 solidα 2.8734± 0.0719 15.9± 3.5 liquid 0.5530± 0.0096 239.5± 1.2
The X ray crystallographic file (CIF) is available at www. ccdc.cam.ac.uk/data request/cif with deposition number CCDC 891106.
The unit cells obtained for bothβ and α phases, viewed as the projection onto plane ac, are presented in Figure 3A,B, respectively.
As far as theβ phase is concerned, only half of the molecule has to be considered for the construction of the unit cell. This is due to the fact that (i) the molecule presents a 2 fold rotation axis and (ii) the central carbon of the molecule chain is located in plane bc (Figure 3A). Consequently, only three carbon, four hydrogen, and two oxygen atoms are needed for the description of the β crystal structure. Conversely, the independent molecule has no preferential arrangement in the unit cell of theα phase (Figure 3B). In that case, all the molecule atoms should therefore be considered as independent.
As seen in Figure 3, the axis of the molecule is not parallel to the a axis. The inclination of the molecules in the unit cell with respect to the a axis is equal to 122.88° and 130.92°, for the β andα phases, respectively.
Although the carbon chain is rather linear and rigid, its extremities, which are composed by the carbonyl groups, are slightly distorted, and then they do not adopt the same conformation with respect to the carbonaceus body of the molecule (Figure 4). The two planes formed by the two carboxylic groups at the ends of the chain make an angle of 69° for theα phase instead of 11.5° for the α phase. The distortion is therefore lower for theβ phase. Such an unfolding explains why the length of the molecule is longer for theα phase.
The OH···OC hydrogen bonds in the β phase are set along the direction of the chain and equal to 1.677 Å. But, in the α phase, because of the different conformation of the molecule (Figure 4) and the different stacking, the hydrogen bonds formed at the chain extremity are not equivalent. For that reason, two different H bond distances should be considered, i.e., 1.687 Å and 1.727 Å. The dissimilarity is due to differences in the two COOH groups, while, for the β phase, one COOH is deduced from the other one by symmetry (same conformation).
The stacking takes place along the chain axis. Consequently, a layer structure is obtained in the two other directions (Figure 5). This phenomenon has previously been reported for long chain n alkanes16and for other dicarboxylic acids.4Looking at the molecular stacking along the chain axis, one may observe
Figure 2.Final Rietveld refinement from X ray diffraction pattern for glutaric acid: (A) α phase obtained at 75 °C; (B) β phase obtained at 24 °C. The experimental and calculated patterns are represented in blue lines and red crosses, respectively. The black curve is the difference between the observed and calculated intensities. The peak positions are indicated by vertical green bars.
Table 3. Lattice Parameters and Selected Geometrical Data for theβ and α Phases of Glutaric Acid, Obtained from Powder and Single Crystal Refinement
formula C5H8O4
FW (g mol−1) 132.115 crystal system monoclinic space group C2/c
β Phase
this work ref 4 temperature 24°C 22°C wavelength (Å) 1.540562 0.71073 unit cell dimensions (Å) a = 12.8992(4) a = 12.968(3)
b = 4.8202(2) b = 4.8296(12) c = 9.9441(4) c = 9.982(2) β = 96.870(2)° β = 96.872(6)° Z 4 4 V (Å3) 613.9(3) 620.7(3) Dx(g cm−3) 1.435 1.414 μ (mm−1) 0 Rwp 6.56% R1, I > 2σ(I) 4.15% wR2, I > 2σ(I) 11.96% α phase
this work ref 5 temperature 75°C 100°C wavelength (Å) 1.540562 0.71073 unit cell dimensions (Å) a = 25.593(1) a = 25.623(3)
b = 5.0024(3) b = 4.9196(6) c = 10.1667(5) c = 9.9164(12) β = 92.740(2)° β = 94.079(2)° Z 8 8 V (Å3) 1300.1(3) 1246.8(3) Dx(g cm−3) 1.355 1.408 μ (mm−1) 0.124 Rwp 7.19% R1, I > 2σ(I) 3.92% wR2, I > 2σ(I) 11.13%
the interlayer packing for both phases (Figure 5), the longer interlayer distance corresponding to unit cell parameter b.
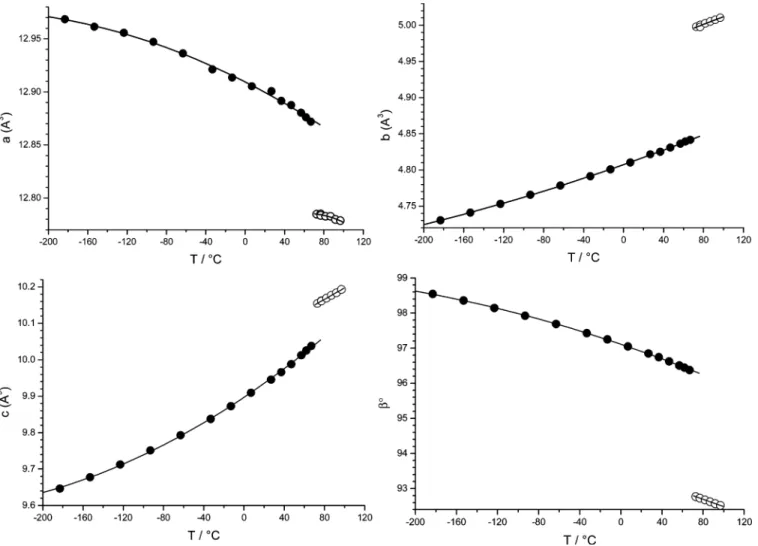
Influence of Temperature on the Unit Cell Parame-ters. The unit cell parameters were studied as a function of temperature for theβ and α crystal phases (Figure 6).
Interestingly, unit cell parameters b and c increase with temperature while a, as well as the β angle, decrease. This evolution is still remarkable after the β−α transition. The variation of the a unit cell parameter with temperature obtained for the α phase can be compared to the one that has been determined for the rotator phase of the odd numbered n alkanes.16,17 These molecule families have similar properties because they are chain like molecular compounds.
Despite the opposite variation of a and b, in particular in the α phase, the rectangular cell area a·b increases quite linearly with temperature for both theα and β phases. The decrease of the unit cell parameter a in theα phase is then counterbalanced by the strong expansion along the b axis at theβ−α transition point (expansion equal to 0.7% instead of 3.0%, respectively). As a result, the cell volume in the α phase increases with temperature (Figure 7).
Theβ angle of the unit cell decreases with temperature and tends to 90° in the α phase. This implies that the system tends to the orthorhombic structure when approaching the melting point.
Two-Phase Equilibrium Curves. The specific volumes in the solid and liquid states were deduced as a function of temperature, from the X ray and the liquid density results, respectively (Figure 7).
The results of thefitting of the corresponding curves, i.e., the coefficients and their standard deviations obtained from a least squares regression method, are presented in Table 4.
A linear behavior with temperature may be noticed for the liquid state and theα phase. For the specific volumes in the β phase, a second order polynomial behavior may be observed as the measurements were carried out over a wide temperature range. Nevertheless, from our results, the specific volume changes can be estimated at the transition points. Then, it follows that ΔV(β−α) and ΔV(α−L) are equal to 3.81 and 11.86 cm3mol−1, respectively.
In order to determine whether the system behaves enantiotropically or monotropically at high pressure, the slopes of the solid−solid and solid−liquid equilibria must be calculated, assuming, as mentioned before, a linear behavior of the P = f(T) curve. Using eq 3, it comes out that
= = α β α → − → − ⎜ ⎟ ⎜ ⎟ ⎛ ⎝ ⎞ ⎠ ⎛ ⎝ ⎞ ⎠ P T P T d d 4.61 MPa K and d d 1.75 MPa K L 1 1
Because (dP/dT)α→Lis higher than (dP/dT)β→α, the two phase
equilibrium curves converge as the pressure and the temper ature increase. The coordinates of the intersection point (T =
Figure 3.Layer structures in the two glutaric acid solid phases. (A)β phase, and (B) α phase. The hydrogen bonds are represented in blue dashed lines.
Figure 4.Conformations of the molecules in theβ phase (left) and α phase (right), showing the relative orientation of the carbonyl groups of the molecule.
378 K (105°C), P = 63 MPa) correspond to the coordinates of theβ−α−L triple point. With the triple points of fusion and the transition one, theβ−α−L triple point corresponds to the third triple point of the system (Figure 8).
According to calculations made by using the Antoine equation and the data from ref 18, the vapor pressure of the liquid varies from 127 to 77695 Pa (0.7 MPa) in the 155−303 °C temperature range. Given the very large scale of the pressure (up to 63 MPa), these values may be neglected, and, therefore, it may be considered that the pressure at the three triple points β−α−V, β−L−V and α−L−V is close to zero.
The temperature and enthalpy of melting of theβ phase can be approximated as follows:ΔfusH(β, Tfus(β)) = ΔtransH(β−α,
Tβ−α) + ΔfusH(α, Tfus(α)) = 22.23 kJ mol−1, assuming the Cp variation to be negligible between theβ phase and the liquid in the 69−92 °C temperature range. Consequently, the melting temperature of theβ phase was found to be Tfus(β) = 89.7 °C.
Considering the latter melting temperature, one can review the calculation of the melting enthalpy at Tfus(β), by using the Cp
measurements given in Table 2.
Hence,ΔfusH(β, Tfus(β)) = ΔtransH(β−α, Tfus(β)) + ΔfusH(α,
Tfus(β)), with
∫
∫
β α β β α Δ − = Δ − + + β α− β α H T H T C T C T ( , ( )) ( , ) d d trans fus trans 89.7 68.0 p, sol 68.0 89.7 p, sol andFigure 6.Evolution with temperature of the unit cell parameters (a, b, c, andβ) for glutaric acid (●:β phase;○:α phase). For comparison, unit cell parameter a has been divided by 2 for theα phase, because there are twice as many molecules in the α unit cell compared to the β one (Zα/Zβ= 2).
Figure 7.Evolution of the specific volumes in cm3 mol−1 with the
temperature for the two solid phases and for the liquid state of glutaric acid. (■)β phase, (●)α phase, and (▲) liquid.
∫
∫
α β α α Δ = Δ + + α H T H T C T C T ( , ( )) ( , ( )) d dfus fus fus
90.9 89.7 p liq 89.7 90.9 p, sol
The obtained outcome, ΔfusH(β, Tfus(β)) = 22.5 ± 0.6 kJ mol−1, corroborates the assumption of neglecting the Cp
variations since the two values are identical.
This fourth triple point can then be positioned in the P−T diagram (Figure 8).
From Figure 7, it may be possible to estimate the specific volume change at the melting point of theβ phase (Tfus(β) = 89.7°C). Then, it follows that ΔV(β−L) = 15.44 cm3mol−1. Considering the melting data of this polymorph, one can thus calculate the slope of the (β−L) equilibrium using eq 3: (dP/ dT)β→L= 3.97 MPa K−1
This two phase equilibrium necessarily passes through the (β−L−V) and (β−α−L) triple points. Graphically, this leads to a slope equal to 4.197 MPa K−1. This differs from the calculated slope, partly because of the approximation related to the calculation of the β melting data. Nevertheless, this does not alter the drawing of the p−T diagram nor the relative position of the triple points.
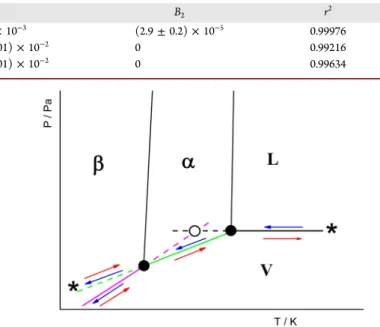
As shown in Figure 8, glutaric acid presents an enantiotropic behavior at ordinary pressure. However, for pressures higher than 63 MPa, a monotropic behavior may be observed whatever the temperature. At high pressure, the β phase melts directly, without anyβ−α transformation.
A possible explanation for the partial recrystallization of theα phase into theβ phase is given in Figure 9. Upon cooling, the liquid recrystallizes in the high temperatureα phase, followed
by a cooling along the α−V path, which is the path of least variance (Figure 9, green line). But, at the solid−solid β−α−V transition point, instead of following theβ−V path (Figure 9, magenta line), where the vapor pressure is at the lowest point, a part of the solid continues to follow theα−V path, which, this time, is metastable (Figure 9, dashed green line). After the end of cooling, we obtained, in random proportions, a concomitant crystallization of bothα and β phases.19Upon heating, only the β phase is transformed into the α phase at the transition point before melting, while the remainingα phase does not undergo any modification up to the fusion point.
■
CONCLUSIONThe relative stability of the two polymorphs of glutaric acid was established as a function of temperature and pressure. At ordinary pressure, each polymorph has its own domain of stability. At high pressure, only theβ phase presents a stability domain in the pressure−temperature diagram. The stable phase in the corresponding domain presents the minimal Gibbs energy with respect to the other phases.
The thermodynamic approach presented here to establish the relative stability of the solid phases of glutaric acid has previously been applied to other straight chain molecules like n alkanes.20 Moreover, the solid properties established for dicarboxylic acid are extremely close to those observed for the other chain molecule families. Among all the dicarboxylic acids, glutaric acid is the one with the lowest melting point.4 Interestingly, as for the n alkane family, the melting behavior depends on the parity of the chain, which is necessarily linked to the nature of the solid phase that melts.4,21
Table 4. Fitting Parameters Obtained for Glutaric Acid Specific Volumes as a Function of Temperature, in the Solid and Liquid States,V/m (cm3mol−1) =A + B1T+ B2T2, whereT Stands for the Temperature in K
A B1 B2 r2
β phase 87.05± 0.07 (9.3± 0.7) × 10−3 (2.9± 0.2) × 10−5 0.99976 α phase 89.1± 0.4 (2.453± 0.001) × 10−2 0 0.99216 liquid 81.5± 0.4 (7.764± 0.001) × 10−2 0 0.99634
Figure 8. Predicted pressure−temperature state diagram of glutaric acid pointing out the relative stability of the two solid phases as a function of temperature and pressure. Triple points: (1)α−L−V, (2) β−α−L, (3) β−α−L, (4) β−L−V. Stable (●) and metastable (○) states.
Figure 9. Possible paths followed upon cooling (blue arrows) and upon heating (red arrows). The two asterisks indicate the initial and final states before and after the cooling and heating processes. The α− V and the β−V equilibrium curves are represented in green and magenta straight lines, respectively. The dashed parts correspond to metastable extensions of the related two phase equilibria.
■
AUTHOR INFORMATIONCorresponding Author
*Ph/fax: +33 (0) 1 53 73 96 76. E mail address: philippe. [email protected].
Notes
The authors declare no competingfinancial interest.
■
ACKNOWLEDGMENTSThe authors thank Ms. G. Arnaud Vincent and M. P. Bardy for fruitful discussions and advice on the manuscript, as well as Dr. S. Massip and Pr. J. M. Leger for helpful crystallographic assistance.
■
REFERENCES(1) McNamara, D. P.; Childs, S. L.; Giordano, J.; Iarriccio, A.; Cassidy, J.; Shet, M. S.; Mannion, R.; O’Donnell, E.; Park, A. Pharm. Res. 2006, 23 (8), 1888−1897.
(2) Stanton, M. K.; Bak, A. Cryst. Growth Des. 2008, 8 (10), 3856− 3862.
(3) Good, D. J.; Rodriguez Hornedo, N. Cryst. Growth Des. 2009, 9 (5), 2252−2264.
(4) Thalladi, V. R.; Nusse, M.; Boese, R. J. Am. Chem. Soc. 2000, 122, 9227−9236.
(5) Ha, J. M.; Hamilton, B. D.; Hillmyer, M. A.; Ward, M. D. Cryst. Growth Des. 2009, 9 (11), 4766−4777.
(6) Lazerges, M.; Corvis, Y.; Pardieu, E.; Bouteiller, L.; Espeau, P. Fluid. Phase Equilib. 2012, 315, 107−112.
(7) Materials Studio Modeling, Version 5.5; Accelrys: San Diego, CA. (8) Neumann, M. A. J. Appl. Crystallogr. 2003, 36, 356−365. (9) Pawley, G. S. J. Appl. Crystallogr. 1981, 14, 357−361.
(10) Mayo, S. L.; Olafson, B. D.; Goddard, W. A. J. Phys. Chem. 1990, 94, 8897−8909.
(11) Espeau, P.; Ceolin, R. Thermochim. Acta 2006, 445, 32−35. (12) Oonk, H. A. J. In Phase Theory: The Thermodynamics of Heterogeneous Equilibria; Elsevier: Amsterdam, 1981; pp 49−61.
(13) Cingolani, A.; Berchiesi, G. J. Therm. Anal. 1974, 6, 87−90. (14) Grip, J.; Samuelsen, E. J. Phys. Scr. 1984, 29, 556−560. (15) Petropavlov, N. N.; Tsygankova, I. G.; Teslenko, L. A. Sov. Phys. Crystallogr. 1988, 33, 853−855.
(16) Doucet, J.; Denicolo, I.; Craievich, A. J. Chem. Phys. 1981, 75 (3), 1523−1529.
(17) Ungar, G.; Masic, N. J. Phys. Chem. 1985, 89 (6), 1036−1042. (18) Stull, D. R. Ind. Eng. Chem. 1947, 39, 517−540.
(19) Bernstein, J.; Davey, J. D.; Henck, J. O. Angew. Chem., Int. Ed. 1999, 38, 3440−3461.
(20) Espeau, P.; Ceolin, R. J. Phys. Chem. B. 2008, 112, 2063−2069. (21) Espeau, P.; White, J. W. J. Chem. Soc., Faraday Trans. 1997, 93 (17), 3197−3200.