SI: Decoupling the shape parameter to assess gold nanorod uptake
by mammalian cells
C. Kinnear,a,bL. Rodriguez-Lorenzo,aM. J. D. Clift,a,cB. Goris,dS. Bals,dB. Rothen-Rutishauser,aand A.
Petri-Finka,e
a.Adolphe Merkle Institute, University of Fribourg, Fribourg 1700, Switzerland.
b.Present address: School of Chemistry and Bio21 Institute, University of Melbourne, Victoria, Australia.
c.Present address: In Vitro Toxicology Group, Swansea University Medical School. Singleton Park Campus, Swansea, SA2 8PP, Wales, United
Kingdom
S2
Table of Contents
Figure S1 – Vis-NIR spectra of reshaped GNRs with excess PVP S3 Figure S2 – Vis-NIR spectra of reshaped GNRs with excess CTAB S4 Figure S3 – 1H-NMR of residual CTAB on GNR surface S5
Figure S4 – 1H-NMR of residual DMF on GNR surface S6
Figure S5 – 1H-NMR of residual sodium oleate on GNR surface S7
Table S1 – Quantity of residual CTAB and DMF on GNRs from 1H-NMR S7
Table S2 – Zeta-potential and hydrodynamic size of reshaped GNRs S8 Table S3 – Dimensions of reshaped GNRs from TEM S9 Figure S6 – GNR uptake normalized by cell number S10 Figure S7 – Biocompatibility assays of reshaped GNRs S11 Figure S8 – Exocytosis of reshaped GNRs from HeLa cells S12 Figure S9 – Quantification of gold in various exposure fractions S13 Figure S10 – Dark-field light microscopy of J774A.1cells after exposure to GNRs S14 Figure S11 – Dark-field light microscopy of spin-coated GNRs Magnified S15 Figure S12 – TEM of A549 cells after exposure to GNRs S16 Figure S13 – TEM of A549 cells after exposure to GNRs S17 Figure S14 – TEM of HeLa cells after exposure to GNRs S18 Figure S15 – Magnified TEM of HeLa cells after exposure to GNRs S19 Figure S16 – TEM of J774A.1 cells after exposure to GNRs S20 Figure S17 – Dose-dependent uptake of gold nanoparticles S21
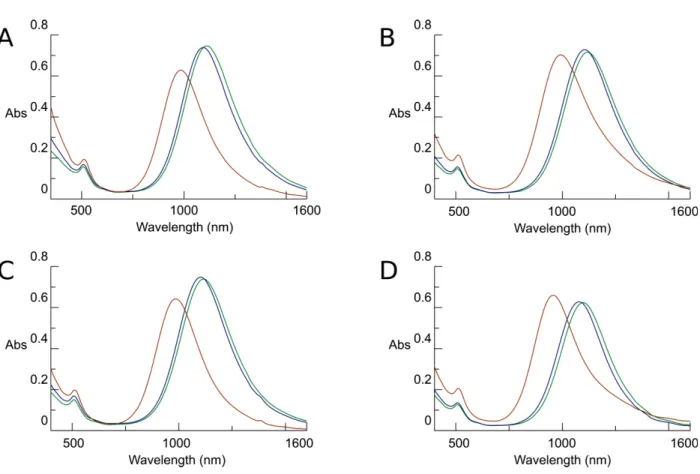
Fig. S1. Thermal reshaping at high PVP concentrations. Vis-NIR spectra of aliquots of
PVP coated GNRs dispersed in DMF, upon heating to 140 °C, at 10 min (green line), 20 min (blue line), and 60 min (red line). The concentration of PVP was held constant at 5 mM while the concentration of CTAB was varied: (A) 0.3 mM, (B) 0.8 mM, (C) 1.6 mM, and (D) 2.9 mM.
S4
Fig. S2. Thermal reshaping at low PVP concentrations. Vis-NIR spectra of aliquots of
PVP coated GNRs dispersed in DMF, upon heating to 140 °C, at 10 min (green line), 20 min (blue line), and 60 min (red line). The concentration of PVP was held constant at 1 mM while the concentration of CTAB was varied: (A) 0.3 mM, (B) 0.8 mM, (C) 1.6 mM, and (D) 2.9 mM.
Fig. S3. 1H NMR identifying surface adsorbed CTAB. 1H NMR of residual CTAB identified
through triplet at 0.89 ppm after dissolution of gold core by iodine in deuterated methanol (A) GNR-7.2, (B) GNR-4.8, (C) GNR-2.6, (D) GNR-1.9, and pure compound in deuterated methanol (E) CTAB (11.8 mM). The integrals are relative to the integral of the tetramethylsilane reference at 0 ppm normalized to 100.
S6
Fig. S4. 1H NMR identifying surface adsorbed DMF. 1H NMR of residual DMF identified
through singlet at 7.98 ppm after dissolution of gold core by iodine in deuterated methanol (A) GNR-7.2, (B) GNR-4.8, (C) GNR-2.6, (D) GNR-1.9, and pure compound in deuterated methanol (E) DMF (1.7 vol. %). The integrals are relative to the integral of the tetramethylsilane reference at 0 ppm normalized to 100.
Fig. S5. 1H NMR identifying surface adsorbed sodium oleate. 1H NMR of residual sodium
oleate after dissolution of gold core by iodine in deuterated methanol (red) GNR-7.2, (yellow) GNR-4.8, (green) GNR-2.6, (blue) GNR-1.9, and pure compound in deuterated methanol (purple) sodium oleate (57 mM). The scale of the four GNR samples has been increased by a factor of 10,000 relative to the sodium oleate control.
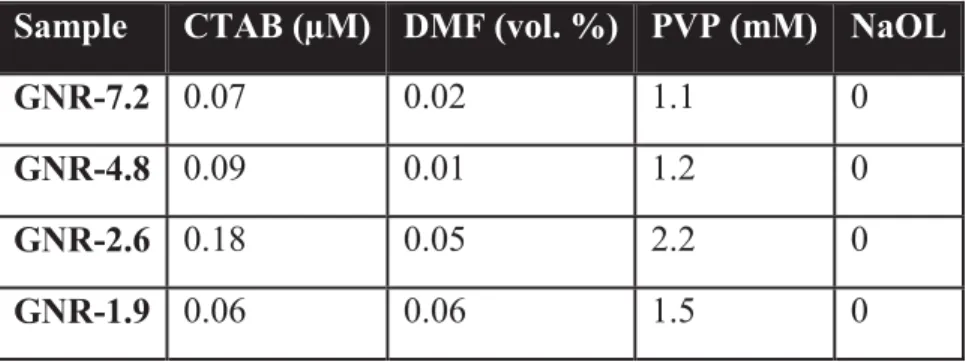
Table S1. Concentration of ligands. Summary of concentrations estimated via
semi-quantitative 1H NMR of reshaped and dissolved GNRs in deuterated methanol.
Sample CTAB (μM) DMF (vol. %) PVP (mM) NaOL
GNR-7.2 0.07 0.02 1.1 0
GNR-4.8 0.09 0.01 1.2 0
GNR-2.6 0.18 0.05 2.2 0
S8
Table S2. Characterization of GNRs. Zeta-potential of reshaped GNRs dispersed in 0.1x
PBS; the standard deviation is from three repeated measurements. The diffusion coefficient was measured by nanoparticle tracking analysis (NTA) and depolarized dynamic light scattering (DDLS) whereby a spherical hydrodynamical model was used to approximate the hydrodynamic radius (RH) of the nanorods from the measured
translational diffusion coefficients via the Stokes-Einstein relation.
Sample Zeta-potential (mV) RH (nm) from NTA RH (nm) from DDLS
GNR-7.2 -7.2 ± 2.6 38 ± 1 37
GNR-4.8 -5.7 ± 1.1 37 ± 1 35
GNR-2.6 -15.0 ± 1.4 34 ± 1 34
Table S3. Physical dimensions of reshaped GNRs from low resolution TEM. The length
and width of at least 450 nanoparticles were measured via TEM, with either a spherocylindrical or spherical model used to calculate the mean volume and surface area based on whether the nanoparticle was a rod or a sphere. The number concentration was measured via nanoparticle tracking analysis of diluted samples where the mass concentration was held constant across samples, as identified by ICP-OES. The detection threshold, within the proprietary Nanosight software, was left unchanged between samples enabling an approximate comparison.
Measurement GNR-7.2 GNR-4.8 GNR-2.6 GNR-1.9 Dimensions (nm) 113 × 16 84 × 18 62 × 24 55 × 29 Aspect Ratio 7.2 4.8 2.6 1.9 Volume (nm3) 22,800 ± 600 20,100 ± 530 22,400 ± 460 22,700 ± 440 Surface Area (nm2) 5,534 ± 210 4,629 ± 72 4,254 ± 69 3,952 ± 57 Shape Yield 90% 94% 81% 55% Concentration from nanoparticle tracking analysis (×108 GNR.mL-1) 6.69 ± 0.41 6.37 ± 0.40 7.35 ± 0.23 7.94 ± 0.30
S10
Fig. S6. Quantity of endocytosed gold nanorods per cell. Intracellular gold measured by
ICP-OES in cell lysate after iodine wash to remove extracellular GNRs, expressed relative to the number of cells seeded. Three different cell lines were incubated with PVP coated reshaped GNRs at 40 μg.mL-1 for either 4 h (A) or 24 h (B).
Fig. S7. Measurement of cytotoxicity and (pro-)inflammogenic potential of reshaped
S12 (100 ng.mL-1) as the positive control. (C) Amount of extracellular IL-8 relative to negative
control after 24 h exposure to the reshaped GNRs, with TNF-α (50 ng.mL-1) as the positive
control. Bars denote the mean ± SD, n=4. A two-way Tukey post-hoc ANOVA was performed and significance is indicated by: *p<0.05 against the negative control.
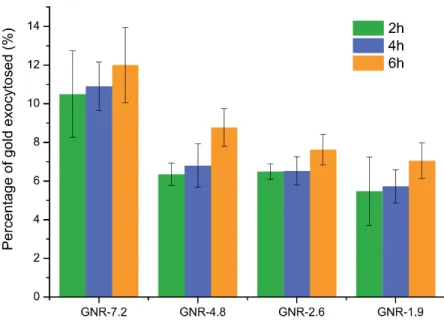
Fig. S8. Exocytosis of reshaped GNRs from HeLa cells. After an initial 24 h incubation
with the reshaped GNRs (40 μg.mL-1), the media was replaced with fresh supplemented
RPMI and the exocytosed gold quantified by ICP-OES after 2, 4, or 6 h. The extracellular gold is expressed relative to the measured intracellular gold with bars denoting the mean ± SD, n=3.
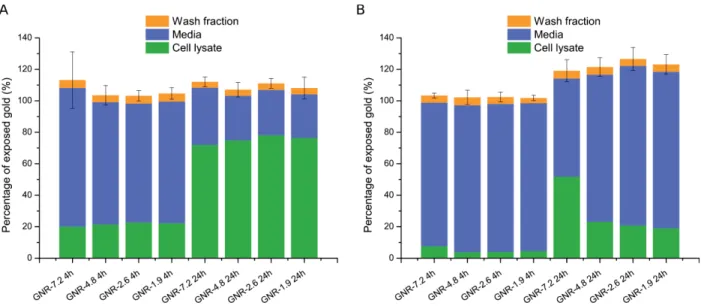
Fig. S9. Quantification of gold in different fractions. (A) J774A.1 cells and (B) HeLa cells
incubated with reshaped GNRs (40 μg.mL-1) for 4 h or 24 h. The cell lysate data is that of
Figure 4, media corresponds to the quantity of gold that was not endocytosed, and wash fraction corresponds to the PBS and iodine washes which remove extracellular surface-bound GNRs. The data is expressed relative to the exposed quantity of GNRs, with bars denoting the mean ± SD, n=4.
S14
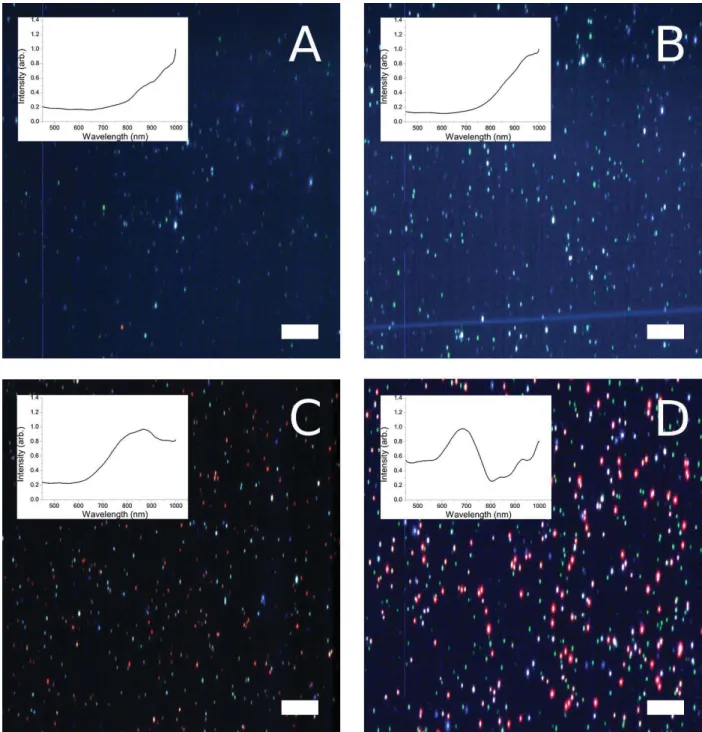
Fig. S10. Hyperspectral imaging combined with dark-field light microscopy of fixed and
embedded J774A.1 cells. Exposed concentration of reshaped GNRs was 40 μg.mL-1 for
Fig. S11. Hyperspectral imaging combined with dark-field light microscopy of spin-coated
GNRs. GNRs, 50 μL of 5 μg.mL-1, in ethanol were spin-coated onto a glass slide: (A)
Fig. S12. TEM of A549 cells with intracellular GNRs. Representative TEM micrographs
of embedded, stained, and sectioned A549 cells after incubation for 4 h with reshaped GNRs (40 μg.mL-1): (A-B) GNR-7.2, (C-D) GNR-4.8, (E-F) GNR-2.6, and (G-H) GNR-1.9.
The observed black lines in some of the images are artifacts caused by the cutting of two materials of different elasticity: the resin and the membrane.
Fig. S13. Magnified TEM of A549 cells with intracellular GNRs. TEM micrographs of
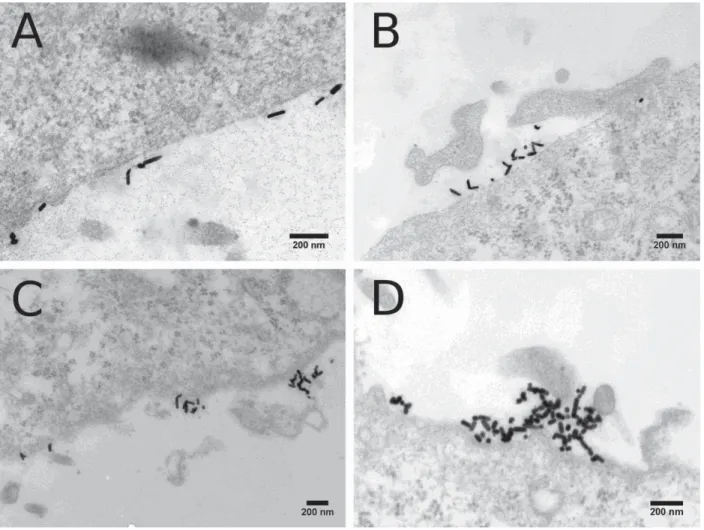
Fig. S14. TEM of HeLa cells with intracellular GNRs. Representative TEM micrographs
of embedded, stained, and sectioned HeLa cells after incubation for 4 h with reshaped GNRs (40 μg.mL-1): (A-B) GNR-7.2, (C-D) GNR-4.8, (E-F) GNR-2.6, and (G-H) GNR-1.9.
The observed black lines in some of the images are artifacts caused by the cutting of two materials of different elasticity: the resin and the membrane.
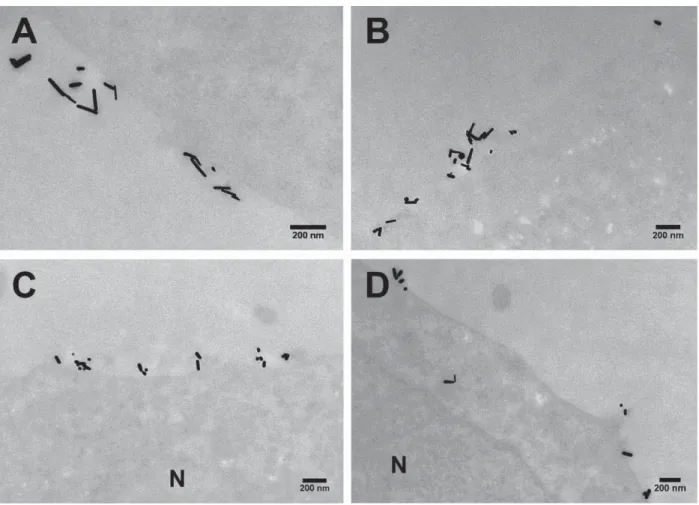
Fig. S15. Magnified TEM of HeLa cells with intracellular GNRs. TEM micrographs of
embedded, stained, and sectioned HeLa cells after incubation for 4 h with reshaped GNRs (40 μg.mL-1): (A) GNR-7.2, (B) GNR-4.8, (C) GNR-2.6, and (D) GNR-1.9.
S20
Fig. S16. TEM of J774A.1 cells with intracellular GNRs. Representative TEM micrographs
of embedded, stained, and sectioned J774A.1 cells after incubation for 4 h with reshaped GNRs (40 μg.mL-1): (A) GNR-7.2, (B) GNR-4.8, (C) GNR-2.6, and (D) GNR-1.9. The
observed black line in (A) is an artifact caused by the cutting of two materials of different elasticity: the resin and the membrane.
Fig. S17. Dose-response on uptake of reshaped gold nanostars. The reshaping protocol
described below was applied to gold nanostars, which were then exposed to J774A.1 cells at three different concentrations (10, 20, and 40 μg/mL) for 24 h.