Analysis and Optimization of Task
Granularity on the Java Virtual Machine
Doctoral Dissertation submitted to the
Faculty of Informatics of the Università della Svizzera Italiana in partial fulfillment of the requirements for the degree of
Doctor of Philosophy
presented by
Andrea Rosà
under the supervision of
Prof. Walter Binder
Dissertation Committee
Prof. Fernando Pedone Università della Svizzera italiana, Switzerland Prof. Robert Soulé Università della Svizzera italiana, Switzerland
Prof. Petr T˙uma Charles University, Czech Republic Prof. Giuseppe Serazzi Politecnico di Milano, Italy
Dissertation accepted on 2 August 2018
Research Advisor PhD Program Director Prof. Walter Binder Prof. Olaf Schenk
I certify that except where due acknowledgement has been given, the work presented in this thesis is that of the author alone; the work has not been submit-ted previously, in whole or in part, to qualify for any other academic award; and the content of the thesis is the result of work which has been carried out since the official commencement date of the approved research program.
Andrea Rosà
Lugano, 2 August 2018
To Eleonora
Abstract
Task granularity, i.e., the amount of work performed by parallel tasks, is a key performance attribute of parallel applications. On the one hand, fine-grained tasks (i.e., small tasks carrying out few computations) may introduce considerable parallelization overheads. On the other hand, coarse-grained tasks (i.e., large tasks performing substantial computations) may not fully utilize the available CPU cores, leading to missed parallelization opportunities.
We focus on task-parallel applications running in a single Java Virtual Machine on a shared-memory multicore. Despite their performance may considerably depend on the granularity of their tasks, this topic has received little attention in the literature. Our work fills this gap, analyzing and optimizing the task granularity of such applications.
In this dissertation, we present a new methodology to accurately and efficiently collect the granularity of each executed task, implemented in a novel profiler. Our profiler collects carefully selected metrics from the whole system stack with low overhead. Our tool helps developers locate performance and scalability problems, and identifies classes and methods where optimizations related to task granularity are needed, guiding developers towards useful optimizations.
Moreover, we introduce a novel technique to drastically reduce the overhead of task-granularity profiling, by reifying the class hierarchy of the target application within a separate instrumentation process. Our approach allows the instrumen-tation process to instrument only the classes representing tasks, inserting more efficient instrumentation code which decreases the overhead of task detection. Our technique significantly speeds up task-granularity profiling and so enables the collection of accurate metrics with low overhead.
We use our novel techniques to analyze task granularity in the DaCapo, Scala-Bench, and Spark Perf benchmark suites. We reveal inefficiencies related to fine-grained and coarse-grained tasks in several workloads. We demonstrate that the collected task-granularity profiles are actionable by optimizing task granularity in numerous benchmarks, performing optimizations in classes and methods indicated by our tool. Our optimizations result in significant speedups
vi
(up to a factor of 5.90×) in numerous workloads suffering from fine- and coarse-grained tasks in different environments. Our results highlight the importance of analyzing and optimizing task granularity on the Java Virtual Machine.
Acknowledgements
First of all, I would like to thank my research advisor Prof. Walter Binder for providing me with the opportunity to pursue my PhD in his group. I thank Walter for his guidance through the doctoral studies and his support towards the achievements described in this dissertation. I am also grateful to Dr. Lydia Y. Chen, who supported by work during the first years of my doctoral studies.
I would like to thank the members of the dissertation committee, including Prof. Petr T˙uma, Prof. Giuseppe Serazzi, Prof. Fernando Pedone and Prof. Robert Soulé for their valuable comments that improved this dissertation.
I am grateful to the students who contributed to this research and related topics, in particular Eduardo Rosales, Haiyang Sun, and Samuele Decarli.
I am thankful to all the past and present members of the Dynamic Analysis Group, with whom I had a pleasure to work at Università della Svizzera italiana. In particular, I would like to express my gratitude to Prof. Lubomír Bulej, Prof. Alex Villazon and Dr. Yudi Zheng for their support and the inspiring and critical discussions. I also want to thank Sebastiano Spicuglia, whose support has been fundamental many times at the very beginning of my doctoral studies.
Special thanks go to Elisa and Janine of the faculty’s Dean Office for their constant administrative support and help.
Finally, I would like to thank Eleonora and my family for their support during my doctoral studies.
This work has been funded by the Swiss National Science Foundation (project 200021_141002), by the EU commission (contract ACP2-GA-2013-605442) and by Oracle (ERO project 1332).
Contents
Contents ix
1 Introduction 1
1.1 Motivation . . . 1
1.2 Goals and Challenges . . . 3
1.3 Contributions . . . 3
1.3.1 Task-Granularity Profiling . . . 4
1.3.2 Reification of Complete Supertype Information . . . 4
1.3.3 Task-Granularity Analysis and Optimization . . . 5
1.4 Dissertation Outline . . . 6
1.5 Publications . . . 6
2 State-of-the-Art 9 2.1 Task Granularity . . . 9
2.1.1 Estimating Task Granularity . . . 9
2.1.2 Adapting Task Granularity . . . 11
2.1.3 Profiling Task Granularity . . . 14
2.2 Work-Span Model . . . 14
2.3 Analyses of Parallel Applications . . . 15
2.4 Profilers for Parallel Applications . . . 18
2.5 Reification of Supertype Information . . . 21
3 Task-Granularity Profiling 25 3.1 Background . . . 25
3.1.1 JVMTI and JNI . . . 25
3.1.2 DiSL and Shadow VM . . . 26
3.2 Task Model . . . 27
3.2.1 Tasks . . . 27
3.2.2 Task Granularity . . . 28
3.2.3 Task Submission . . . 28
x Contents
3.2.4 Task Aggregation . . . 28
3.2.5 Multiple Task Executions . . . 29
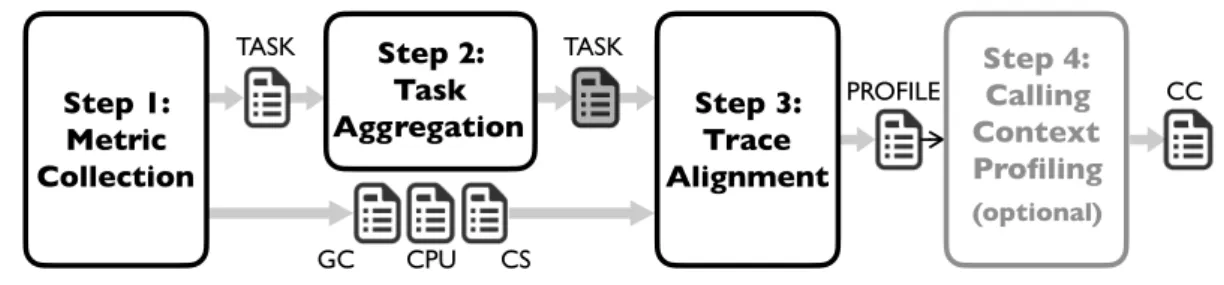
3.3 Metrics . . . 29 3.4 Profiling Methodology . . . 31 3.4.1 Metric Collection . . . 31 3.4.2 Task Aggregation . . . 33 3.4.3 Trace Alignment . . . 33 3.4.4 Calling-Context Profiling . . . 33 3.5 Instrumentation . . . 34 3.5.1 Data Structures . . . 34
3.5.2 Challenges in Task-Granularity Profiling . . . 37
3.5.3 Instrumentation for Task-Granularity Profiling . . . 38
3.6 Implementation . . . 41
3.6.1 Efficient Shadow Stacks . . . 42
3.6.2 Task-Granularity Profiling . . . 44 3.6.3 Task-Submission Profiling . . . 46 3.6.4 Calling-Context Profiling . . . 46 3.7 Discussion . . . 46 3.7.1 Excluded Metrics . . . 46 3.7.2 Limitations . . . 47 3.8 Summary . . . 48
4 Reification of Complete Supertype Information 51 4.1 Background . . . 52
4.1.1 Classloaders . . . 52
4.1.2 Reflective Information . . . 53
4.2 Motivation . . . 54
4.2.1 Compile-time Instrumentation . . . 55
4.2.2 Load-time In-process Instrumentation . . . 56
4.2.3 Load-time Out-of-process Instrumentation . . . 57
4.2.4 Classloader Namespaces . . . 58
4.2.5 Our Solution . . . 59
4.3 The DiSL Reflection API . . . 60
4.4 Implementation . . . 62
4.4.1 Forced Loading of Supertypes . . . 64
4.4.2 Classloader Namespaces . . . 67
4.4.3 Preprocessing Java Core Classes . . . 69
4.5 Efficient Task-Granularity Profiling . . . 71
xi Contents
4.6.1 Methodology and Setup . . . 73
4.6.2 Profiling Overhead and Speedup . . . 77
4.6.3 Perturbation . . . 79
4.7 Discussion . . . 84
4.7.1 Reclamation of Classloader Namespaces . . . 84
4.7.2 Preprocessing Classes Outsidejava.* . . . 84
4.7.3 Instrumentation State . . . 85
4.7.4 Checking Classloader IDs . . . 85
4.7.5 Limitations . . . 85
4.8 Summary . . . 86
5 Task-Granularity Analysis and Optimization 89 5.1 Analysis . . . 89 5.1.1 Methodology . . . 89 5.1.2 Fine-Grained Tasks . . . 90 5.1.3 Coarse-Grained Tasks . . . 97 5.2 Optimization . . . 102 5.2.1 pmd . . . 102 5.2.2 lusearch . . . 104
5.2.3 Spark Perf Benchmarks . . . 105
5.2.4 Evaluation . . . 107
5.3 Discussion . . . 113
5.3.1 Platform-dependent Results . . . 113
5.3.2 Optimization of DaCapo and ScalaBench . . . 114
5.3.3 CPU Utilization . . . 114 5.4 Summary . . . 114 6 Conclusion 117 6.1 Summary of Contributions . . . 117 6.2 Future Work . . . 119 Bibliography 123 Index 137
Chapter 1
Introduction
In this chapter, we introduce the work presented in this dissertation. Section 1.1 motivates the need for analyzing and optimizing task granularity on the Java Virtual Machine (JVM). Section 1.2 discusses our goals and the related challenges. Section 1.3 presents an overview on the contributions made by our work. Sec-tion 1.4 outlines the structure of the dissertaSec-tion. Finally, SecSec-tion 1.5 lists the scientific publications supporting the work here presented.
1.1
Motivation
Due to technological limitations complicating further advances in single comput-ing cores (such as the clock rate and the amount of exploitable instruction-level parallelism), nowadays processors offer an increasing number of cores. While modern multicore machines provide extensive opportunities to speed up work-loads, developing or tuning a parallel application to make good use of all cores remains challenging.
A popular way to speed up application execution in multicore machines is
task parallelism, i.e., dividing the computation to be performed into units of work called tasks, executing each task in parallel across different computing cores. Tasks can execute either the same or different code on the same or different data, and are run by different threads in parallel. This work focuses on
task-parallel1 applications running on a single JVM in a shared-memory multicore. Task parallelism is implemented in many applications running on the JVM, and is eased by the presence of dedicated frameworks, such as e.g. thread pools [105] and fork-join pools[104], which significantly lower the programming effort for
1We denote as task-parallel any application resorting to task parallelism.
2 1.1 Motivation
exploiting task parallelism. As a result, task-parallel applications are widespread nowadays.
A key performance attribute of task-parallel applications is their task
gran-ularity, i.e., the amount of work performed by each spawned task [72]. Task granularity relates to the tradeoff between the overhead of a parallel task execu-tion and the potential performance gain. If the overall computaexecu-tion is divided into many fine-grained tasks (i.e., small tasks carrying out few computations), the application can better utilize the available CPU cores, as there are more tasks that can be distributed among the computing resources. Unfortunately, this solution may lead to considerable parallelization overheads, due to the cost of creating and scheduling a large number of tasks and the substantial synchronization and communication that may be involved between them. Such overheads may be mitigated by dividing the work into few coarse-grained tasks (i.e., large tasks performing substantial computations). However, this solution may miss some parallelization opportunities, as CPU cores may be underutilized due to the lack of tasks to be executed or due to an unbalanced division of work to tasks.
The performance of task-parallel applications may considerably depend on the granularity of their tasks. Hence, understanding task granularity is crucial to assess and improve the performance of task-parallel applications. Despite this fact, the analysis and optimization of the task granularity for applications running on the JVM has received little attention in the literature.
While several researchers have proposed techniques to estimate or control task granularity in task-parallel applications, such techniques present multiple limitations (such as lack of accuracy[90; 31] or limited applicability [1; 141; 89]), may rely on asymptotic complexity functions that can be difficult to compute or provide[1; 80], or may need custom systems [22; 144; 76; 83]. Moreover, they fall short in highlighting and optimizing performance drawbacks caused by coarse-grained tasks. Finally, only few of them support the JVM [90; 150].
On the other hand, despite the presence of studies [48; 122; 146] based on the work-span model2 [62; 23] to find the maximum speedup theoretically obtainable for an application by optimizing the longest sequential tasks, such studies focus mainly on the analysis and optimization of large sequential portions of workloads, overlooking the overhead caused by fine-grained tasks. Finally, while numerous authors provide detailed studies on parallel applications running on the JVM [29; 19; 67] or propose profiling tools for different performance
2The work-span model computes the maximum theoretical speedup of a parallel application
by dividing its work (i.e., the time a sequential execution would take to complete all tasks) by its span (i.e., the length of the longest chain of tasks that must be executed sequentially). More information on the model is given in Section 2.2.
3 1.2 Goals and Challenges
attributes[26; 127; 18; 57], none of them focuses on task granularity. As a result, task granularity and its performance impact on task-parallel applications running on the JVM remain largely unexplored yet crucial topics.
1.2
Goals and Challenges
The goal of our work is analyzing and optimizing the task granularity of parallel applications running on a single JVM in a shared-memory multicore. In particular, we aim at 1) characterizing the task granularity of task-parallel applications, 2) analyzing the impact of task granularity on the application performance, 3) lo-cating workloads where suboptimal task granularity causes negative effects on application performance, and 4) optimizing task granularity in such workloads, ultimately enabling significant speedups.
Our work faces notable challenges. Task-parallel applications may use tasks in complex ways. For example, applications may employ nested tasks (i.e., tasks fully executing in the dynamic extent of another task’s execution), may use recursion within tasks, or may execute a single task multiple times. While such practices may be motivated by design principles or code reuse, they significantly complicate task-granularity profiling, and may lead to incorrect measurements of task granularity if not handled correctly. Our work identifies patterns where special care is needed, and employs efficient instrumentation that guarantees correct and accurate task-granularity profiling.
Moreover, the metrics considered by our study may be susceptible to pertur-bations caused by the inserted instrumentation code. In particular, such perturba-tions may alter the collected values of task granularity, thus biasing our results. While being of paramount importance, minimizing measurement perturbation is challenging. Our work takes several measures to keep perturbations low, in-cluding efficient and accurate profiling techniques, instrumentation and data structures to increase the accuracy of the collected task-granularity profiles.
1.3
Contributions
To enable our goal of analyzing and optimizing the task granularity of task-parallel applications running on a single JVM, this dissertation makes the following contributions.
4 1.3 Contributions
1.3.1
Task-Granularity Profiling
We develop a new methodology for profiling the task granularity of applications running on the JVM. The goals of our methodology are to collect metrics charac-terizing task granularity, to pinpoint the impact of task granularity on application performance, to help developers locate performance and scalability problems, and to guide them towards effective optimizations.
We implement our profiling technique in tgp, a new task-granularity profiler for the JVM. Our profiler is built upon the DiSL[82] Java bytecode instrumentation framework, which ensures the detection of all spawned tasks, including those in the Java class library (which is notoriously hard to instrument [13; 69]).3 Our tool enables an accurate collection of task-granularity profiles even for tasks showing complex patterns, such as nested tasks, tasks executed multiple times, and tasks with recursive operations.
To enable a detailed and accurate analysis of task granularity, tgp resorts to
vertical profiling[47],4 collecting a carefully selected set of metrics from the whole system stack, aligning them via offline analysis. Moreover, thanks to calling-context
profiling[5],5tgp identifies classes and methods where optimizations related to task granularity are needed, guiding developers towards useful optimizations through actionable profiles[88].6 Our technique resorts to a novel and efficient profiling methodology, instrumentation and data structures to collect accurate task-granularity profiles with low profiling overhead. Overall, our tool helps developers locate performance and scalability problems related to task granularity. To the best of our knowledge, tgp is the first task-granularity profiler for the JVM.
1.3.2
Reification of Complete Supertype Information
We introduce a novel approach to decrease the overhead of task detection as well as the perturbation of the collected task-granularity profiles. Our technique accurately reifies the class hierarchy of an instrumented application within a sep-arate instrumentation process, such that complete reflective supertype information
3The Java class library is the set of core classes offered by the Java platform, which can be
used by every application running on a JVM.
4According to Hauswirth et al.[47], vertical profiling is an approach that collects and correlates
information about system behavior from different system layers. Our work correlates metrics from the following layers: application, framework, virtual machine, operating system and hardware.
5A calling context is the set of all methods open on the call stack at a specified point during the
execution of a thread.
6According to Mytkowicz et al.[88], profiles are actionable if acting on the classes and methods
5 1.3 Contributions
(RSI), i.e., information about all direct and indirect supertypes of the class under instrumentation, is available for each class to be instrumented. This information is usually not available in frameworks performing bytecode instrumentation in a separate process, causing the framework to instrument many more classes than those falling in the scope of the analysis and to insert expensive runtime checks into the instrumentation code, which introduce additional runtime overhead and increase the perturbation of the measurements performed.
Our technique enables the instrumentation process to instrument only the classes that are relevant for the analysis, inserting more efficient instrumentation code which in turns decreases the overhead of task detection as well as the perturbations of the collected metrics. Moreover, our technique exposes classloader
namespaces7 (usually unavailable) to the instrumentation process, allowing the instrumentation framework to deal correctly with homonym classes defined by different classloaders.
Our approach results in a new API—the DiSL Reflection API—included in an extension of the DiSL framework. Evaluation results show that the API leads to significant speedups (up to a factor of 6.24×) when profiling task-granularity with tgp, enabling the collection of task-granularity profiles with low overhead. While we use the API primarily for optimizing tgp, the API is beneficial also for other type-specific analyses (i.e., those targeting objects of specific types) on the JVM.
1.3.3
Task-Granularity Analysis and Optimization
We analyze task granularity in two well-known Java benchmark suites, Da-Capo[15] and ScalaBench [123], as well as in several applications from Spark Perf[25], a benchmark suite for the popular Apache Spark [149] big-data ana-lytics framework. To the best of our knowledge, we provide the first analysis of task granularity for task-parallel applications on the JVM. Moreover, we reveal performance issues of the target applications that were previously unknown.
Our analysis shows that several applications either employ a small number of coarse-grained tasks that underutilize CPU and result in idle cores, or a large number of fine-grained tasks suffering from noticeable contention, which leads to significant parallelization overheads. We identify coarse-grained tasks that can be split into several smaller ones to better leverage idle CPU cores, as well as fine-grained tasks that can be merged to reduce parallelization overheads.
7The namespace of a classloader is the set of all classes loaded by the classloader. More
6 1.4 Dissertation Outline
We use the actionable profiles collected by tgp to guide the optimization of task granularity in numerous workloads. We collect and analyze the calling con-texts upon the creation and submission of tasks causing performance drawbacks, locating classes and methods to modify to perform optimizations related to task granularity. Our optimizations result in significant speedups (up to a factor of 5.90×) in several applications suffering from coarse- and fine-grained tasks.
1.4
Dissertation Outline
This dissertation is structured as follows:
• Chapter 2 discusses the state-of-the-art in the domain of this dissertation, i.e., task granularity, work-span model, analysis of parallel applications, parallel profilers, as well as reification of reflective information.
• Chapter 3 describes our approach to profile task granularity on the JVM. The chapter presents the metrics collected, our methodology to obtain accurate task-granularity profiles, as well as the instrumentation logic employed and its implementation in tgp.
• Chapter 4 details our technique for reifying complete supertype information in a separate instrumentation process, its implementation in DiSL, and the DiSL Reflection API. In addition, the chapter shows how our technique can lower profiling overhead and measurement perturbation for task-granularity profiling with tgp.
• Chapter 5 describes our task-granularity analysis on the DaCapo, Scal-aBench, and Spark Perf benchmarks, details our optimizations related to task granularity, and discusses the achieved speedups.
• Chapter 6 concludes the dissertation and outlines future research directions inspired by this work.
1.5
Publications
This dissertation is based on the following conference papers. The work on task-granularity profiling, analysis, and optimization (Chapters 3 and 5) has been published at GPCE’16 and CGO’18:
7 1.5 Publications
• Andrea Rosà, Lydia Y. Chen, and Walter Binder. Actor Profiling in Virtual Execution Environments. In Proceedings of 15th ACM SIGPLAN
Interna-tional Conference on Generative Programming: Concepts and Experiences (GPCE), pp. 36–46. 2016. Amsterdam, The Netherlands. ACM. DOI: 10.1145/2993236.2993241.
• Andrea Rosà, Eduardo Rosales, and Walter Binder. Analyzing and Opti-mizing Task Granularity on the JVM. In Proceedings of the 2018 IEEE/ACM
International Symposium on Code Generation and Optimization (CGO), pp. 27–37. Vienna, Austria. ACM. DOI: 10.1145/3168828.
The work on reification of complete supertype information (Chapter 4) has been published at GPCE’17:
• Andrea Rosà, Eduardo Rosales, and Walter Binder. Accurate Reification of Complete Supertype Information for Dynamic Analysis on the JVM. In
Proceedings of 16th ACM SIGPLAN International Conference on Generative Programming: Concepts and Experiences (GPCE), pp. 104–116. 2017. Van-couver, Canada. ACM. DOI: 10.1145/3136040.3136061.
Chapter 2
State-of-the-Art
This chapter describes the state-of-the-art in the domain of the dissertation, i.e., analysis and optimization of task granularity for task-parallel applications running in shared-memory multicores. The chapter is organized as follows. Section 2.1 presents work related to task granularity. Section 2.2 describes research efforts based on the work-span model. Section 2.3 reviews analyses of parallel workloads. Section 2.4 describes existing profilers for parallel applications. Finally, Section 2.5 details related frameworks that reify reflective supertype information during instrumentation.
2.1
Task Granularity
Task granularity has been studied in different domains (such as many-cores[107; 42; 4], grids [63; 86; 125; 87], cloud-based systems [20; 110] and reconfigurable architectures [9]) and for different kinds of workloads (especially distributed applications[37; 43; 109; 145]). In this section, we present related approaches for estimating (Section 2.1.1), adapting (Section 2.1.2), and profiling (Section 2.1.3) task granularity in applications in the scope of the dissertation, i.e., task-parallel applications running in shared-memory multicores.
2.1.1
Estimating Task Granularity
Several authors focus on estimating the granularity of parallel tasks before they are spawned at runtime. The main motivation for estimating task granularity is to predict whether a task would execute significant work before actually creating it. The estimations can be used by an underlying framework to avoid spawning a
10 2.1 Task Granularity
task predicted as very fine-grained (i.e., if the overhead of creating and scheduling the task is higher than the expected benefits of executing work in parallel).
Acar et al. [1] propose oracle scheduling. This technique is based on an
oraclethat estimates the granularity of each task declared by developers. Oracle scheduling requires users to provide the asymptotic complexity of each function. The technique resorts to profiling information to increase the accuracy of the estimations. Unfortunately, programs without an easily derivable asymptotic complexity are less likely to benefit from oracle scheduling, as accurate complexity functions are fundamental to apply this technique. On the other hand, our analysis does not rely on asymptotic complexity functions, and thus can better benefit complex or large applications.
Lopez et al.[80] describe a static method to estimate task granularity. Their approach computes cost functions and performs static program transformations accordingly, such that the transformed program automatically controls granularity. Their work resorts to static analysis to derive asymptotic cost functions, which may be hard to compute with high accuracy in large or complex programs. Similar to oracle scheduling, this technique may yield poor results for real-world workloads, differently from our work (that does not require any cost function).
Huelsbergen et al.[51] present Dynamic Granularity Estimation, a technique to estimate task granularity by examining the runtime size of data structures. Their approach relies on a framework composed of a compile-time and a run-time component. The compile-time component identifies the parallel functions whose execution time depends on the size of the associated data structures. The dynamic component approximates the size of the data structures, thus estimating function execution times, and eventually task granularity. Another approach by Zoppetti et al.[152] estimates task granularity to generate threads executing large enough tasks, such that the context switching cost is relatively small compared to the cost of performing the actual computation.
A common limitation of the above techniques is that they fall short in pinpoint-ing missed parallelization opportunities related to coarse-grained tasks, as they mainly focus on avoiding the overhead of creating and scheduling fine-grained tasks. In contrast, our work enables one to identify and optimize performance drawbacks of both fine- and coarse-grained tasks.
Moreover, they mainly target implicitly parallel languages, i.e., languages that allow developers to specify parallelism through tasks, but defer the decision whether a new task is spawned to the runtime framework. Examples of such languages are Cilk[40], Manticore [39], Multilisp [45], X10 [55], Chapel [24] and Jade[116]. Other languages (including JVM languages) may not benefit from the above techniques. On the other hand, our work focuses on task-parallel
11 2.1 Task Granularity
workloads running on the JVM, where parallelism can be declared explicitly (i.e., every task specified by developers is executed at runtime).
2.1.2
Adapting Task Granularity
Several authors aim at finding an optimal level of task granularity, and propose techniques to adapt the granularity of a task to the optimal value.
Thoman et al.[141] present an approach that enables automatic granularity control for recursive OpenMP[92] applications. A compiler generates multiple versions of a task, each with increasing granularity obtained through task unrolling. Superfluous synchronization primitives are removed in each version. At runtime, a framework selects the version to execute according to the size of the task queues. Cong et al.[22] propose the X10 Work Stealing framework (XWS), an open-source runtime for the X10 parallel programming language. XWS extends the Cilk work-stealing framework with several features to improve the execution of graph-based algorithms, including a strategy to adaptively control the granularity of parallel tasks in the work-stealing scheme, depending on the instantaneous size of the work queues. Lifflander et al.[76] present an approach to dynamically merge tasks in fork-join work-stealing-based Cilk programs. The authors show that their approach improves spatial locality and sequential overheads by combining many fine-grained tasks into coarser tasks while ensuring sufficient concurrency for a locality-optimized load balance.
While the above techniques enable automatic task-granularity adaptation, they can mainly benefit recursive divide-and-conquer [23] applications. Other kinds of applications are less suited to dynamic task-granularity control. On the other hand, our focus is not limited to recursive divide-and-conquer applications. Our work highlights inefficiencies and provides optimizations related to task granularity in a large variety of applications, including those where the above techniques would yield poor results or cannot be applied.
An alternative approach to adapt task granularities at runtime is lazy task
creation. This technique allows developers to express fine-grained parallelism. Lazy task creation works best with fork-join tasks. At runtime, when a new task should be forked, the runtime system decides whether to spawn and execute the task in parallel or to inline it in the caller (i.e., execute it in the context of the caller). The latter operation has the effect to increase the granularity of the caller task. The original implementation by Mohr et al.[83] spawns a new task only if computing resources become idle.
Several other techniques are based on lazy task creation. Noll et al. [90] present a methodology to estimate the optimal parallel task granularity at runtime
12 2.1 Task Granularity
on the JVM. Their approach is based on the notion of concurrent calls, special language constructs that defer the decision of whether executing concurrent calls sequentially or concurrently as parallel tasks to the runtime framework, which can merge two (or more) concurrent calls, hence coarsening task granularity. Zhao et al. [150] present a similar framework for Habanero-Java [17], which is based on static analysis. An alternative implementation for OmpSs[10] (an extension of OpenMP) is provided by Navarro et al.[89], which propose heuristics that, combined with the profiling of execution metrics, provide information to the runtime system to decide when it is worth to instantiate a task.
Lazy task creation is less effective in applications that do not make use of fork-join tasks. On the other hand, our work benefits fork-fork-join tasks as well as other kinds of construct (such as thread pools or custom task execution frameworks) that may not benefit from lazy task creation. Moreover, most of the above techniques rely on profiling to refine their runtime decisions, which may introduce significant runtime overhead[90], thus decreasing the benefits of task-granularity adaptation. On the contrary, the profiling overhead caused by tgp is very low in most of the analyzed applications. In addition, optimized applications resulting from our approach do not need to be profiled again to monitor task granularity, in contrast to the aforementioned techniques that require continuous profiling to enable task-granularity adaptation.
Another approach to avoid the overhead of creating fine-grained tasks is to determine the minimum task granularity that makes parallel task execution worthwhile, i.e., the cut-off. Several authors have proposed different solutions to determine the cut-off and manage finer task granularities. Duran et al.[31] propose an adaptive cut-off technique for OpenMP. Their approach is based on profiling information collected at runtime to discover the granularity of the tasks created by the application. Tasks whose granularity is lower than the cut-off are pruned from the target application to reduce creation and scheduling overhead. A similar approach is proposed by Iwasaki et al. [61] and implemented as an optimization pass in LLVM[74], while Bi et al. [11] present a similar technique for Function Flow[36]. These techniques base their decisions on collected metrics that can be significantly perturbed, decreasing the accuracy of the proposed approaches. While also our analysis is based on metrics that can be biased, we resort to accurate and efficient profiling techniques, instrumentation and data structures that help reducing measurement perturbation, differently from the above work.
Wang et al.[144] propose AdaptiveTC, an adaptive task-creation strategy for work-stealing schedulers. AdaptiveTC can create three kinds of tasks. A task is a regular task that is added to a task queue, and is responsible for keeping idle
13 2.1 Task Granularity
threads busy. Tasks can be stolen by idle threads. A fake task is a plain recursive function that is never added to any task queue. Fake tasks are responsible for improving performance. Finally, a special task is added to a task queue to indicate a transition from a fake task to a task. AdaptiveTC adaptively switches between tasks and fake tasks to achieve better load balancing and performance. The framework manages task creation so as to keep all threads busy most of the time, to reduce the number of tasks spawned, and to optimize task granularity.
A limitation of the above technique is that it requires the introduction of custom constructs in the source code and executes an application on a modified runtime system, which may be impractical for some programs. Other approaches previously presented[22; 90; 150; 89; 144; 76; 83; 31; 141] suffer from the same limitation. In contrast, our analysis targets unmodified workloads (as distributed by the developers) in execution on standard JVMs. Our work requires neither the addition of custom constructs nor the use of a modified runtime.
Opsommer [93] proposes a static technique to adjust task granularity ac-cording to a metric called attraction. This metric is defined between two tasks and is proportional to the benefit of aggregating them into a coarser task. This methodology combines only tasks with an attraction value higher than a certain threshold. In turn, the threshold is based on task size, amount of communication involved, and number of forks and joins. This work is based on static analysis, which may lead to a poor accuracy in estimating the threshold. On the other hand, our work resorts to dynamic analysis in conjunction to an efficient profiling technique to measure the granularity of the spawned tasks with higher accuracy.
Ansaloni et al. [6] propose deferred methods, a methodology to speed up dynamic analyses on multicores. Deferred methods postpone the invocation of analysis methods (often representing fine-grained tasks), aggregating them in thread-local buffers. When a buffer is full, all the tasks in the buffer are merged into a single coarser-grained task executed on an idle core, leading to a lower communication overhead. A similar methodology, called buffered advice [7],1 target applications based on the aspect-oriented programming model[71]. Un-fortunately, such techniques are ineffective for analysis methods or advice that must execute synchronously.
Finally, similarly to approaches for estimating task granularity (Section 2.1.1), the aforementioned techniques shed no light on the performance drawbacks of coarse-grained tasks, differently from our work.
1According to the terminology used in aspect-oriented programming (AOP)[71], an advice is a
piece of code to be executed whenever a specified point in the execution of a program (called join
14 2.2 Work-Span Model
2.1.3
Profiling Task Granularity
Profiling task granularity is fundamental to investigate related performance draw-backs. Some of the aforementioned techniques[90; 89; 31] profile task granularity as part of their adaptive strategies. Unfortunately, the resulting profiles are not made available to the user, and cannot be used to conduct further analysis of task granularity.
To the best of our knowledge, there are only two profilers for task granular-ity, apart from ours. Hammond et al. [46] describe a set of graphical tools to help analyze task granularity in terms of a temporal profile correlating thread execution with time. More recently, Muddukrishna et al. [85] develop grain
graphs, a performance analysis tool that visualizes the granularity of OpenMP tasks, highlighting drawbacks such as low parallelism, work inflation and poor parallelization benefits.
Unfortunately, the above tools collect only a limited set of metrics that does not allow one to fully understand the impact of task granularity on application performance. On the other hand, our profiler collects comprehensive metrics from the whole system stack simultaneously, which aid performance analysts to correlate task granularity with its impact on application performance at multiple layers (i.e., application, framework, JVM, operating system, and hardware), allowing more detailed task-granularity analyses.
Moreover, our profiler incurs only little profiling overhead and provides ac-tionable profiles, which are used to optimize task granularity in several real-world applications, unlike the work of Hammond et al. Finally, grain graphs are better suited for recursive fork-join applications, while tgp targets any task-parallel application running on the JVM in shared-memory multicores.
2.2
Work-Span Model
The work-span model[62; 23] is a way to characterize task execution in a parallel application. The model can be used to determine the maximum theoretical speedup of a parallel application wrt. a sequential execution. The model compares two quantities: the work, i.e., the time a sequential execution would take to complete all tasks, and the span, i.e., the time a parallel execution would take on an infinite number of processors. The span is also equal to the time to execute the critical path, i.e., the longest chain of tasks that must be executed sequentially, which the model considers the main factor limiting speedup. The maximum theoretical speedup is given by the ratio of the work to the span.
15 2.3 Analyses of Parallel Applications
Several authors rely on the work-span model to locate the critical path of an application, focusing their optimization effort on it. He et al. propose the Cilkview scalability analyzer[48]. Cilkview analyzes the logical dependencies within an application to determine its work and span, allowing one to estimate the maximum speedup and predict how the application will scale with an increasing number of computing cores. Schardl et al. present Cilkprof[122], an extension of Cilkview that collects the work and span for each call site of the application, to assess how much each call site contributes to the overall work and span, enabling developers to quickly diagnose scalability bottlenecks. A main limitation of Cilkprof is that it runs the profiled application sequentially, resulting in significant slowdown wrt. a parallel execution of the original application. Both Cilkview and Cilkprof can only benefit Cilk applications. Yoga et al. propose TaskProf[146], a profiler that identifies parallelism bottlenecks and estimates possible parallelism improvements by computing work and span in task-parallel applications. TaskProf only supports C++ applications using the Intel Threading Building Blocks (TBB) [115] task-parallel library.
Differently from Cilkview, our profiler does not aim at computing the expected speedup of the whole program; instead, it aims at locating suboptimal task granularities. In contrast to both Cilkprof and TaskProf, our profiler requires neither compiler support nor library modification. Moreover, the overhead of tgp is significantly lower than the one reported by the authors of all three tools, allowing the collection of more accurate metrics with less perturbation. Finally, none of these tools support the JVM.
Overall, the above work detects bottlenecks and predicts speedups by mainly focusing on the longest tasks of an application (i.e., coarse-grained tasks), paying little attention to the possible performance drawbacks caused by short tasks (i.e., fine-grained tasks). In contrast, our work focuses on both coarse-grained and fine-grained tasks, enabling the detection of performance problems caused by a too fine-grained task parallelism.
2.3
Analyses of Parallel Applications
Several researchers have conducted analyses to shed light on the parallel behavior of an application. While they focus on different aspects of parallel workloads, we are not aware of any detailed analysis on the granularity of tasks in task-parallel applications running in shared-memory multicores. In the following text, we present some major analyses on parallel workloads.
16 2.3 Analyses of Parallel Applications
Dufour et al. [29] propose dynamic and platform-independent metrics to describe the runtime behavior on an application running on the JVM in five areas: size and control structure, data structures, polymorphism, memory use, and concurrency and synchronization. Apart for understanding program behav-ior, they use the profiled metrics to guide and evaluate compiler optimizations. Unfortunately, task granularity is not among the considered metrics. They also present *J[30], a profiling tool enabling the collection of the proposed metrics. Unfortunately, *J introduces excessive runtime overhead and is hardly applicable to complex workloads, unlike tgp.
Kalibera et al.[67] present several platform-independent concurrency-related metrics to enable a black-box understanding on the parallel behavior of Java applications. With the proposed metrics, they conduct an observational study of parallel Java workloads, providing more insights on their degree of concurrency, their scalability, and how they synchronize and communicate via shared memory. Despite task granularity is a key attribute of parallel workloads, their work does not shed light on the task granularity of the analyzed applications.
Chen et al.[19] analyze scalability issues of multithreaded Java applications on multicore systems. Their study pinpoints that lock contention is a strong limiting factor of scalability, determines that memory stalls are mostly produced by L2 cache misses and cache-to-cache transfers, and identifies an important factor causing slowdowns in minor garbage collections. They also highlight the importance of thread-local allocation buffers to increase cache utilization. While they target applications running on the JVM, as we do, their analysis overlooks task granularity as a possible factor causing performance drawbacks. On the other hand, our work demonstrates that task granularity can significantly impair application performance if overlooked.
Roth et al.[118] observe performance factors that are common to most parallel programs, and propose a hierarchical framework to organize these factors with the goal of helping users locate scalability issues in parallel applications. The top of their hierarchy is composed of three key factors: work (i.e., the time spent on executing computations), distribution (i.e., the overhead caused by distributing work to processors, idleness or load imbalance), and delay (i.e., the overhead caused by resource contention or failed transactions). They use their framework to discover inefficient barrier implementations and improve work distribution in some PARSEC[12] applications. Unfortunately, the authors do no consider task granularity as a performance factor common to many parallel workloads. On the other hand, our results indicate that task granularity is a crucial performance attribute of many task-parallel applications, and that optimizing it is of paramount importance.
17 2.3 Analyses of Parallel Applications
Eyerman et al.[35] and Heirman et al. [49] propose speedup stacks to identify the impact of scalability bottlenecks on the speedup of parallel applications. A speedup stack is a stacked bar composed of various scaling delimiters. The larger a delimiter is on the stack, the more it contributes to the application slowdown; hence, it is likely to yield the largest speedup if optimized. The authors identify several important scaling delimiters that are represented on the stack: spinning (time spent spinning on locks and barriers), yielding (time spent due to yielding on locks and barriers), last-level cache, memory interference, cache coherency, work imbalance, and parallelization overhead. The work by Eyerman et al. re-quires custom hardware support to obtain speedup stacks, which may severely limit their applicability. On the other hand, the methodology used by Heirman et al. relies on multiple expensive simulations of the analyzed applications which may be impracticable for large multithreaded programs. Eklov et al.[34] provide an alternate method to obtain speedup stacks based on standard hardware perfor-mance counters (HPCs) commonly available in contemporary processors. Their methodology relies on cache pirating[33] to measure application performance as a function of the amount of shared cache capacity that the application receives. Unfortunately, the resulting speedup stacks are less comprehensive than those proposed by Eyerman et al., as they cannot represent scaling delimiters such as yielding, memory interference, and cache coherency.
While useful for locating which scaling delimiters to optimize, speedup stacks do not provide insights on how to perform the optimization. On the other hand, our work enables the collection of actionable profiles, indicating the classes and methods where optimizations are needed to optimize task granularity. Differently from the above work, our approach significantly reduces the effort for imple-menting optimizations, and does not require in-depth knowledge of the target application. Overall, task granularity is a complementary performance attribute to those considered by the above techniques, and could be integrated in speedup stacks to enable a comprehensive performance analysis of parallel workloads.
Du Bois et al.[28] introduce bottle graphs to show the performance of mul-tithreaded applications. Each thread is represented as a box, with height equal to the share of the thread in the total application execution time, and width equal to its parallelism (here defined as the average number of threads that run concurrently with that thread, including itself). Boxes for all threads are stacked upon each other. Bottle graphs expose threads representing scalability bottlenecks as narrow and tall boxes, intuitively pointing developers to the threads with the greatest optimization potential. The authors use bottle graphs to pinpoint scalability bottlenecks in Java applications. The same authors propose criticality
18 2.4 Profilers for Parallel Applications
waiting for its termination. Criticality stacks support the identification of critical
threads, i.e., those making other threads wait on locks or barriers for significant time. Optimizing critical threads can speed up the whole application. The authors use criticality stacks to remove parallel bottlenecks, identify the most critical thread of an application and accelerate it through frequency scaling, and lower energy consumption.
Both bottle graphs and criticality stacks suffer from limitations similar to speedup stacks, i.e., they fall short in suggesting to developers how to perform optimizations. Moreover, the aforementioned approaches target only threads, while our work focuses on parallel tasks,2 allowing finer-grained analyses than the ones enabled by bottle graphs and criticality stacks.
Kambadur et al.[68] propose parallel block vectors, which establish a mapping between static basic blocks in a multithreaded application and the number of active threads. The mapping is performed each time a basic block executes. The authors use parallel block vectors to separate sequential and parallel portions of a program for individual analysis, and to track changes in the number of threads in execution over time in small code regions. The vectors are generated through Harmony, an instrumentation pass for the LLVM compiler. While their work al-lows developers to locate code regions executed by many threads, our approach enables the identification of the code portions where fine-grained tasks are cre-ated and submitted, which typically need modifications during task-granularity optimization.
Overall, unlike the above work, we select metrics to both characterize the granularity of all spawned tasks accurately and analyze their impact on appli-cation performance. Moreover, we implement a vertical profiler to collect such metrics from multiple system layers with low overhead. Finally, some of the aforementioned authors[67; 19; 28] describe the parallel characteristics of the DaCapo benchmarks[15], as we do. Our work is complementary to them, as it reveals features of such benchmarks that were previously unknown, including the presence of fine-grained tasks causing significant parallelization overheads, as well as coarse-grained tasks with suboptimal CPU utilization. Our findings pinpoint new parallelization opportunities leading to noticeable speedups.
2.4
Profilers for Parallel Applications
In Section 2.1.3, we presented the profiling tools most related to task granularity. Researchers from both industry and academia have developed several
19 2.4 Profilers for Parallel Applications
mentary tools to analyze diverse characteristics of a parallel application. This section discusses the major ones. Note that the aforementioned authors focusing on the work-span model also propose profilers for parallel applications, which we already discussed in Section 2.2.
Free Lunch[26] is a lock profiler for production Java server applications. The tool identifies phases where the progress of threads is significantly impeded by a lock, indicating a loss in performance. Free Lunch profiles locks by modifying the internal lock structures of the JVM. To maintain a low overhead (as required by analyses performed at production-time), Free Lunch relies on statistical sampling, which may significantly reduce the accuracy of the tool. On the other hand, tgp collects metrics without resorting to sampling (apart from CPU utilization), resulting in more accurate profiles while still guaranteeing low profiling overhead thanks to efficient instrumentation code and data structures.
THOR [127] helps developers understand the state of a Java thread, i.e., whether the thread is running on a core or is idling. The tool relies on vertical profiling to trace events across different layers of the execution stack (such as context switches and lock contention), reconstructing the traces obtained from different layers through offline analysis. Unfortunately, the overhead and the measurement perturbation caused by THOR as well as the required memory can be significant. For this reason, the authors recommend using the tool only for short periods of time (e.g., 20 seconds), which may be inconvenient for large or complex workloads. In contrast, our tool does not suffer from this limitation, and can be used to collect accurate task-granularity metrics even on long-running workloads.
jPredictor[18] detects concurrency errors in Java applications. The tool in-struments a program to generate relevant events at runtime. The resulting trace is analyzed by jPredictor through static analysis. The tool can “predict” concurrency errors, i.e., detect errors that did not occur in an observed execution, but which could have happened under a different thread scheduling. Unfortunately, the tool does not detect suboptimal task granularities, thus missing related performance drawbacks.
Inoue et al.[57] propose a sampling-based profiler for parallel applications running on the IBM J9 virtual machine [54]. The profiler detects Java-level events and correlates them with metrics collected by HPCs. Aiming at obtaining more valuable information from HPCs to understand and optimize the running application, the tool tracks the calling context of each event received by an HPC. Our tool uses a similar approach, collecting calling contexts on a JVM and querying HPCs. However, tgp focuses on the collection of task granularities, while this work targets other events such as object creation or lock activities.
20 2.4 Profilers for Parallel Applications
HPCToolkit[2] is a suite of tools for the analysis of application performance. HPCToolkit aims at locating and quantifying scalability bottlenecks in parallel programs. The suite instruments the binaries of the target application to achieve language-independency, and relies massively on HPCs. A subsequent work by Liu et al. [79] enhances the suite to support performance analysis and optimization on Non-Uniform Memory Access (NUMA) architectures. Similarly to HPCToolkit, our approach uses HPCs to collect accurate task-granularity values, and leverages the presence of different NUMA nodes to bind the execution of the observed application to an exclusive node, executing other components of tgp on a separate node. Our approach increases the isolation of the observed application, reducing performance interference caused by other processes in execution (as the observed application exclusively utilizes the cores and the memory of its NUMA node), ultimately increasing the accuracy of the collected metrics. Unfortunately, HPC-Toolkit is not suitable to characterize task granularity in task-parallel applications on the JVM.
Kremlin[41] provides recommendations on which regions of a sequential program can benefit from parallelization. The tool extends critical-path analy-sis[73] to quantify the benefit of parallelizing a given region of code, providing as output a ranked order of regions that are likely to have the largest performance impact when being parallelized. Kismet [64] is an extension of Kremlin that enhances the capability to predict the expected speedup of a code region after parallelization. To this end, Kismet employs a parallel execution model to com-pute an approximated upper bound for speedup, representing constraints arising from hardware characteristics or the internal program structure. Unfortunately, similarly to profilers based on the work-span model (Section 2.2), such tools do not allow to discover performance shortcomings caused by fine-grained tasks, unlike tgp.
SyncProf [148] locates portions of code where bottlenecks are caused by threads suffering from contention and synchronization issues. SyncProf repeatedly executes a program with various inputs and summarizes the observed performance behavior with a graph-based representation that relates different critical sections. SyncProf aids the process of computing the performance impact of critical sections, identifying the root cause of a bottleneck, and suggesting possible optimization strategies. Similarly to SyncProf, our approach allows the identification of tasks incurring significant contention and synchronization, which decrease application performance. While this tool only targets threads, tgp focuses on every spawned task, allowing a finer-grained performance analysis.
Other prevailing Java profilers are Health Center[53], JProfiler [32], YourKit [147], vTune Amplifier [60], and Mission Control [106]. They are optimized
21 2.5 Reification of Supertype Information
for common analyses, such as CPU utilization monitoring, object and memory profiling, memory-leak detection, and heap walking. However, they fall short in performing more specific analyses, including task-granularity profiling.
Overall, most of the aforementioned work considers processes or threads as the main computing entities, providing little information about individual tasks and their impact on application performance. On the contrary, our work focuses on tasks, identifying fine- and coarse-grained tasks and enabling the diagnosis of related performance shortcomings. Moreover, our tool provides actionable profiles, easing the identification of classes and methods that can benefit from task-granularity optimizations. Finally, tgp employs efficient instrumentation and profiling data structures that help reduce profiling overhead and measurement perturbation, unlike most of the above tools.
2.5
Reification of Supertype Information
The availability of complete and accurate RSI while instrumenting Java classes allows more efficient type-specific analyses. Unfortunately, most of the existing instrumentation frameworks for the JVM cannot access RSI or can inspect it only partially, and may result in analyses with increased runtime overhead and measurement perturbation. Moreover, frameworks capable of accessing complete RSI usually cannot offer full bytecode coverage,3 and may lead to incomplete analyses that miss relevant events. In this section, we discuss the limitations of the major Java bytecode instrumentation frameworks capable of accessing RSI at instrumentation time.
AspectJ[70] is a mainstream AOP language and weaver.4 In addition to AOP, AspectJ has been used for various instrumentation tasks. Since version 5, AspectJ provides a reflection API which is fully aware of the AspectJ type system[138]. AspectJ can perform the instrumentation either at compile-time or at load-time. The AspectJ compile-time weaver resorts to static analysis to precompute the type hierarchy of an application. Unfortunately, static analysis cannot guarantee accurate and complete RSI, since information on classloaders and on dynamically loaded classes is missing. On the other hand, the load-time weaver of AspectJ can access complete RSI. However, the weaver is unable to instrument classes in the
3Full bytecode coverageis the ability of a framework to guarantee the instrumentation of every
Java method with a bytecode representation.
4We use the term weaver to denote the component of a framework performing the
instru-mentation. We use the term weaving to denote the insertion of instrumentation code into Java classes.
22 2.5 Reification of Supertype Information
Java class library, resulting in limited bytecode coverage.5 This issue is reported as a major limitation of AspectJ by the authors of the DJProf profiler[112].
The AspectBench Compiler (abc)[8] is an extensible AspectJ compiler that eases the implementation of extensions to the AspectJ language and of opti-mizations. It uses the Polyglot [91] framework as its front-end and the Soot framework[143] as its back-end for improving code generation. As abc is based on the compile-time weaver of AspectJ, only limited RSI is available.
Several runtime monitoring and verification tools for the JVM rely on AOP to weave the monitoring logic into the observed program, such as JavaMOP[66], Tracematches[16], or MarQ [114]. These frameworks are based on AspectJ and suffer from the same limitations. In particular, Tracematches is based on AspectJ’s compile-time weaver (resulting in limited RSI), while JavaMOP and MarQ rely on the load-time weaver of AspectJ (resulting in limited bytecode coverage).
RoadRunner[38] is a framework for composing dynamic analysis tools aimed at checking safety and liveness properties of concurrent programs. Each analysis is represented as a filter over a set of event streams which can be chained together. RoadRunner performs the instrumentation at load-time in the same JVM running application code. While the framework may access RSI, it suffers from limited bytecode coverage[81], similarly to the AspectJ’s load-time weaver.6 DPAC[65] is a dynamic analysis framework for the JVM. Similarly to DiSL, DPAC performs the instrumentation at load-time in a JVM running in a separate process. To the best of our knowledge, DPAC does not provide access to complete RSI at instrumentation-time. Our approach can benefit frameworks like DPAC, providing complete RSI in the weaver.
Several bytecode engineering libraries facilitate bytecode instrumentation. Javassist[21] is a load-time bytecode manipulation library that enables structural reflection, i.e., altering the definition of classes or methods. Javassist provides convenient source-level abstractions and also supports a bytecode-level API allow-ing one to directly edit a classfile. ASM[108] and BCEL [128] provide low-level APIs to analyze, create, and transform Java class files. Java classes are repre-sented as objects that contain all the information of the given class: constant pool, methods, fields, and bytecode instructions. Additionally, ASM supports load-time transformation of Java classes. Soot[143] is a bytecode optimization framework supporting multiple bytecode representations in order to simplify the analysis and
5The load-time weaver of AspectJ prevents the instrumentation of classes in the packages
java.*,javax.*, and sun.reflect.*. More details are available athttps://eclipse.org/ aspectj/doc/released/devguide/ltw-specialcases.html.
6Classes inside the following packages cannot be instrumented by RoadRunner: java.*,
23 2.5 Reification of Supertype Information
the transformation of Java bytecode. Spoon[111] is a framework for program transformation and static analysis in Java, which reifies the program with respect to a meta-model. This allows direct access and modification of its structure at compile-time and allows inserting code using an AOP-based notation.
In contrast to the above frameworks, our approach enables the provision of accurate and complete RSI at instrumentation time. Thus, type-specific analyses running on DiSL can benefit from the new DiSL Reflection API to decrease the profiling overhead while offering full bytecode coverage, resulting in analyses that are both efficient and complete.
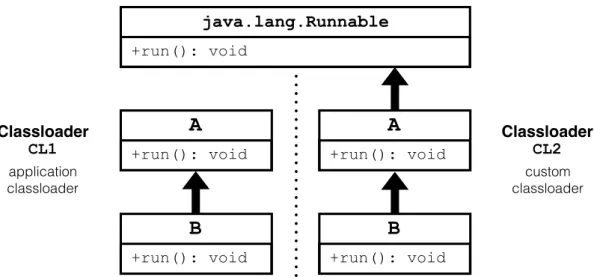
Moreover, the aforementioned frameworks based on compile-time instrumen-tation [70; 8; 16; 111] cannot access complete classloader namespaces while performing the instrumentation, and may fail to detect and instrument classes loaded by custom classloaders. On the other hand, our approach allows the weaver to inspect accurate and complete classloader namespaces, enabling the se-lective instrumentation of classes loaded by custom classloaders. In addition, our technique allows DiSL to correctly handle homonym classes defined by different classloaders, which may cause inaccurate or wrong profiling in other prevailing instrumentation frameworks due to the lack of completely reified classloader namespaces in the weaver.
Chapter 3
Task-Granularity Profiling
This chapter describes our approach to profile task granularity. Section 3.1 in-troduces background information on the used frameworks and technologies. Section 3.2 presents the model used for identifying tasks and accounting their granularities. Section 3.3 details the metrics of interest. Section 3.4 discusses our profiling methodology. Section 3.5 describes the instrumentation for profiling task granularity. Section 3.6 details the implementation of our approach in DiSL. Section 3.7 discusses other metrics initially considered and later disregarded, as well as the limitations of our work. Finally, Section 3.8 summarizes the achieve-ments presented in this chapter. The profiling technique presented here is fully implemented in tgp, our novel task-granularity profiler for the JVM.
3.1
Background
Here, we introduce background information on the JVMTI and JNI interfaces (Section 3.1.1) and on the DiSL and Shadow VM frameworks (Section 3.1.2).
3.1.1
JVMTI and JNI
JVMTI (JVM Tool Interface)[98] is an interface that enables inspecting the state of a JVM and controlling the execution of applications running on top of it. JVMTI exposes an API to a native agent (written in C or C++) to be attached to a JVM. The agent runs in the same process and directly communicates with the JVM it is attached to. Among the features offered by the interface, a JVMTI agent can intercept certain events occurring in the observed JVM, such as the loading of a class (allowing one to modify the final representation of a class before it is linked in the JVM), the termination of a thread, the shutdown of the observed JVM or
26 3.1 Background
the activation of the garbage collector. Moreover, JVMTI supports heap tagging: agents can assign a unique long value (i.e., a tag) to any object allocated on the heap, as well as retrieve or unset the tag associated to an object. Untagged objects have a tag of 0. Agents can also be notified when a tagged object is reclaimed by the garbage collector, executing custom code when this occurs.
JNI (Java Native Interface)[96] is a standard interface for writing native Java methods. Similarly to JVMTI, JNI exposes an API to a native agent, to be attached to a JVM and executing in the same process. The main purpose of JNI is enabling Java code to call native code and vice versa. JNI is not available during the early initialization phase of the JVM (i.e., the primordial phase). Our approach uses features of JVMTI and JNI to instrument classes and signaling events such application shutdown to a separate analysis process (the Shadow VM, see below). In Chapter 4, we will resort to such interfaces to expose reflective supertype information and classloader namespaces to the instrumentation process.
3.1.2
DiSL and Shadow VM
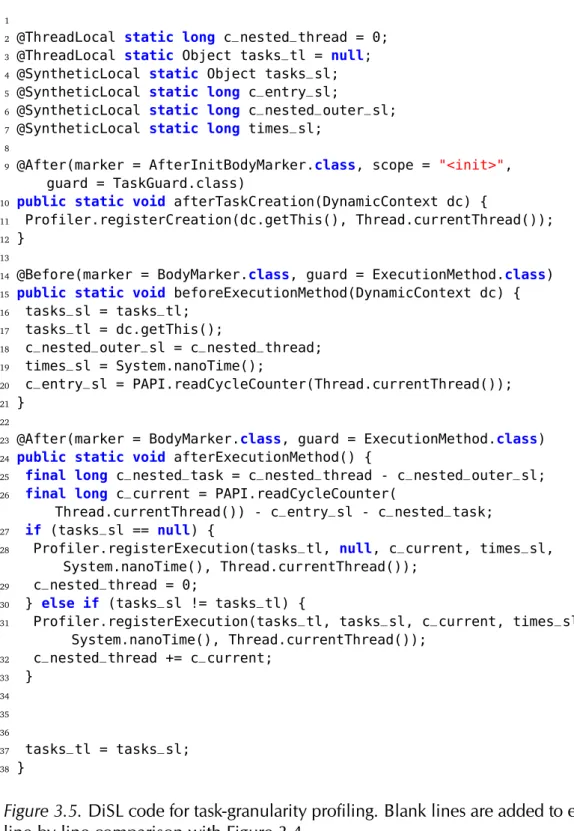
Our profiling methodology resorts to DiSL to insert profiling code into the observed application. DiSL[82] is a dynamic program-analysis framework based on Java bytecode instrumentation. In DiSL, developers write instrumentation code in the form of code snippets, based on AOP principles that allow a concise implementation of runtime monitoring tools. DiSL allows developers to specify where a code snippet shall be woven through markers (specifying which parts of a method to instrument, such as method bodies, basic blocks, etc.), annotations (specifying where a code snippet must be inserted wrt. a marker, e.g., before or after method bodies), scope (specifying which classes or methods shall be instrumented based on a pattern-matching scheme), and guards (predicate methods enabling the evaluation of conditionals at instrumentation-time to determine whether a code snippet should be woven into the method being instrumented or not).
Code snippets and guards have access to context information provided via method arguments. Context information can be either static (i.e., static infor-mation limited to constants) or dynamic (i.e., including local variables and the operand stack). Dynamic context information can be accessed only by code snip-pets. DiSL supports also synthetic local variables (enabling data passing between different code snippets woven into the same method body) and thread-local
vari-ables (implemented by additional instance fields injava.lang.Thread). Both variables can be expressed as annotated static fields (i.e.,@SyntheticLocaland @ThreadLocal, respectively).
27 3.2 Task Model
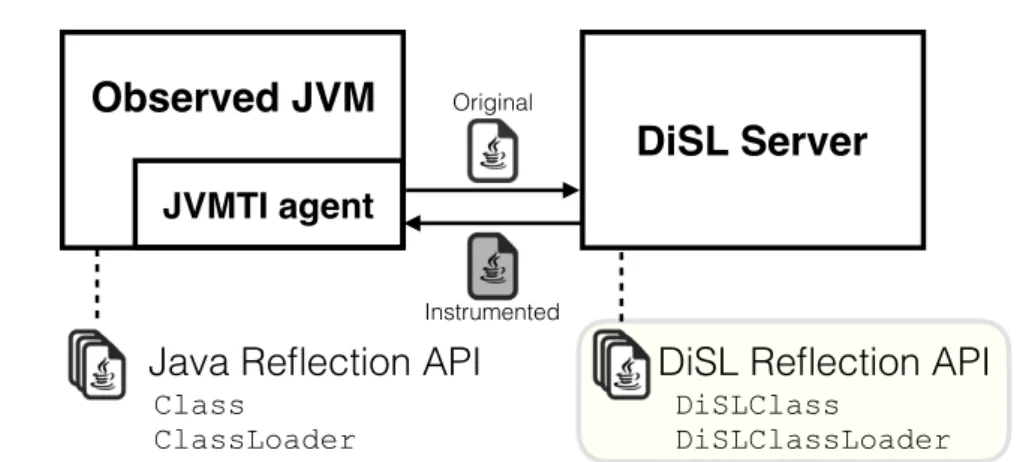
DiSL performs the instrumentation in a separate JVM process, the DiSL server. A native JVMTI agent attached to the observed JVM intercepts classloading, sending each loaded class to the DiSL server. There, the instrumentation logic determines which methods to instrument to collect the desired metrics. In-strumented classes are then sent back to the observed JVM. The DiSL weaver guarantees full bytecode coverage of an analysis. In particular, DiSL enables the instrumentation of classes in the Java class library, which are notoriously hard to instrument[13; 69].
DiSL offers a deployment setting to isolate the execution of analysis code from application code, executing analysis code asynchronously with respect to the application code in a separate JVM process, the Shadow VM [81]. The observed application is instrumented using DiSL to emit the events of interests, which are then forwarded to the analysis executing in the separate Shadow VM via a native JVMTI agent attached to the observed JVM. This setting avoids sharing states between the analysis and the observed application, which helps avoiding various known classes of bugs that may be introduced by less isolated approaches [69]. Moreover, Shadow VM eases proper handling of all thread lifecycle events, and guarantees that all thread termination events are received even during the shutdown phase of the JVM. We rely on Shadow VM to both increase the isolation of analysis code and guarantee that the granularity of all threads can be detected and registered (even during the shutdown phase), ensuring complete detection of all spawned tasks.
3.2
Task Model
In this section, we present the task model used by our approach. The model specifies the entities of interest, defines rules for measuring task granularity, and outlines tasks requiring special handling.
3.2.1
Tasks
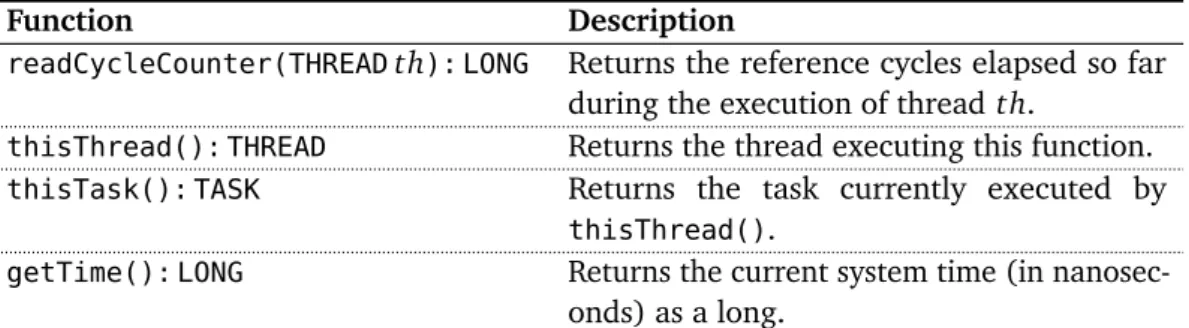
Our work targets tasks created by parallel applications running on a JVM. We consider only those entities as tasks that are expected to be executed in parallel with other tasks. Accordingly, we consider as task every instance of the Java inter-facesjava.lang.Runnable(which should be implemented by objects intended to be executed by a thread), java.util.concurrent.Callable (analogous to Runnable, with the difference that tasks can declare a non-void return type), and the abstract class java.util.concurrent.ForkJoinTask(which defines tasks