arXiv:1308.2708v1 [hep-ex] 12 Aug 2013
Measurement of the differential cross section of photon plus jet production in p ¯
p
collisions at
√
s
= 1.96 TeV
V.M. Abazov,31B. Abbott,66 B.S. Acharya,25 M. Adams,45 T. Adams,43 J.P. Agnew,40 G.D. Alexeev,31 G. Alkhazov,35 A. Altona,55 A. Askew,43 S. Atkins,53 K. Augsten,7 C. Avila,5 F. Badaud,10 L. Bagby,44 B. Baldin,44 D.V. Bandurin,43S. Banerjee,25 E. Barberis,54 P. Baringer,52J.F. Bartlett,44 U. Bassler,15 V. Bazterra,45 A. Bean,52M. Begalli,2 L. Bellantoni,44 S.B. Beri,23G. Bernardi,14R. Bernhard,19 I. Bertram,38 M. Besan¸con,15 R. Beuselinck,39 P.C. Bhat,44 S. Bhatia,57 V. Bhatnagar,23 G. Blazey,46 S. Blessing,43K. Bloom,58
A. Boehnlein,44 D. Boline,63 E.E. Boos,33 G. Borissov,38 A. Brandt,69 O. Brandt,20 R. Brock,56 A. Bross,44 D. Brown,14 X.B. Bu,44 M. Buehler,44 V. Buescher,21 V. Bunichev,33 S. Burdinb,38 C.P. Buszello,37 E. Camacho-P´erez,28 B.C.K. Casey,44 H. Castilla-Valdez,28 S. Caughron,56 S. Chakrabarti,63 K.M. Chan,50 A. Chandra,71 E. Chapon,15G. Chen,52 S.W. Cho,27 S. Choi,27 B. Choudhary,24 S. Cihangir,44 D. Claes,58 J. Clutter,52 M. Cooke,44W.E. Cooper,44 M. Corcoran,71F. Couderc,15M.-C. Cousinou,12 D. Cutts,68 A. Das,41
G. Davies,39S.J. de Jong,29, 30 E. De La Cruz-Burelo,28 F. D´eliot,15R. Demina,62 D. Denisov,44 S.P. Denisov,34 S. Desai,44 C. Deterred,20 K. DeVaughan,58 H.T. Diehl,44 M. Diesburg,44 P.F. Ding,40 A. Dominguez,58 A. Dubey,24 L.V. Dudko,33 A. Duperrin,12 S. Dutt,23 M. Eads,46D. Edmunds,56 J. Ellison,42 V.D. Elvira,44 Y. Enari,14H. Evans,48 V.N. Evdokimov,34L. Feng,46 T. Ferbel,62F. Fiedler,21 F. Filthaut,29, 30 W. Fisher,56
H.E. Fisk,44 M. Fortner,46 H. Fox,38 S. Fuess,44 A. Garcia-Bellido,62 J.A. Garc´ıa-Gonz´alez,28V. Gavrilov,32 W. Geng,12, 56 C.E. Gerber,45 Y. Gershtein,59 G. Ginther,44, 62 G. Golovanov,31 P.D. Grannis,63 S. Greder,16 H. Greenlee,44G. Grenier,17 Ph. Gris,10 J.-F. Grivaz,13 A. Grohsjeanc,15 S. Gr¨unendahl,44M.W. Gr¨unewald,26 T. Guillemin,13 G. Gutierrez,44P. Gutierrez,66 J. Haley,54 L. Han,4 K. Harder,40 A. Harel,62 J.M. Hauptman,51
J. Hays,39 T. Head,40 T. Hebbeker,18 D. Hedin,46 H. Hegab,67 A.P. Heinson,42 U. Heintz,68 C. Hensel,20 I. Heredia-De La Cruzd,28 K. Herner,44G. Heskethf,40 M.D. Hildreth,50 R. Hirosky,72T. Hoang,43 J.D. Hobbs,63 B. Hoeneisen,9 J. Hogan,71 M. Hohlfeld,21J.L. Holzbauer,57 I. Howley,69 Z. Hubacek,7, 15 V. Hynek,7 I. Iashvili,61 Y. Ilchenko,70 R. Illingworth,44 A.S. Ito,44 S. Jabeen,68 M. Jaffr´e,13A. Jayasinghe,66 M.S. Jeong,27 R. Jesik,39
P. Jiang,4 K. Johns,41 E. Johnson,56 M. Johnson,44 A. Jonckheere,44 P. Jonsson,39J. Joshi,42 A.W. Jung,44 A. Juste,36 E. Kajfasz,12D. Karmanov,33 I. Katsanos,58R. Kehoe,70 S. Kermiche,12N. Khalatyan,44A. Khanov,67
A. Kharchilava,61 Y.N. Kharzheev,31 I. Kiselevich,32J.M. Kohli,23 A.V. Kozelov,34 J. Kraus,57 A. Kumar,61 A. Kupco,8 T. Kurˇca,17 V.A. Kuzmin,33S. Lammers,48 P. Lebrun,17 H.S. Lee,27 S.W. Lee,51W.M. Lee,43 X. Lei,41
J. Lellouch,14 D. Li,14H. Li,72L. Li,42 Q.Z. Li,44 J.K. Lim,27 D. Lincoln,44 J. Linnemann,56 V.V. Lipaev,34 R. Lipton,44 H. Liu,70 Y. Liu,4 A. Lobodenko,35 M. Lokajicek,8 R. Lopes de Sa,63 R. Luna-Garciag,28 A.L. Lyon,44A.K.A. Maciel,1 R. Madar,19 R. Maga˜na-Villalba,28S. Malik,58V.L. Malyshev,31 J. Mansour,20
J. Mart´ınez-Ortega,28 R. McCarthy,63 C.L. McGivern,40 M.M. Meijer,29, 30 A. Melnitchouk,44 D. Menezes,46 P.G. Mercadante,3M. Merkin,33A. Meyer,18J. Meyeri,20 F. Miconi,16N.K. Mondal,25 M. Mulhearn,72 E. Nagy,12
M. Narain,68 R. Nayyar,41 H.A. Neal,55 J.P. Negret,5 P. Neustroev,35 H.T. Nguyen,72 T. Nunnemann,22 J. Orduna,71 N. Osman,12 J. Osta,50 A. Pal,69 N. Parashar,49 V. Parihar,68 S.K. Park,27R. Partridgee,68 N. Parua,48A. Patwaj,64 B. Penning,44 M. Perfilov,33 Y. Peters,20 K. Petridis,40G. Petrillo,62 P. P´etroff,13
M.-A. Pleier,64 V.M. Podstavkov,44 A.V. Popov,34 M. Prewitt,71D. Price,48 N. Prokopenko,34 J. Qian,55 A. Quadt,20 B. Quinn,57 P.N. Ratoff,38 I. Razumov,34 I. Ripp-Baudot,16F. Rizatdinova,67 M. Rominsky,44
A. Ross,38C. Royon,15P. Rubinov,44 R. Ruchti,50 G. Sajot,11 A. S´anchez-Hern´andez,28 M.P. Sanders,22 A.S. Santosh,1G. Savage,44 L. Sawyer,53 T. Scanlon,39 R.D. Schamberger,63Y. Scheglov,35 H. Schellman,47 C. Schwanenberger,40R. Schwienhorst,56 J. Sekaric,52H. Severini,66 E. Shabalina,20 V. Shary,15 S. Shaw,56 A.A. Shchukin,34V. Simak,7 N.B. Skachkov,31P. Skubic,66 P. Slattery,62 D. Smirnov,50G.R. Snow,58 J. Snow,65 S. Snyder,64 S. S¨oldner-Rembold,40L. Sonnenschein,18K. Soustruznik,6 J. Stark,11 D.A. Stoyanova,34M. Strauss,66
L. Suter,40 P. Svoisky,66 M. Titov,15 V.V. Tokmenin,31 Y.-T. Tsai,62D. Tsybychev,63B. Tuchming,15 C. Tully,60 L. Uvarov,35 S. Uvarov,35 S. Uzunyan,46 R. Van Kooten,48 W.M. van Leeuwen,29 N. Varelas,45 E.W. Varnes,41 I.A. Vasilyev,34A.Y. Verkheev,31 L.S. Vertogradov,31M. Verzocchi,44 M. Vesterinen,40 D. Vilanova,15 P. Vokac,7
H.D. Wahl,43 M.H.L.S. Wang,44 J. Warchol,50 G. Watts,73 M. Wayne,50 J. Weichert,21 L. Welty-Rieger,47 M.R.J. Williams,48 G.W. Wilson,52 M. Wobisch,53 D.R. Wood,54 T.R. Wyatt,40 Y. Xie,44 R. Yamada,44 S. Yang,4 T. Yasuda,44 Y.A. Yatsunenko,31 W. Ye,63 Z. Ye,44 H. Yin,44 K. Yip,64 S.W. Youn,44 J.M. Yu,55
J. Zennamo,61 T.G. Zhao,40 B. Zhou,55 J. Zhu,55 M. Zielinski,62 D. Zieminska,48 and L. Zivkovic14 (The D0 Collaboration∗
)
1LAFEX, Centro Brasileiro de Pesquisas F´ısicas, Rio de Janeiro, Brazil 2Universidade do Estado do Rio de Janeiro, Rio de Janeiro, Brazil
3Universidade Federal do ABC, Santo Andr´e, Brazil
4University of Science and Technology of China, Hefei, People’s Republic of China 5Universidad de los Andes, Bogot´a, Colombia
6Charles University, Faculty of Mathematics and Physics, Center for Particle Physics, Prague, Czech Republic 7Czech Technical University in Prague, Prague, Czech Republic
8Institute of Physics, Academy of Sciences of the Czech Republic, Prague, Czech Republic 9Universidad San Francisco de Quito, Quito, Ecuador
10LPC, Universit´e Blaise Pascal, CNRS/IN2P3, Clermont, France 11LPSC, Universit´e Joseph Fourier Grenoble 1, CNRS/IN2P3,
Institut National Polytechnique de Grenoble, Grenoble, France 12CPPM, Aix-Marseille Universit´e, CNRS/IN2P3, Marseille, France
13LAL, Universit´e Paris-Sud, CNRS/IN2P3, Orsay, France 14LPNHE, Universit´es Paris VI and VII, CNRS/IN2P3, Paris, France
15CEA, Irfu, SPP, Saclay, France
16IPHC, Universit´e de Strasbourg, CNRS/IN2P3, Strasbourg, France
17IPNL, Universit´e Lyon 1, CNRS/IN2P3, Villeurbanne, France and Universit´e de Lyon, Lyon, France 18III. Physikalisches Institut A, RWTH Aachen University, Aachen, Germany
19Physikalisches Institut, Universit¨at Freiburg, Freiburg, Germany
20II. Physikalisches Institut, Georg-August-Universit¨at G¨ottingen, G¨ottingen, Germany 21Institut f¨ur Physik, Universit¨at Mainz, Mainz, Germany
22Ludwig-Maximilians-Universit¨at M¨unchen, M¨unchen, Germany 23Panjab University, Chandigarh, India
24Delhi University, Delhi, India
25Tata Institute of Fundamental Research, Mumbai, India 26University College Dublin, Dublin, Ireland
27Korea Detector Laboratory, Korea University, Seoul, Korea 28CINVESTAV, Mexico City, Mexico
29Nikhef, Science Park, Amsterdam, the Netherlands 30Radboud University Nijmegen, Nijmegen, the Netherlands
31Joint Institute for Nuclear Research, Dubna, Russia 32Institute for Theoretical and Experimental Physics, Moscow, Russia
33Moscow State University, Moscow, Russia 34Institute for High Energy Physics, Protvino, Russia 35Petersburg Nuclear Physics Institute, St. Petersburg, Russia
36Instituci´o Catalana de Recerca i Estudis Avan¸cats (ICREA) and Institut de F´ısica d’Altes Energies (IFAE), Barcelona, Spain 37Uppsala University, Uppsala, Sweden
38Lancaster University, Lancaster LA1 4YB, United Kingdom 39Imperial College London, London SW7 2AZ, United Kingdom 40The University of Manchester, Manchester M13 9PL, United Kingdom
41University of Arizona, Tucson, Arizona 85721, USA 42University of California Riverside, Riverside, California 92521, USA
43Florida State University, Tallahassee, Florida 32306, USA 44Fermi National Accelerator Laboratory, Batavia, Illinois 60510, USA
45University of Illinois at Chicago, Chicago, Illinois 60607, USA 46Northern Illinois University, DeKalb, Illinois 60115, USA
47Northwestern University, Evanston, Illinois 60208, USA 48Indiana University, Bloomington, Indiana 47405, USA 49Purdue University Calumet, Hammond, Indiana 46323, USA 50University of Notre Dame, Notre Dame, Indiana 46556, USA
51Iowa State University, Ames, Iowa 50011, USA 52University of Kansas, Lawrence, Kansas 66045, USA 53Louisiana Tech University, Ruston, Louisiana 71272, USA 54Northeastern University, Boston, Massachusetts 02115, USA
55University of Michigan, Ann Arbor, Michigan 48109, USA 56Michigan State University, East Lansing, Michigan 48824, USA
57University of Mississippi, University, Mississippi 38677, USA 58University of Nebraska, Lincoln, Nebraska 68588, USA 59Rutgers University, Piscataway, New Jersey 08855, USA
60Princeton University, Princeton, New Jersey 08544, USA 61State University of New York, Buffalo, New York 14260, USA
62University of Rochester, Rochester, New York 14627, USA 63State University of New York, Stony Brook, New York 11794, USA
64Brookhaven National Laboratory, Upton, New York 11973, USA 65Langston University, Langston, Oklahoma 73050, USA 66University of Oklahoma, Norman, Oklahoma 73019, USA 67Oklahoma State University, Stillwater, Oklahoma 74078, USA
68Brown University, Providence, Rhode Island 02912, USA 69University of Texas, Arlington, Texas 76019, USA 70Southern Methodist University, Dallas, Texas 75275, USA
71Rice University, Houston, Texas 77005, USA 72University of Virginia, Charlottesville, Virginia 22904, USA
73University of Washington, Seattle, Washington 98195, USA (Dated: August 12, 2013)
We study the process of associated photon and jet production, p¯p → γ + jet + X, using 8.7 fb−1of integrated luminosity collected by the D0 detector at the Fermilab Tevatron Collider at a center-of-mass energy√s = 1.96 TeV. Photons are reconstructed with rapidity |yγ
| < 1.0 or 1.5 < |yγ | < 2.5 and transverse momentum pγ
T > 20 GeV. The highest-pT jet is required to be in one of four rapidity regions up to |yjet
| ≤ 3.2. For each rapidity configuration we measure the differential cross sections in pγ
T separately for events with the same sign (y
γyjet> 0) and opposite sign (yγyjet≤ 0) of photon and jet rapidities. We compare the measured triple differential cross sections, d3σ/dpγ
Tdy
γdyjet, to next-to-leading order (NLO) perturbative QCD calculations using different sets of parton distribution functions and to predictions from the sherpa and pythia Monte Carlo event generators. The NLO calculations are found to be in general agreement with the data, but do not describe all kinematic regions.
PACS numbers: 13.85.Qk, 12.38.Qk
I. INTRODUCTION
In hadron-hadron collisions, high-energy photons (γ) emerge unaltered from the hard scattering process of two partons and therefore provide a clean probe of the parton dynamics. The study of such photons (called prompt) produced in association with a jet can be used to extend inclusive photon production measurements [1– 6] and provide information about the parton distribution functions (PDFs) of the incoming hadrons [7–13]. The term “prompt” means that these photons do not result from mesons, for example, π0, η, ω, or K0
S decays. Such events are mostly produced in Quantum Chromodynam-ics (QCD) directly through the Compton-like scattering process gq → γq and through quark-antiquark annihila-tion q ¯q → γg. Inclusive γ + jet production may also orig-inate from partonic processes such as gg → q¯q, qg → qg, or qq → qq where a final state quark or gluon produces a photon during fragmentation (fragmentation photon) [8, 14], and another parton fragments into a jet. Photon
∗with visitors from aAugustana College, Sioux Falls, SD, USA, bThe University of Liverpool, Liverpool, UK,cDESY, Hamburg,
Germany, dUniversidad Michoacana de San Nicolas de Hidalgo,
Morelia, MexicoeSLAC, Menlo Park, CA, USA,fUniversity
Col-lege London, London, UK,gCentro de Investigacion en
Computa-cion - IPN, Mexico City, Mexico,hUniversidade Estadual Paulista,
S˜ao Paulo, Brazil, iKarlsruher Institut f¨ur Technologie (KIT)
-Steinbuch Centre for Computing (SCC) andjOffice of Science, U.S.
Department of Energy, Washington, D.C. 20585, USA.
isolation requirements substantially reduce the rates of these events. However, their contribution is still notice-able in some regions of phase space, for example, at low photon transverse momentum, pγT.
By selecting events with different angular configura-tions between the photon and the jets, the data probe dif-ferent ranges of parton momentum fraction x and hard-scattering scales Q2, as well as providing some differen-tiation between contributing partonic subprocesses.
In this article, we present an analysis of γ + jet produc-tion in p¯p collisions at a center-of-mass energy√s = 1.96 TeV in which the highest-pT (leading) photon is produced either centrally with a rapidity |yγ| < 1.0 or in the for-ward rapidity region with 1.5 < |yγ| < 2.5 [15]. The leading jet is required to be in one of the four rapidity regions, |yjet| ≤ 0.8, 0.8 < |yjet| ≤ 1.6, 1.6 < |yjet| ≤ 2.4, or 2.4 < |yjet| ≤ 3.2, and to satisfy the minimum trans-verse momentum requirement pjetT > 15 GeV. The cross section as a function of pγT is measured differentially for sixteen angular configurations of the leading jet and the photon rapidities. These configurations are obtained by combining the two photon and four jet rapidity regions, considered separately for events having the same sign and opposite sign of photon and jet rapidities, i.e. yγyjet> 0 and yγyjet≤ 0.
The primary motivation of this measurement is to con-strain the gluon PDF that directly affects the rate of Compton-like qg → qγ parton scattering. The rate of this process varies for different photon-jet rapidity con-figurations and drops with increasing pγT. Estimates
us-ing the pythia [16] Monte Carlo (MC) event generator and cteq6L PDF set [17] show that the highest fraction of qg events is observed in same-sign events with forward photons (yγyjet> 0 and 1.5 < |yγ| < 2.5). Figure 1 shows the expected contributions of the Compton-like process to the total associated production cross section of a pho-ton and a jet for the four jet rapidity intervals in same-sign events with forward photons. In these events the qg fraction increases with jet rapidity.
The PDFs entering the theoretical predictions have substantial uncertainties, particularly for the gluon con-tributions at small x, or large x and large Q2 [17]. The γ + jet cross sections probe different regions of parton momentum fraction x1and x2 of the two initial interact-ing partons. For example, at pγT ≈ 20 − 25 GeV, events with a central photon and central jet cover the interval in 0.01 < x < 0.06, while same-sign events with a forward photon and very forward jet (2.4 < |yjet| ≤ 3.2) cover the regions within 0.001 < x < 0.004 and 0.2 < x < 0.5. Here, x is defined using the leading-order approximation x1,2 = (pγT/√s)(exp(±yγ) + exp(±yjet)) [8]. The total x and Q2 region (with Q2taken as (pγ
T)
2) covered by the measure-ment is 0.001 ≤ x ≤ 1 and 400 ≤ Q2≤ 1.6 × 10⁵ GeV2, extending the kinematic reach of previous γ + jet mea-surements [18–26].
The expected ratio of the direct photon contribution to the sum of direct and fragmentation contributions of the γ + jet cross section is shown in Fig. 2, for the chosen photon isolation criteria (see Sec. II B), in the four stud-ied regions. The fragmentation contribution decreases with increasing pγT for all regions [14, 27, 28].
(GeV) γ T p 0 50 100 150 200 250 qg fraction 0 0.1 0.2 0.3 0.4 0.5 0.6 0.7 0.8 0.9 1 | < 2.5 γ 1.5 < |y > 0 jet y γ y DØ, PYTHIA 0.8 ≤ | jet |y 1.6 ≤ | jet 0.8 < |y 2.4 ≤ | jet 1.6 < |y 3.2 ≤ | jet 2.4 < |y
FIG. 1: (color online) The fraction of events, estimated using the pythia event generator [16] with cteq6L PDF set [17], produced via the qg → qγ subprocess relative to the total cross section of associated production of a direct photon in the forward rapidity region, 1.5 < |yγ
| < 2.5, and a leading jet in one of the four rapidity intervals satisfying yγyjet> 0.
(GeV)
γ
T
p
0 50 100 150 200 250
Fraction of direct contribution
0.6 0.65 0.7 0.75 0.8 0.85 0.9 0.95 1 1.05 1.1 0.8 ≤ | jet |y 1.6 ≤ | jet 0.8 < |y 2.4 ≤ | jet 1.6 < |y 3.2 ≤ | jet 2.4 < |y | < 2.5 γ 1.5 < |y > 0 jet y γ y DØ, JETPHOX
FIG. 2: (color online) For γ +jet events, the fraction of the di-rect (non-fragmentation) photon contribution of the total (di-rect+fragmentation) cross section, estimated with jetphox [29] for events with forward photons.
Compared to the latest γ + jet cross sections published by the D0 [25] and ATLAS [26] Collaborations, this mea-surement considers not only central but also forward pho-ton rapidities, four jet rapidity intervals, and uses a sig-nificantly larger data set.
This paper is organized as follows. In Sec. II, we briefly describe the D0 detector and γ + jet events selection cri-teria. In Sec. III, we describe the MC signal and back-ground samples used in the analysis. In Sec. IV, we assess the main corrections applied to the data needed to mea-sure the cross sections and discuss related uncertainties in Sec. V. Measured cross sections and comparisons with theoretical predictions are presented in Sec. VI. Finally, Sec. VII summarizes the results.
II. D0 DETECTOR AND DATA SET
A. D0 detector
The D0 detector is a general purpose detector de-scribed in detail elsewhere [30–32]. The subdetectors most relevant in this analysis are the calorimeter, the central tracking system, and the central preshower. The muon detection system is used for selecting a clean Z → µ+µ−
γ sample to obtain data-to-MC correction fac-tors for the photon reconstruction efficiency. The central tracking system, used to reconstruct tracks of charged particles, consists of a silicon micro-strip detector (SMT) and a central fiber track detector (CFT), both inside a 2 T solenoidal magnetic field. While the amount of mate-rial traversed by a charged particle depends on its trajec-tory, it is typically on the order of 0.1 radiation lengths
in the tracking system. The tracking system provides a 35 µm vertex resolution along the beam line and 15 µm resolution in the transverse plane near the beam line for charged particles with pT ≈ 10 GeV. The solenoid mag-net is surrounded by the central preshower (CPS) detec-tor located immediately before the inner layer of the elec-tromagnetic calorimeter. The CPS consists of approxi-mately one radiation length of lead absorber surrounded by three layers of scintillating strips. The preshower de-tectors are in turn surrounded by sampling calorimeters constructed of depleted uranium absorbers in an active liquid argon volume. The calorimeter is composed of three sections: a central calorimeter (CC) covering the range of pseudorapidities |ηdet| < 1.1 [15] and two end calorimeters (EC) with coverage extending to |ηdet| ≈ 4.2, with all three housed in separate cryostats. The electromagnetic (EM) section of the central calorimeter contains four longitudinal layers of approximately 2, 2, 7, and 10 radiation lengths, and is finely-segmented trans-versely into cells of size ∆ηdet× ∆φdet= 0.1 × 0.1, with the exception of layer three with 0.05 × 0.05 granular-ity. The calorimeter resolution for measurements of the electron/photon energy at 50 GeV is about 3.6%. The luminosity is measured using plastic scintillator arrays placed in front of the EC cryostats at 2.7 < |ηdet| < 4.4.
B. Event selection
Triggers for the events used for this analysis are based on at least one cluster of energy found in the EM calorimeter with loose shower shape requirement and var-ious pγT thresholds. The data set with photon candidates covering the interval of 20 < pγT ≤ 35 GeV is selected using prescaled EM triggers with a pT threshold of 17 GeV and corresponds to a total integrated luminosity of 7.00±0.43 pb−1. The selection efficiency of photons with respect to this trigger condition exceeds 96%. As a cross check, the cross sections in this pγT region are also mea-sured using events that are heavily prescaled with trigger thresholds of pT = 13 GeV or 9 GeV corresponding to to-tal luminosities of 2.63 ± 0.16 pb−1and 0.65 ± 0.04 pb−1, respectively [33].
Photon candidates with pT > 35 GeV are selected us-ing a set of unprescaled EM triggers with pT thresholds between 20 GeV and 70 GeV, with a signal selection ef-ficiency with respect to the trigger requirements close to 100%. This data set corresponds to an integrated lumi-nosity of 8.7 ± 0.5 fb−1 [33] after relevant data quality cuts.
The D0 tracking system is used to select events con-taining at least one p¯p collision vertex reconstructed with at least three tracks and within 60 cm of the center of the detector along the beam axis. The efficiency of the vertex requirements above varies as a function of instantaneous luminosity within 95% − 97%.
The longitudinal segmentation of the EM calorimeter and CPS detector allows the estimation of the direction
of the central photon candidate and the coordinate of its origin along the beam axis (“photon vertex pointing”). This position is required to be within 10 cm (3 stan-dard deviations) of the p¯p collision vertex if there is a CPS cluster matched to the photon EM cluster (∼ 80% of events) or within 32 cm otherwise (about 1.5 stan-dard deviation for such events). Forward photons are assumed to originate from the default p¯p collision vertex. A systematic uncertainty is assigned to account for this assumption.
C. Photon and jet selections
EM clusters for photon candidates are formed from calorimeter towers in a cone of radius R = p(∆η)2+ (∆φ)2 = 0.4 around a seed tower [30]. A stable cone is found iteratively, and the final cluster en-ergy is recalculated from an inner cone within R = 0.2. The photon candidates are required (i) to have ≥ 97% of the cluster energy deposited in the EM calorime-ter layers; (ii) to be isolated in the calorimecalorime-ter with I = [Etot(0.4) − EEM(0.2)]/EEM(0.2) < 0.07, where Etot(R) [EEM(R)] is the total [EM only] energy in a cone of radius R; (iii) to have a scalar sum of the pT of all charged particles originating from the vertex in an annulus of 0.05 < R < 0.4 around the EM cluster to be less than 1.5 GeV; and (iv) to have an energy-weighted EM shower width consistent with that expected for a photon. To suppress electrons misidentified as photons, the EM clusters are required to have no spatial match to a charged particle track or any hit configuration in the SMT and CFT detectors consistent with an electron tra-jectory [34]. This requirement is referred to as a “track-match veto”.
An additional group of variables exploiting the dif-ferences between the photon- and jet-initiated activity in the EM calorimeter, CPS (for central photons), and the tracker is combined into an artificial neural network (NN) to further reject jet background [35]. In these back-ground events, photons are mainly produced from decays of energetic π0 and η mesons. The NN is trained on a pythia[16] MC sample of photon and jets events. The generated MC events are processed through a geant-based simulation of the D0 detector [36]. Simulated events are overlaid with data events from random p¯p crossings to properly model the effects of multiple p¯p in-teractions and detector noise in data. Care is taken to ensure that the instantaneous luminosity distribution in the overlay events is similar to the data used in the anal-ysis. MC events are then processed through the same reconstruction procedure as the data. They are weighted to take into account the trigger efficiency in data, and small observed differences in the distributions of the in-stantaneous luminosity and of the z coordinate of the p¯p collision vertex. Photons radiated from charged lep-tons in Z boson decays (Z → ℓ+ℓ−
γ, ℓ = e, µ) are used to validate the NN performance [37–39]. The shape of
the NN output (ONN) distribution in the MC simula-tion describes the data well and gives an addisimula-tional dis-crimination against jets. The ONN distribution for jets is validated using dijet MC and data samples enriched in jets misidentified as photons. For this purpose, the jets are required to pass all photon identification criteria listed above, but with an inverted calorimeter isolation requirement of I > 0.1 or by requiring at least one track in a cone of R < 0.05 around the photon candidate. The photon candidates are selected with a requirement ONN> 0.3 to retain 97% − 98% of photons and to reject ≈ 40% (≈ 15%) of jets remaining after the other selec-tions described above for central (forward) photons have been applied.
Background contributions from cosmic rays and from isolated electrons, originating from the leptonic decays of W bosons, are suppressed by requiring the missing transverse energy 6ET, calculated as a vector sum of the transverse energies of all calorimeter cells and corrected for reconstructed objects (photon and jet energy scale corrections), to satisfy the condition 6ET < 0.7 pγT.
The measured energy of a photon EM cluster is cali-brated in two steps. First, the absolute energy calibra-tion of the EM cluster is obtained using electrons from Z → e+e− decays as a function of η
det and pT. How-ever, photons interact less with the material in front of the calorimeter than electrons. As a result the electron energy scale correction overestimates the photon pT rel-ative to the particle (true) level. The relrel-ative photon energy correction as a function of η is derived using a detailed geant-based [36] simulation of the D0 detector response. It is particularly sizable at low pT (pγT ≈ 20 GeV), where the photon energy overcorrection is found to be ≈ 3%. The difference between electron and photon calibrations becomes smaller at higher energies. A sys-tematic uncertainty of 0.60% − 0.75% on this correction is due to the electron energy calibration and uncertain-ties in the description of the amount of material in front of the calorimeter. Combined with the steeply falling pγT spectrum this results in a 3% − 5% uncertainty on the measured cross sections (see Section V).
Selected events should contain at least one hadronic jet. Jets are reconstructed using the D0 Run II Midpoint Cone jet-finding algorithm with a cone of R = 0.7 [40], and are required to satisfy quality criteria that suppress backgrounds from leptons, photons, and detector noise effects. Jet energies are corrected to the particle level using a jet energy scale correction procedure [41]. The leading jet must satisfy two requirements: pjetT > 15 GeV and pjetT > 0.3pγT, where the first is related with the jet pT reconstruction threshold of 6 GeV for the uncorrected jet pT. The second requirement reflects the correlation between photon and leading jet pT, and is optimized at the reconstruction level to account for jet pT resolution. At the particle level, this selection reduces the fraction of events with strong radiation in the initial or/and fi-nal state which potentially may lead to higher order cor-rections in theory, i.e., uncertainty to the current NLO
QCD predictions. The jet pT selections above have about 90% − 95% efficiency for the signal. The leading photon candidate and the leading jet are also required to be sep-arated in η-φ space by ∆R(γ, jet) > 0.9.
In total, approximately 7.2 (8.3) million γ + jet candi-date events with central (forward) photons are selected after application of all selection criteria.
III. SIGNAL AND BACKGROUND MODELS
To study the characteristics of signal events, MC sam-ples are generated using pythia [16] and sherpa [42] event generators, with cteq6.1L and cteq6.6M PDF sets [17], respectively. In pythia, the signal events are included via 2 → 2 matrix elements (ME) with gq → γq and q ¯q → γg hard scatterings (defined at the leading order) followed by the leading-logarithm approximation of the partonic shower. The soft underlying events, as well as fragmentation, are based on an empirical model (“Tune A”), tuned to Tevatron data [43].
In sherpa, up to two extra partons (and thus jets) are allowed at the ME level in the 2 → {2, 3, 4} scat-tering, but jets can also be produced in parton show-ers (PS). Matching between partons coming from real emissions in the ME and jets from PS is done at an en-ergy scale Qcutdefined following the prescriptions given in Ref. [44]. Compared with Tune A the multiple par-ton interaction (MPI) model implemented in sherpa is characterized by (a) showering effects in the second inter-action, which makes it closer to the pT-ordered showers [45] in the Perugia tunes [46], and (b) a combination of the CKKW merging approach with the MPI modeling [42, 47]. Another distinctive feature of sherpa is the modeling of the parton-to-photon fragmentation contri-butions through the incorporation of QED effects into the parton shower [44]. This contribution is available in sherpawith default settings for γ + jet events.
Since we measure the cross section of isolated prompt photons, the isolation criterion should be defined in the MC sample as well to allow a comparison of data to expectations. In the pythia and sherpa samples, the photon is required to be isolated at the particle level by piso T = p tot T (0.4) −p γ T < 2.5 GeV, where p tot T (0.4) is the to-tal transverse energy of particles within a cone of radius R = 0.4 centered on the photon. Here, the particle level includes all stable particles as defined in Ref. [48]. The photon isolation at the particle level differs from that at the reconstruction level (see Sec. II C), and includes spe-cific requirements on the calorimeter isolation (defined around the EM cluster) and track isolation.
To estimate backgrounds to γ + jet production, we also consider dijet events simulated in pythia. In the lat-ter, constraints are placed at the generator level to in-crease the number of jet events fluctuating into photon-like objects [35] after applying photon selection crite-ria. The signal events may contain photons originat-ing from the parton-to-photon fragmentation process.
For this reason, the background events, produced with QCD processes in pythia, were preselected to exclude bremsstrahlung photons produced from partons. Finally, to estimate other possible backgrounds, we have also used W +jet and Z+jet samples simulated with alp-gen+pythia [49], and diphoton events simulated with sherpa. Signal and background events are processed through a geant-based [36] simulation and event recon-struction as described in the previous section.
IV. DATA ANALYSIS AND CORRECTIONS
A. Estimating signal fraction
Two types of instrumental background contaminate the γ+jet sample: electroweak interactions resulting in one or more electromagnetic clusters (from electrons or photons), and strong interactions producing a jet misidentified as a photon.
The first type of background includes W (→ eν)+jet, Z/γ∗
(→ e+e−
)+jet, and diphoton production. The con-tributions from these backgrounds are estimated from MC simulation. In the case of W (→ eν)+jet events, with the electron misidentified as a photon, the neutrino will contribute additional 6ET. The combination of the track-match veto (part of the photon identification criteria), and 6ET requirement reduces the contribution from this process to a negligible level, less than 0.5% for events with central photons, and less than 1.5% for events with for-ward photons. Contributions from Z+jet and diphoton events, in which either e±
from Z decay is misidentified as a photon, or one of the photons in the diphoton events is misidentified as a jet, are found to be even smaller. These backgrounds are subtracted from the selected data sam-ple.
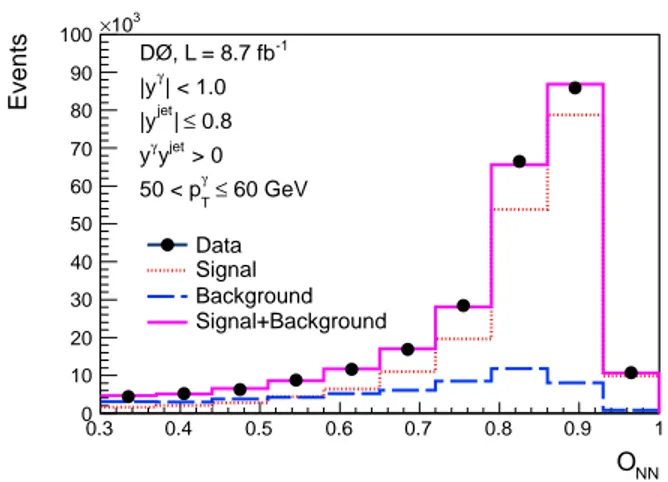
To estimate the remaining background contribution from dijet events, we consider photon candidates in the region 0.3 < ONN≤ 1 (i.e. the region used for data anal-ysis). The distributions for the simulated photon signal and dijet background samples are fitted to the data for each pγT bin using a maximum likelihood fit [50] to ob-tain the fractions of signal and background components in data. The result of this fit to ONNtemplates, normal-ized to the number of events in data, is shown in Fig. 3 for central photons with 50 < pγT < 60 GeV, as an exam-ple. The pγT dependence of the signal fraction (purity) is fitted in each region using a three-parameter function, P = a/(1 + b(pγT)c). Two alternative fitting functions have also been considered. Figure 4 shows the resulting purities for events with central photons, very central and very forward jet rapidities, for same-sign and opposite-sign rapidities. Figure 5 shows similar results for events with forward photons. The signal fractions, typically, grow with pγT, while the growth is not as significant for the events with forward photons. The signal fractions are somewhat greater for the same-sign rapidity events than for the opposite-sign, and also greater for events
NN O 0.3 0.4 0.5 0.6 0.7 0.8 0.9 1 Events 0 10 20 30 40 50 60 70 80 90 100 3 10 × Data Signal Background Signal+Background -1 DØ, L = 8.7 fb | < 1.0 γ |y 0.8 ≤ | jet |y 60 GeV ≤ γ T 50 < p > 0 jet y γ y
FIG. 3: (color online) Distribution of observed events for ONN after all selection criteria for the representative bin 50 < pγT < 60 GeV (|y
γ
| < 1.0). The distributions for the signal and background templates are shown normalized to their respective fitted fractions. Fits in the other pγT bins are of similar quality.
with central jets as opposed to forward jet events. The measured fractions of signal events have to be cor-rected for events with prompt photons with the isolation parameter value at the particle level piso
T ≥ 2.5 GeV. Such events can migrate into our data sample even after ap-plying the photon selections described in Sec. II C. The fractions of such events are estimated in two ways. First, we use the signal models in sherpa and pythia MC gen-erators to determine the fraction of events with piso
T ≥ 2.5 GeV after all selections. The fraction of such events is 1% − 3% for events with central photons and 1% − 2% for events with forward photons. This procedure gives consistent results for both MC generators. In the sec-ond method, we calculate signal purities for the signal events in which we keep all photons, i.e., including those with isolation piso
T ≥ 2.5 GeV, and compare them with the default case where photons satisfy the isolation cut piso
T < 2.5. The difference of 1% − 3% is in good agree-ment with the direct MC estimates. We subtract this fraction from data and assign an additional systematic uncertainty on the signal purity of 1% − 1.5%.
Other systematic uncertainties on the signal purity are caused by the ONNtemplate fitting uncertainties derived from the error matrix, the choice of fit functions, and the signal model dependence estimated by a comparison of signal purities obtained with the photon templates taken from pythia and sherpa. An additional systematic un-certainty on the background template due to the frag-mentation model implemented in pythia is also taken into account. It is found to be about 5% at pγT ≃ 30 GeV, 2% at pγT ≃ 50 GeV, and 1% at pγT &70 GeV and is es-timated using the method described in Ref. [4].
(GeV) γ T p 0 50 100 150 200 250 300 350 400 Signal purity 0 0.2 0.4 0.6 0.8 1 1.2 Data fit total uncertainty -1 DØ, L = 8.7 fb 0.8 ≤ | jet | < 1.0, |y γ |y > 0 jet y γ y (GeV) γ T p 0 50 100 150 200 250 300 350 400 Signal purity 0 0.2 0.4 0.6 0.8 1 1.2 Data fit total uncertainty -1 DØ, L = 8.7 fb 0.8 ≤ | jet | < 1.0, |y γ |y 0 ≤ jet y γ y (GeV) γ T p 0 20 40 60 80 100 120 140 160 180 200 Signal purity 0 0.2 0.4 0.6 0.8 1 1.2 Data fit total uncertainty -1 DØ, L = 8.7 fb 3.2 ≤ | jet | < 1.0, 2.4 < |y γ |y > 0 jet y γ y (GeV) γ T p 0 20 40 60 80 100 120 140 160 180 200 Signal purity 0 0.2 0.4 0.6 0.8 1 1.2 Data fit total uncertainty -1 DØ, L = 8.7 fb 3.2 ≤ | jet | < 1.0, 2.4 < |y γ |y 0 ≤ jet y γ y
FIG. 4: (color online) Purity of the selected γ + jet sample as a function of pγT, shown for central photons, very central and very forward jet rapidities, same-sign, and opposite-sign rapidity events. The solid line shows the fit and the dashed lines show the total fit uncertainty.
(GeV) γ T p 0 20 40 60 80 100 120 140 160 180 200 220 Signal purity 0 0.1 0.2 0.3 0.4 0.5 0.6 0.7 0.8 0.9 1 Data fit total uncertainty -1 DØ, L = 8.7 fb 0.8 ≤ | jet | < 2.5, |y γ 1.5 < |y > 0 jet y γ y (GeV) γ T p 0 20 40 60 80 100 120 140 160 180 200 220 Signal purity 0 0.1 0.2 0.3 0.4 0.5 0.6 0.7 0.8 0.9 1 Data fit total uncertainty -1 DØ, L = 8.7 fb 0.8 ≤ | jet | < 2.5, |y γ 1.5 < |y 0 ≤ jet y γ y (GeV) γ T p 0 20 40 60 80 100 120 140 160 Signal purity 0 0.1 0.2 0.3 0.4 0.5 0.6 0.7 0.8 0.9 1 Data fit total uncertainty -1 DØ, L = 8.7 fb 3.2 ≤ | jet | < 2.5, 2.4 < |y γ 1.5 < |y > 0 jet y γ y (GeV) γ T p 0 20 40 60 80 100 120 140 160 Signal purity 0 0.1 0.2 0.3 0.4 0.5 0.6 0.7 0.8 0.9 1 Data fit total uncertainty -1 DØ, L = 8.7 fb 3.2 ≤ | jet | < 2.5, 2.4 < |y γ 1.5 < |y 0 ≤ jet y γ y
B. Acceptance and efficiency corrections
We calculate corrections to the observed rate of γ + jet candidates to account for the photon and jet detection efficiencies (and for the geometric and kinematic accep-tances) using samples of simulated γ+jet events in which the photon is required to be isolated at the particle level by applying piso
T < 2.5 GeV.
The bin size is chosen to be larger than the resolution on pγT, yielding more than 80% of the particle-level events located in the same pγT bins at the reconstruction level. The acceptance is dominated by the EM cluster qual-ity selection requirements on ηdet, applied to avoid edge effects in the calorimeter regions used for the measure-ment, and on φdet in the central rapidity region, applied to avoid periodic calorimeter module boundaries [30] that bias the EM cluster energy and position measurements. The acceptance typically varies within about 1.4 − 0.8 with a relative systematic uncertainty of 3% − 12%, and takes into account correlation between the same-sign and opposite-sign events. The acceptance greater than unity corresponds to opposite-sign rapidity events with for-ward jets and low pγT central photons, and are caused by a migration of the (particle-level) same-sign events into the other category. Migration significantly increases the number of reconstructed opposite-sign events due to a much larger cross section for same-sign events at small pγT (see Sec.VI). Correction factors to account for differences between jet-pT and rapidity spectra in data and simula-tion are estimated with pythia, and used as weights to create a data-like MC sample. The differences between acceptance corrections obtained with standard and data-like MC samples are taken as a systematic uncertainty of up to 10% at small pγT. An additional systematic uncer-tainty of up to 7% is assigned from a comparison of the photon selection efficiency calculated with pythia and sherpa.
Small differences between data and MC in the photon selection efficiencies are corrected using factors derived from Z → e+e−
control samples, as well as photons from radiative Z boson decays [37]. The total efficiency of the photon selection criteria is 68% − 80%, depending on the pγT and yγ region. The systematic uncertainties caused by these correction factors are 3% for |yγ| < 1.0 and 7.3% for 1.5 < |yγ| < 2.5 and are mainly due to uncertainties caused by the track-match veto, isolation, and the photon NN requirements.
V. SUMMARY OF SYSTEMATIC
UNCERTAINTIES
The main sources of experimental systematic uncer-tainty on the prompt γ + jet production cross section in two kinematic regions, |yγ| < 1.0, |yjet
| ≤ 0.8, yγyjet> 0 and, 1.5 < |yγ| < 2.5, 2.4 < |yjet
| ≤ 3.2, yγyjet > 0, are shown, as an example, in Fig. 6. Similar uncertainties are found for the other kinematic regions. The largest
uncertainties are assigned to the signal purity estimation (11% − 3%), photon and jet selections (3% − 10%), jet energy scale (7% − 1%), photon energy scale (3% − 8%), EM trigger selection (6% for 20 < pγT < 35 GeV and 1% for pγT ≥ 35 GeV) and the integrated luminosity (6.1%). The uncertainty ranges cover the intervals from low pγT to high pγT. The systematic uncertainty on the photon selection is due to the correction determined by compar-ing the observed data/MC difference in the efficiency to pass the photon selection criteria, and a reconstruction of the photon production vertex z-position (2% for events with central photons and 6% for forward photons). The total experimental systematic uncertainty for each data point is obtained by adding the individual contributions in quadrature. A common normalization uncertainty of 6.8% for events with central photons and 11.2% for for-ward photons resulting from uncertainties on integrated luminosity, photon selection efficiency, and photon pro-duction vertex selection (see above) is not included in the figures, but is included in the tables. Correlations between systematic uncertainties are given in Ref. [51] to increase the value of these data in future PDF fits. Bin-by-bin correlations in pγT are provided for the seven sources of systematic uncertainty. The normalization un-certainties are not included in those tables.
VI. DIFFERENTIAL CROSS SECTION AND
COMPARISON WITH THEORY
The differential cross section d3σ/dpγ Tdyγdy
jet for γ + jet production is obtained from the number of data events in each interval after applying corrections for signal pu-rity, acceptance and efficiency, divided by the integrated luminosity and the widths of the interval in the photon transverse momentum, photon rapidity, and jet rapid-ity. For all regions we choose intervals of dyγ = 2.0 and dyjet= 1.6.
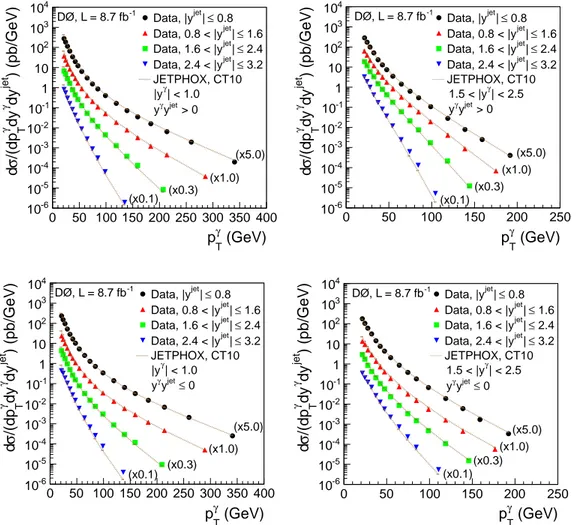
The cross sections for each region are presented as a function of pγT in Fig. 7. The data points are shown at the value hpγTi for which a value of a smooth function describing the cross section dependence equals the av-erage cross section in that bin [52]. The cross sections cover 5–6 orders of magnitude in each rapidity range, and fall more rapidly for events with larger jet and/or photon rapidities. The cross section of events with same-sign rapidities has a steeper pγT spectrum than for the opposite-sign events. As an example, in Fig. 8 we show ratios of the same-sign to opposite-sign cross sections for two extreme cases, central photon and central jet, and forward photon and very forward jet. The ratio reaches about a factor of 1.2 at low pγT at central photon and jet rapidities, while for the forward rapidities it varies by up to a factor of 10. In both cases the ratio drops to about unity at high pγT.
The data are compared to next-to-leading order (NLO) perturbative QCD (pQCD) predictions obtained using jetphox [28, 29], with CT10 PDF [53] and BFG
(GeV) γ T p 0 50 100 150 200 250 300 350 400 Systematic uncertainties, % 0 5 10 15 20 25 30 Purity Acceptance Photon energy scale JES Trigger efficiency Total | < 1.0 γ |y 0.8 ≤ | jet |y > 0 jet y γ y -1 DØ, L = 8.7 fb (GeV) γ T p 0 20 40 60 80 100 120 140 Systematic uncertainties, % 0 5 10 15 20 25 30 Purity Acceptance Photon energy scale JES Trigger efficiency Total | < 2.5 γ 1.5 < |y 3.2 ≤ | jet 2.4 < |y > 0 jet y γ y -1 DØ, L = 8.7 fb
FIG. 6: (color online) Systematic uncertainties on the prompt γ + jet production cross sections for events with central and forward photons (same-sign events with |yjet
| ≤ 0.8 and 2.4 < |yjet
| ≤ 3.2 are shown as an example). A common normalization uncertainty of 6.8% for events with central photons and 11.2% for forward photons resulting from integrated luminosity, photon selection efficiency, and photon production vertex are not included in the figures.
mentation functions of partons to photons [54]. The renormalization, factorization, and fragmentation scales (µR, µF, and µf) are set equal to pγT. The uncertainty due to the scale choice is estimated via a simultaneous variation, up and down, by a factor of two of all three scales relative to the central value (µR= µF = µf = pγT). The CT10 PDF uncertainties are estimated using 26 pairs of eigenvectors following the prescription of Ref. [55].
To compare data to the jetphox predictions at the particle level, the latter are corrected for non-perturbative effects caused by (a) parton-to-hadron frag-mentation and (b) MPI. These corrections are evaluated using pythia MC samples in two steps: (a) as a ratio of γ+jet cross section after fragmentation to that before fragmentation (i.e., at the parton level) with the MPI effect switched off, and (b) as the ratio of γ+jet cross section after switching on the MPI effect to that without it. The typical size of the correction for the fragmenta-tion effect is about 0.98 − 1.02 with 1% uncertainty. As the default MPI tune we choose Perugia-0 (P0) [46] since it shows the best description of the azimuthal distribu-tions in γ+2-jet and γ+3-jet events [56]. To estimate a systematic uncertainty due to the MPI effect, other tunes have been considered as well: P-hard and P-soft [46], that explore the dependence on the strength of initial- and final-state radiation effects, while maintaining a roughly consistent MPI model as implemented in the P0 tune; P-nocr, which excludes any color reconnections in the final state; DW [57] with Q2-ordered showers as an alternative to the P0 tune with pT-ordered showers. We take asym-metric systematic uncertainties defined as maximal devi-ations up and down from the central prediction with P0. Generally, they correspond to P-hard and P-soft tunes.
The typical size of the correction for the MPI effect is 0.96 − 0.98 with an uncertainty of 2% − 5%. The overall correction for the non-perturbative effects is applied to the jetphox predictions with uncertainties added to the theory scale uncertainty. Tables I–XVI show measured and predicted NLO cross sections with their uncertainties for all sixteen studied regions.
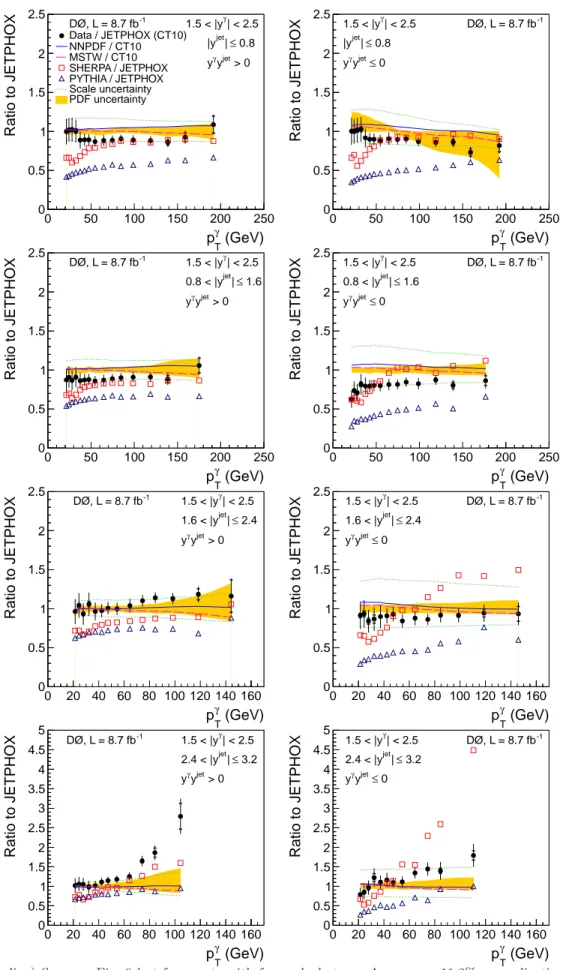
To make a more detailed comparison, the ratio of the measured cross section to the pQCD NLO prediction is calculated in each interval. The results are shown in Figs. 9 and 10. The normalization uncertainty (6.8% for events with central photons and 11.2% for forward photons) are not included in the figures. Ratios of the jetphox predictions with MSTW2008NLO [58] and NNPDFv2.1 [59] PDF sets to those with CT10 PDF set are also shown. The results are also compared to the pre-dictions from sherpa and pythia. The jetphox scale uncertainties are 10% − 15% for events with central pho-tons and jets, but increase to 35% − 40% for events with forward photons and more forward jets. The CT10 PDF uncertainties usually increase with pγT and may reach 40% − 50% in some regions of the phase space, e.g., at high pγT with forward photons and either yγyjet≤ 0 and |yjet
| ≤ 0.8, or yγyjet
> 0 and 2.4 < |yjet | ≤ 3.2.
For central photons, the pQCD NLO theory agrees with data except for small pγT in almost all jet rapidity regions, and except for high pγT with very forward jets (2.4 < |yjet| ≤ 3.2) and opposite-sign photon-jet rapidi-ties. Qualitatively, these results are very similar to those obtained by ATLAS Collaboration [26]. Due to small size of the fragmentation photon contribution (< 10%) and a weak dependence of theoretical scale uncertain-ties on pγT, a possible explanation is the mismodeling of
(GeV) γ T p 0 50 100 150 200 250 300 350 400 ) (pb/GeV) jet dy γ dy γ T /(dp σ d -6 10 -5 10 -4 10 -3 10 -2 10 -1 10 1 10 2 10 3 10 4 10 0.8 ≤ | jet Data, |y 1.6 ≤ | jet Data, 0.8 < |y 2.4 ≤ | jet Data, 1.6 < |y 3.2 ≤ | jet Data, 2.4 < |y JETPHOX, CT10 | < 1.0 γ |y > 0 jet y γ y (x5.0) (x1.0) (x0.3) (x0.1) -1 DØ, L = 8.7 fb (GeV) γ T p 0 50 100 150 200 250 ) (pb/GeV) jet dy γ dy γ T /(dp σ d -6 10 -5 10 -4 10 -3 10 -2 10 -1 10 1 10 2 10 3 10 4 10 0.8 ≤ | jet Data, |y 1.6 ≤ | jet Data, 0.8 < |y 2.4 ≤ | jet Data, 1.6 < |y 3.2 ≤ | jet Data, 2.4 < |y JETPHOX, CT10 | < 2.5 γ 1.5 < |y > 0 jet y γ y (x5.0) (x1.0) (x0.3) (x0.1) -1 DØ, L = 8.7 fb (GeV) γ T p 0 50 100 150 200 250 300 350 400 ) (pb/GeV) jet dy γ dy γ T /(dp σ d -6 10 -5 10 -4 10 -3 10 -2 10 -1 10 1 10 2 10 3 10 4 10 0.8 ≤ | jet Data, |y 1.6 ≤ | jet Data, 0.8 < |y 2.4 ≤ | jet Data, 1.6 < |y 3.2 ≤ | jet Data, 2.4 < |y JETPHOX, CT10 | < 1.0 γ |y 0 ≤ jet y γ y (x5.0) (x1.0) (x0.3) (x0.1) -1 DØ, L = 8.7 fb (GeV) γ T p 0 50 100 150 200 250 ) (pb/GeV) jet dy γ dy γ T /(dp σ d -6 10 -5 10 -4 10 -3 10 -2 10 -1 10 1 10 2 10 3 10 4 10 0.8 ≤ | jet Data, |y 1.6 ≤ | jet Data, 0.8 < |y 2.4 ≤ | jet Data, 1.6 < |y 3.2 ≤ | jet Data, 2.4 < |y JETPHOX, CT10 | < 2.5 γ 1.5 < |y 0 ≤ jet y γ y (x5.0) (x1.0) (x0.3) (x0.1) -1 DØ, L = 8.7 fb
FIG. 7: (color online) The measured differential γ + jet cross section as a function of pγT for the four measured jet rapidity intervals, with central photons, |yγ
| < 1.0, and forward photons, 1.5 < |yγ
| < 2.5, for same-sign and opposite-sign of photon and jet rapidities. For presentation purposes, cross sections for |yjet
| ≤ 0.8, 0.8 < |yjet
| ≤ 1.6, 1.6 < |yjet
| ≤ 2.4 and 2.4 < |yjet | ≤ 3.2 are scaled by factors of 5, 1, 0.3 and 0.1, respectively. The data are compared to the NLO QCD predictions using the jetphox package [29] with the CT10 PDF set [53] and µR= µF = µf = pγT.
0 100 200 300 ) (pb/GeV) jet dy γ dy γ T /(dp σ d -5 10 -4 10 -3 10 -2 10 -1 10 1 10 2 10 > 0, Data jet y γ y 0, Data ≤ jet y γ y > 0, JETPHOX jet y γ y 0, JETPHOX ≤ jet y γ y Data JETPHOX -1 DØ, L = 8.7 fb | < 1.0 γ |y 0.8 ≤ | jet |y (GeV) γ T p 0 100 200 300 Ratio 0.5 1
1.5 JETPHOX scale uncertainty 20 40 60 80 100
) (pb/GeV) jet dy γ dy γ T /(dp σ d -5 10 -4 10 -3 10 -2 10 -1 10 1 10 2 10 > 0, Data jet y γ y 0, Data ≤ jet y γ y > 0, JETPHOX jet y γ y 0, JETPHOX ≤ jet y γ y Data JETPHOX -1 DØ, L = 8.7 fb | < 2.5 γ 1.5 < |y 3.2 ≤ | jet 2.4 < |y (GeV) γ T p 20 40 60 80 100 Ratio 0 5
10 JETPHOX scale uncertainty
FIG. 8: (color online) Comparison of the same-sign to opposite-sign cross section ratios for events with a central photon and central jet and those with a forward photon and very forward jet.
the gluon PDF. The shapes of cross sections predicted by sherpaagree with the data but are typically slightly low with a significant exception for events with very forward jets where the sherpa predictions agree well with data at 20 ≤ pγT .50 GeV, and are much larger at higher p
γ T. Predictions from pythia are about a factor of 1.3 − 2 be-low the measured data points. For events with forward photons, the NLO theory agrees with data within the-oretical and experimental uncertainties, except for the region pγT > 70 GeV in the same-sign events with very forward jets.
VII. SUMMARY
The triple differential cross section d3σ/dpγ Tdyγdy
jet for the associated inclusive photon and jet production process p¯p → γ +jet+X is measured for events with cen-tral (|yγ| < 1.0) and forward (1.5 < |yγ| < 2.5) photons in four jet rapidity intervals (|yjet
| ≤ 0.8, 0.8 < |yjet | ≤ 1.6, 1.6 < |yjet
| ≤ 2.4, and 2.4 < |yjet
| ≤ 3.2), for configura-tions with same and for opposite sign of photon and jet rapidities.
The pQCD NLO predictions describe data with cen-tral photons in almost all jet rapidity regions except low pγT (< 40 GeV) and the opposite-sign rapidity events at high pγT with very forward jets (2.4 < |yjet
| < 3.2). They also describe data with forward photons except for the same-sign rapidity events with pγT > 70 GeV and 2.4 < |yjet| ≤ 3.2. The measured cross sections typi-cally have similar or smaller uncertainties than the NLO PDF and scale uncertainties. These measurements pro-vide valuable information for tuning QCD theory predic-tions and particularly can be used as valuable input to global fits to gluon and other PDFs.
We thank the staffs at Fermilab and collaborating in-stitutions, and acknowledge support from the DOE and NSF (USA); CEA and CNRS/IN2P3 (France); MON, NRC KI and RFBR (Russia); CNPq, FAPERJ, FAPESP and FUNDUNESP (Brazil); DAE and DST (India); Col-ciencias (Colombia); CONACyT (Mexico); NRF (Ko-rea); FOM (The Netherlands); STFC and the Royal So-ciety (United Kingdom); MSMT and GACR (Czech Re-public); BMBF and DFG (Germany); SFI (Ireland); The Swedish Research Council (Sweden); and CAS and CNSF (China).
(GeV) γ T p 0 50 100 150 200 250 300 350 400 Ratio to JETPHOX 0 0.5 1 1.5 2 Data / JETPHOX (CT10) NNPDF / CT10 MSTW / CT10 SHERPA / JETPHOX PYTHIA / JETPHOX Scale uncertainty PDF uncertainty -1 DØ, L = 8.7 fb |yγ| < 1.0 0.8 ≤ | jet |y > 0 jet y γ y (GeV) γ T p 0 50 100 150 200 250 300 350 400 Ratio to JETPHOX 0 0.5 1 1.5 2 -1 DØ, L = 8.7 fb | < 1.0 γ |y 0.8 ≤ | jet |y 0 ≤ jet y γ y (GeV) γ T p 0 50 100 150 200 250 300 350 400 Ratio to JETPHOX 0 0.5 1 1.5 2 2.5 -1 DØ, L = 8.7 fb |yγ| < 1.0 1.6 ≤ | jet 0.8 < |y > 0 jet y γ y (GeV) γ T p 0 50 100 150 200 250 300 350 400 Ratio to JETPHOX 0 0.5 1 1.5 2 2.5 -1 DØ, L = 8.7 fb | < 1.0 γ |y 1.6 ≤ | jet 0.8 < |y 0 ≤ jet y γ y (GeV) γ T p 0 50 100 150 200 250 300 Ratio to JETPHOX 0 0.5 1 1.5 2 2.5 -1 DØ, L = 8.7 fb |yγ| < 1.0 2.4 ≤ | jet 1.6 < |y > 0 jet y γ y (GeV) γ T p 0 50 100 150 200 250 300 Ratio to JETPHOX 0 0.5 1 1.5 2 2.5 -1 DØ, L = 8.7 fb | < 1.0 γ |y 2.4 ≤ | jet 1.6 < |y 0 ≤ jet y γ y (GeV) γ T p 0 20 40 60 80 100120140160180 200 Ratio to JETPHOX 0 0.5 1 1.5 2 2.5 3 3.5 4 4.5 5 -1 DØ, L = 8.7 fb |yγ| < 1.0 3.2 ≤ | jet 2.4 < |y > 0 jet y γ y (GeV) γ T p 0 20 40 60 80 100120140160180 200 Ratio to JETPHOX 0 0.5 1 1.5 2 2.5 3 3.5 4 4.5 5 -1 DØ, L = 8.7 fb | < 1.0 γ |y 3.2 ≤ | jet 2.4 < |y 0 ≤ jet y γ y
FIG. 9: (color online) Ratios of the measured differential cross sections with central photons in each of the four measured jet rapidity intervals to the pQCD NLO prediction using jetphox [29] with the CT10 PDF set and µR = µF = µf = pγT. The solid vertical line on the points shows the statistical and pT-dependent systematic uncertainties added in quadrature, while the internal line shows the statistical uncertainty. A common 6.8% normalization uncertainty on the data points is not shown. The two dotted lines represent the effect of varying the theoretical scales of jetphox by a factor of two. The shaded region is the CT10 [53] PDF uncertainty. The dashed and dash-dotted lines show ratios of the jetphox predictions with MSTW2008NLO [58] and NNPDFv2.1 [59] to CT10 PDF sets. The predictions from sherpa and pythia are shown by the open squares and triangles, respectively.
(GeV) γ T p 0 50 100 150 200 250 Ratio to JETPHOX 0 0.5 1 1.5 2 2.5 Data / JETPHOX (CT10) NNPDF / CT10 MSTW / CT10 SHERPA / JETPHOX PYTHIA / JETPHOX Scale uncertainty PDF uncertainty -1 DØ, L = 8.7 fb 1.5 < |yγ| < 2.5 0.8 ≤ | jet |y > 0 jet y γ y (GeV) γ T p 0 50 100 150 200 250 Ratio to JETPHOX 0 0.5 1 1.5 2 2.5 -1 DØ, L = 8.7 fb | < 2.5 γ 1.5 < |y 0.8 ≤ | jet |y 0 ≤ jet y γ y (GeV) γ T p 0 50 100 150 200 250 Ratio to JETPHOX 0 0.5 1 1.5 2 2.5 -1 DØ, L = 8.7 fb 1.5 < |yγ| < 2.5 1.6 ≤ | jet 0.8 < |y > 0 jet y γ y (GeV) γ T p 0 50 100 150 200 250 Ratio to JETPHOX 0 0.5 1 1.5 2 2.5 -1 DØ, L = 8.7 fb | < 2.5 γ 1.5 < |y 1.6 ≤ | jet 0.8 < |y 0 ≤ jet y γ y (GeV) γ T p 0 20 40 60 80 100 120 140 160 Ratio to JETPHOX 0 0.5 1 1.5 2 2.5 -1 DØ, L = 8.7 fb 1.5 < |yγ| < 2.5 2.4 ≤ | jet 1.6 < |y > 0 jet y γ y (GeV) γ T p 0 20 40 60 80 100 120 140 160 Ratio to JETPHOX 0 0.5 1 1.5 2 2.5 -1 DØ, L = 8.7 fb | < 2.5 γ 1.5 < |y 2.4 ≤ | jet 1.6 < |y 0 ≤ jet y γ y (GeV) γ T p 0 20 40 60 80 100 120 140 160 Ratio to JETPHOX 0 0.5 1 1.5 2 2.5 3 3.5 4 4.5 5 -1 DØ, L = 8.7 fb 1.5 < |yγ| < 2.5 3.2 ≤ | jet 2.4 < |y > 0 jet y γ y (GeV) γ T p 0 20 40 60 80 100 120 140 160 Ratio to JETPHOX 0 0.5 1 1.5 2 2.5 3 3.5 4 4.5 5 -1 DØ, L = 8.7 fb | < 2.5 γ 1.5 < |y 3.2 ≤ | jet 2.4 < |y 0 ≤ jet y γ y
FIG. 10: (color online) Same as Fig. 9 but for events with forward photons. A common 11.2% normalization uncertainty on the data points is not shown.
Appendix: Measured cross sections
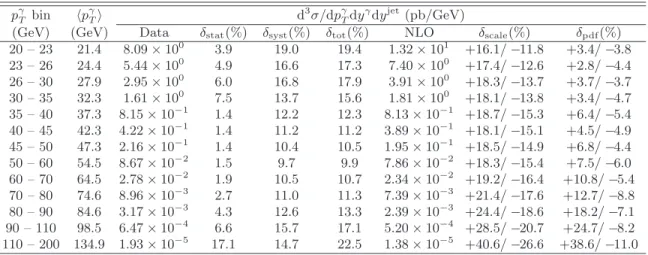
TABLE I: The γ + jet cross section d3σ/dpγ Tdy
γdyjet in bins of pγ T for |y
γ
| < 1.0 and |yjet
| ≤ 0.8, yγyjet> 0 together with statistical (δstat) and systematic (δsyst) uncertainties, and the NLO prediction together with scale (δscale) and PDF (δpdf) uncertainties. A common normalization uncertainty of 6.8% is included in δsystfor all points.
pγ T bin hp γ Ti d 3σ/dpγ Tdy γdyjet(pb/GeV)
(GeV) (GeV) Data δstat(%) δsyst(%) δtot(%) NLO δscale(%) δpdf(%) 20 – 23 21.4 5.52 × 101 2.4 15.3 15.5 7.61 × 101 +8.7/ −6.7 +4.6/ −5.4 23 – 26 24.4 3.69 × 101 2.7 14.4 14.7 4.61 × 101 +9.7/ −7.5 +4.8/ −4.6 26 – 30 27.9 2.30 × 101 2.9 14.3 14.6 2.68 × 101 +10.9/ −8.3 +5.7/ −3.6 30 – 35 32.3 1.31 × 101 3.3 12.4 12.8 1.43 × 101 +11.6/ −8.9 +4.0/ −4.3 35 – 40 37.3 6.87 × 100 1.3 10.0 10.1 7.60 × 100 +11.2/ −10.3 +3.6/ −4.3 40 – 45 42.4 3.96 × 100 1.3 9.3 9.4 4.34 × 100 +11.8/ −10.4 +4.4/ −2.7 45 – 50 47.4 2.44 × 100 1.3 9.0 9.1 2.64 × 100 +11.0/ −11.0 +1.8/ −5.2 50 – 60 54.6 1.28 × 100 1.3 8.2 8.3 1.39 × 100 +12.1/ −10.9 +2.9/ −4.1 60 – 70 64.7 6.03 × 10⁻¹ 1.3 8.3 8.4 6.40 × 10⁻¹ +11.3/ −11.4 +2.4/ −4.5 70 – 80 74.7 3.05 × 10⁻¹ 1.3 8.3 8.4 3.25 × 10⁻¹ +12.1/ −10.6 +5.0/ −2.2 80 – 90 84.7 1.73 × 10⁻¹ 1.4 8.4 8.5 1.80 × 10⁻¹ +11.4/ −10.4 +2.9/ −3.8 90 – 110 99.1 8.04 × 10⁻² 1.4 8.4 8.5 8.46 × 10⁻² +10.8/ −10.3 +3.4/ −4.2 110 – 130 119.2 3.27 × 10⁻² 1.6 8.5 8.6 3.38 × 10⁻² +10.9/ −10.4 +4.1/ −3.4 130 – 150 139.3 1.44 × 10⁻² 1.9 8.6 8.8 1.53 × 10⁻² +10.2/ −10.2 +3.9/ −4.8 150 – 170 159.4 6.95 × 10⁻³ 2.4 8.6 8.9 7.47 × 10⁻³ +10.1/ −10.3 +4.1/ −4.5 170 – 200 183.7 3.16 × 10⁻³ 2.7 8.7 9.2 3.38 × 10⁻³ +9.1/ −10.7 +3.5/ −6.1 200 – 230 213.8 1.28 × 10⁻³ 4.0 8.9 9.7 1.37 × 10⁻³ +9.0/ −10.5 +4.3/ −6.3 230 – 300 259.6 3.88 × 10⁻⁴ 4.7 9.1 10.2 3.83 × 10⁻⁴ +8.8/ −10.3 +6.7/ −4.4 300 – 400 340.5 3.95 × 10⁻⁵ 11.9 9.4 15.2 4.62 × 10⁻⁵ +10.0/ −11.5 +8.5/ −7.1
TABLE II: Same as in Table I but for |yγ
| < 1.0 and 0.8 < |yjet | ≤ 1.6, yγyjet> 0. pγT bin hp γ Ti d 3σ/dpγ Tdy γdyjet(pb/GeV)
(GeV) (GeV) Data δstat(%) δsyst(%) δtot(%) NLO δscale(%) δpdf(%) 20 – 23 21.4 3.70 × 101 2.4 15.7 15.9 6.22 × 101 +9.5/ −6.6 +4.2/ −4.5 23 – 26 24.4 2.32 × 101 2.9 15.0 15.2 3.72 × 101 +10.9/ −7.9 +5.1/ −2.5 26 – 30 27.9 1.45 × 101 3.1 15.2 15.5 2.16 × 101 +10.9/ −9.1 +2.5/ −5.1 30 – 35 32.3 8.44 × 100 3.7 12.6 13.1 1.13 × 101 +12.1/ −9.2 +3.7/ −3.0 35 – 40 37.3 4.79 × 100 1.3 10.5 10.6 5.92 × 100 +11.7/ −10.3 +3.2/ −3.0 40 – 45 42.4 2.84 × 100 1.3 9.7 9.8 3.36 × 100 +11.4/ −10.7 +2.1/ −3.9 45 – 50 47.4 1.71 × 100 1.3 9.3 9.4 2.01 × 100 +11.4/ −10.8 +2.4/ −2.4 50 – 60 54.6 8.87 × 10⁻¹ 1.3 8.4 8.5 1.04 × 100 +11.9/ −10.8 +2.4/ −3.0 60 – 70 64.6 4.04 × 10⁻¹ 1.3 8.6 8.7 4.67 × 10⁻¹ +11.6/ −10.8 +3.5/ −2.2 70 – 80 74.7 2.06 × 10⁻¹ 1.4 8.5 8.6 2.33 × 10⁻¹ +11.4/ −10.3 +2.7/ −3.2 80 – 90 84.7 1.09 × 10⁻¹ 1.4 8.6 8.7 1.24 × 10⁻¹ +10.3/ −10.0 +2.6/ −3.0 90 – 110 99.0 5.00 × 10⁻² 1.4 8.6 8.7 5.57 × 10⁻² +11.2/ −9.7 +4.4/ −3.1 110 – 130 119.1 1.85 × 10⁻² 1.8 8.8 8.9 2.04 × 10⁻² +11.3/ −9.8 +5.4/ −1.8 130 – 150 139.2 7.75 × 10⁻³ 2.3 9.0 9.3 8.31 × 10⁻³ +9.9/ −10.8 +3.7/ −4.2 150 – 170 159.3 3.24 × 10⁻³ 3.2 9.3 9.8 3.57 × 10⁻³ +10.6/ −10.5 +4.6/ −4.5 170 – 200 183.6 1.22 × 10⁻³ 4.1 9.2 10.1 1.35 × 10⁻³ +10.3/ −10.3 +7.4/ −3.5 200 – 230 213.8 4.51 × 10⁻⁴ 6.5 9.4 11.5 4.40 × 10⁻⁴ +12.2/ −11.3 +9.6/ −5.6 230 – 400 285.9 3.80 × 10⁻⁵ 9.7 10.4 14.2 3.67 × 10⁻⁵ +10.2/ −11.4 +11.4/ −7.1
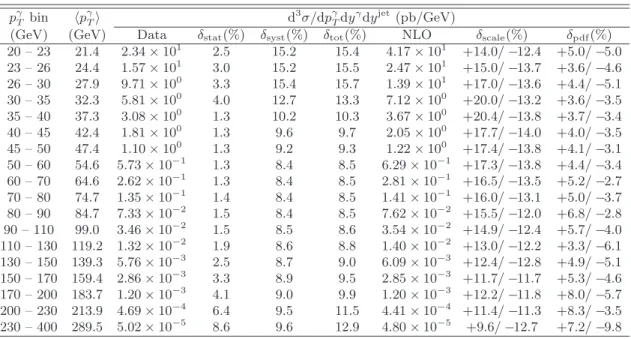
TABLE III: Same as in Table I but for |yγ| < 1.0 and 1.6 < |yjet| ≤ 2.4, yγyjet> 0. pγ T bin hp γ Ti d 3σ/dpγ Tdy γdyjet(pb/GeV)
(GeV) (GeV) Data δstat(%) δsyst(%) δtot(%) NLO δscale(%) δpdf(%) 20 – 23 21.4 2.26 × 101 2.9 17.0 17.3 3.43 × 101 +11.6/ −9.3 +1.8/ −4.7 23 – 26 24.4 1.58 × 101 3.4 15.3 15.7 2.01 × 101 +12.3/ −9.7 +1.7/ −3.8 26 – 30 27.9 9.45 × 100 3.8 15.7 16.1 1.13 × 101 +13.4/ −10.3 +2.4/ −3.0 30 – 35 32.3 5.52 × 100 4.6 13.1 13.9 5.73 × 100 +13.8/ −11.2 +2.1/ −3.4 35 – 40 37.3 2.63 × 100 1.3 11.6 11.7 2.88 × 100 +14.2/ −11.4 +3.9/ −1.3 40 – 45 42.4 1.48 × 100 1.3 10.1 10.1 1.57 × 100 +13.7/ −11.7 +2.7/ −3.4 45 – 50 47.4 8.61 × 10⁻¹ 1.3 9.8 9.9 9.05 × 10⁻¹ +13.5/ −12.1 +3.4/ −2.1 50 – 60 54.5 4.23 × 10⁻¹ 1.3 9.0 9.1 4.45 × 10⁻¹ +11.4/ −11.9 +1.4/ −4.3 60 – 70 64.6 1.76 × 10⁻¹ 1.4 9.1 9.2 1.82 × 10⁻¹ +13.0/ −11.7 +3.1/ −4.0 70 – 80 74.6 7.89 × 10⁻² 1.5 9.0 9.1 8.07 × 10⁻² +12.7/ −10.9 +6.0/ −2.1 80 – 90 84.7 3.87 × 10⁻² 1.8 9.2 9.4 3.86 × 10⁻² +12.5/ −11.5 +4.0/ −5.3 90 – 110 98.8 1.48 × 10⁻² 1.9 9.5 9.7 1.43 × 10⁻² +12.1/ −10.3 +5.9/ −3.7 110 – 130 118.9 4.28 × 10⁻³ 3.0 10.1 10.6 3.91 × 10⁻³ +12.3/ −13.2 +7.5/ −5.7 130 – 150 139.0 1.28 × 10⁻³ 5.3 10.3 11.5 1.10 × 10⁻³ +13.5/ −12.7 +10.1/ −5.5 150 – 170 159.1 4.45 × 10⁻⁴ 8.7 10.9 14.0 3.20 × 10⁻⁴ +15.5/ −13.2 +14.7/ −6.5 170 – 300 206.9 2.82 × 10⁻⁵ 13.7 14.3 19.8 1.98 × 10⁻⁵ +18.7/ −16.1 +21.6/ −9.0
TABLE IV: Same as in Table I but for |yγ
| < 1.0 and 2.4 < |yjet | ≤ 3.2, yγyjet> 0. pγT bin hp γ Ti d 3σ/dpγ Tdy γdyjet(pb/GeV)
(GeV) (GeV) Data δstat(%) δsyst(%) δtot(%) NLO δscale(%) δpdf(%) 20 – 23 21.4 8.09 × 100 3.9 19.0 19.4 1.32 × 101 +16.1/ −11.8 +3.4/ −3.8 23 – 26 24.4 5.44 × 100 4.9 16.6 17.3 7.40 × 100 +17.4/ −12.6 +2.8/ −4.4 26 – 30 27.9 2.95 × 100 6.0 16.8 17.9 3.91 × 100 +18.3/ −13.7 +3.7/ −3.7 30 – 35 32.3 1.61 × 100 7.5 13.7 15.6 1.81 × 100 +18.1/ −13.8 +3.4/ −4.7 35 – 40 37.3 8.15 × 10⁻¹ 1.4 12.2 12.3 8.13 × 10⁻¹ +18.7/ −15.3 +6.4/ −5.4 40 – 45 42.3 4.22 × 10⁻¹ 1.4 11.2 11.2 3.89 × 10⁻¹ +18.1/ −15.1 +4.5/ −4.9 45 – 50 47.3 2.16 × 10⁻¹ 1.4 10.4 10.5 1.95 × 10⁻¹ +18.5/ −14.9 +6.8/ −4.4 50 – 60 54.5 8.67 × 10⁻² 1.5 9.7 9.9 7.86 × 10⁻² +18.3/ −15.4 +7.5/ −6.0 60 – 70 64.5 2.78 × 10⁻² 1.9 10.5 10.7 2.34 × 10⁻² +19.2/ −16.4 +10.8/ −5.4 70 – 80 74.6 8.96 × 10⁻³ 2.7 11.0 11.3 7.39 × 10⁻³ +21.4/ −17.6 +12.7/ −8.8 80 – 90 84.6 3.17 × 10⁻³ 4.3 12.6 13.3 2.39 × 10⁻³ +24.4/ −18.6 +18.2/ −7.1 90 – 110 98.5 6.47 × 10⁻⁴ 6.6 15.7 17.1 5.20 × 10⁻⁴ +28.5/ −20.7 +24.7/ −8.2 110 – 200 134.9 1.93 × 10⁻⁵ 17.1 14.7 22.5 1.38 × 10⁻⁵ +40.6/ −26.6 +38.6/ −11.0
![FIG. 1: (color online) The fraction of events, estimated using the pythia event generator [16] with cteq6L PDF set [17], produced via the qg → qγ subprocess relative to the total cross section of associated production of a direct photon in the forward rapi](https://thumb-eu.123doks.com/thumbv2/123doknet/14064117.461749/4.918.488.796.107.395/fraction-estimated-generator-produced-subprocess-relative-associated-production.webp)


![FIG. 9: (color online) Ratios of the measured differential cross sections with central photons in each of the four measured jet rapidity intervals to the pQCD NLO prediction using jetphox [29] with the CT10 PDF set and µ R = µ F = µ f = p γ T](https://thumb-eu.123doks.com/thumbv2/123doknet/14064117.461749/13.918.188.749.56.1019/ratios-measured-differential-sections-measured-rapidity-intervals-prediction.webp)