Assessing the ecological value of small testate amoebae (<45
m) in New
Zealand peatlands
Michelle M. McKeown
a,∗, Janet M. Wilmshurst
a,b, Clément Duckert
c, Jamie R. Wood
a,
Edward A.D. Mitchell
a,c,daManaaki Whenua – Landcare Research, 54 Gerald Street, 7608 Lincoln, New Zealand
bSchool of Environment, The University of Auckland, Private Bag 92019, 1142 Auckland, New Zealand
cLaboratory of Soil Biodiversity, Institute of Biology, University of Neuchâtel, Rue Emile-Argand 11, CH-2000 Neuchâtel, Switzerland dJardin Botanique de Neuchâtel, Chemin du Perthuis-du-Sault 58, CH-2000 Neuchâtel, Switzerland
Abstract
Methodological advances are essential for robust ecological research. Quantitative reconstructions of environmental condi-tions using testate amoebae rely on sound taxonomy. While the taxonomy of large species is relatively well resolved, this is
not the case for most small taxa (typically <45m long). In New Zealand, peatlands contain a diversity of both cosmopolitan
and characteristic large southern endemic taxa, but also have a high abundance of small taxa. The latter are often lumped into morphotypes reducing their value as ecological indicators. In this study, we demonstrate how (a) lumping small taxa versus splitting them into unique types, and (b) including or excluding them from community analysis influenced their ecological inference. We assessed testate amoeba composition in six peat bogs from New Zealand, three that were moderately-to-highly impacted, and three that were non-impacted. Environmental variables were measured at each sampling site and the surface testate amoeba community patterns and community-environment relationships compared. We found a clear division between impacted and non-impacted sites. Several distinct small taxa were more strongly related to water-table depth and conductivity, while the larger taxa were more correlated to pH. These results show that improved taxonomic resolution of small taxa can provide more informed environmental assessment.
Keywords: Bogs; Human impact; New Zealand; Taxonomy; Testate amoebae; Wetlands
Introduction
Testate amoebae are a polyphyletic assemblage of
free-living single-celled shelled eukaryotes (Mitchell et al., 2008).
Molecular phylogenetic studies based on ribosomal RNA and protein gene sequences show that these organisms
belong to the three supergroups Amoebozoa (Nikolaev et al.,
∗Corresponding author.
E-mail address: mckeownm@landcareresearch.co.nz (M.M. McKe-own).
2005), Stramenopiles (Gomaa et al., 2014), and Rhizaria
(Bhattacharya et al., 1995; Dumack et al., 2016). They are highly diverse, ubiquitous in soil, litter, mosses, lakes, rivers
and brackish water environments (Amesbury et al., 2017;
Barnett et al., 2017; Charman, 1997; Charman et al., 2007; Fernández et al., 2015; Koenig et al., 2018; Royles et al., 2016; Swindles et al., 2015), and they represent one of the most abundant and diverse groups of terrestrial protists.
Testate amoebae are increasingly being used as models
for microbial biogeography (Lara et al., 2016; Mazei et al.,
2018; Smith et al., 2007), as indicators of ecological integrity
in peatlands (Beaulne et al., 2018), as a tool for monitoring
restoration success (Swindles et al., 2016; Valentine et al.,
2013), and as indicators in ecotoxicology (Amacker et al.,
2018; Meyer et al., 2012). They have also been applied as
trace evidence in forensic science (Swindles and Ruffell,
2009), and for defining post-mortem intervals (Seppey et al.,
2016; Szelecz et al., 2014). As these organisms produce decay-resistant tests, they are commonly applied in
palaeoen-vironmental research (Amesbury et al., 2016; Lamentowicz
et al., 2009; Seddon et al., 2014; Wilmshurst et al., 2003), and have been successfully used to reconstruct past moisture
con-ditions across a broad range of climatic zones (McGlone and
Wilmshurst, 1999; Royles et al., 2016; Swindles et al., 2015; Swindles et al., 2016; Wilmshurst et al., 2002). Although the interest in using these organisms in scientific research has notably increased over the last two decades, studies focusing on taxonomy, either morphometrically or phylogenetically,
have not increased at the same rate (Roland et al., 2017).
This poses a potential problem, as the use of testate amoebae as a bioindicator relies on sound taxonomy.
The necessity of taxonomic improvements for applied uses of testate amoebae analysis has been regularly stressed (Booth and Zygmunt, 2005; Kosakyan et al., 2016a; Lahr et al., 2012; Mitchell et al., 2008). While the taxonomy of large species of testate amoebae is relatively well-resolved
based on morphology (Fernández et al., 2016; Fernández
et al., 2015; Heger et al., 2013; Lara et al., 2011), and
increasingly by using molecular approaches (Gomaa et al.,
2012; Kosakyan et al., 2016b; Singer et al., 2015), this is
not the case for most “small taxa” (typically less than 45m
long and hereafter labelled small), which often get lumped into broad morphotypes. Progress is slow due to the lim-ited amount of scientific research on the taxonomy of these morphotypes. This may impede research advances, as sig-nificant differences in environmental preferences may exist among different taxa, which could make them even more useful ecological indicators. Such morphological taxonomies are crucial to the field of palaeoecology, as the (sub)-fossil
tests are used to reconstruct past communities (Mitchell et al.,
2008; Swindles and Roe, 2007; Wilmshurst et al., 2003). Traditional identification and morphometric analysis of testate amoebae relies on shape and measurements of test dimensions such as size of the shell and apertures, along
with variations in the composition of the tests (Ogden and
Hedley, 1980). Tests are composed of a proteinaceous matrix (amorpheous, e.g. Hyalosphenia, or plate-like, e.g. Arcella), which can be reinforced with agglutinated extraneous mate-rial (referred to as xenosomes, e.g. Difflugia), self-secreted calcareous or siliceous plates (referred to as idiosomes, e.g. Paraquadrula, Euglypha) or siliceous plates recycled from consumed prey (e.g. Nebela). Some taxa can incorporate both xenosomes and idiosomes (e.g. Netzelia), or xenosomes and recycled siliceous scales (e.g. Heleopera) into their tests.
Monographs widely used by ecologists and palaeoecolo-gists to identify tests tend to describe larger testate amoeba species in greater detail than the smaller taxa, and this is
the case for the most frequently cited reference guide by Charman et al. (2000). The existing monographs on
indi-vidual genera, mostly describe the larger taxa (Chardez,
1969, 1985; Decloître, 1962; Deflandre, 1928; Deflandre, 1929; Deflandre, 1936; Grospietsch, 1958; Thomas and Gauthier-Lièvre, 1959), except for genera Cryptodifflugia
and Difflugiella (Page 1966; Grospietsch 1965). By
con-trast, knowledge on the diversity of agglutinated xenosomic
species is limited (Delaine et al., 2017), making these taxa
(such as Phryganella paradoxa, Pseudodifflugia fulva, Dif-flugia pulex and DifDif-flugia pristis) particularly challenging to identify and differentiate. As a result, they are often lumped by community analysts, leaving their value as bioindicators poorly defined.
Most of the work on peatland testate amoebae has been undertaken on Northern Hemisphere Sphagnum bogs (Amesbury et al., 2016; Booth and Zygmunt, 2005; Charman et al., 2004; Gałka et al., 2017; Lamentowicz et al., 2008; Mitchell et al., 1999; Swindles et al., 2010). In contrast, tes-tate amoebae remain less studied in the Southern Hemisphere,
apart from New Zealand (Charman, 1997; Wilmshurst et al.,
2002; Wilmshurst et al., 2003), but recent work is now
emerging from Australia (Bamforth, 2015; Meisterfeld et al.,
2008; Zheng et al., 2019), South America (Fernández et al., 2016; Fernández et al., 2015; Van Bellen et al., 2014) and
Antarctica (Charman et al., 2018; Stelling et al., 2018).
The study of testate amoebae from New Zealand started in the early 20th century with the analysis of samples of the 1907–9 British Antarctic Expedition led by Shackelton sent
by James Murray to Eugène Penard (Penard, 1911). Later
Hoogenraad and De Groot (1948)andVan Oye (1956) pro-vided further taxonomic information on testate amoebae in
New Zealand.Van Oye (1956) provided hand drawn
illus-trations of various species, with basic dimensions, ranging
from 20 to 192m in length. While these illustrations are
extremely valuable, they are less informative, particularly for the smaller tests than more recent high-resolution
pho-tomicrographic images.Stout (1958, 1960,1978,1984) later
explored the micro-fauna of various agricultural soils, grass-land and tussocks in New Zeagrass-land. Several testate amoebae were identified and linked with soil types; however, no illus-trations of the tests were provided. The testate amoebae checklist for New Zealand was further updated with the devel-opment of a training set from surface bog samples spanning
the North and South Islands byCharman (1997). Sub-fossil
tests from peatlands were then successfully used to recon-struct past hydrological conditions from two southern bogs (McGlone and Wilmshurst 1999; Wilmshurst et al. 2003,
2002). The latest work showed that New Zealand peatlands
contained a diversity of cosmopolitan as well as
character-istic large southern endemic taxa (McGlone and Wilmshurst
1999; Wilmshurst et al. 2003, 2002) and that many sites have a high abundance of small taxa. In the New Zealand testate
amoebae training set (Charman, 1997), 20 out of the 62
sam-ples in this study had a community composition where over 75% of the assemblages were composed of small
morpho-types. These small taxa have shown dramatic fluctuations in relative abundance within peat cores suggesting they are
sen-sitive to changing hydrological conditions (Wilmshurst et al.
2003). Small testate amoebae have also been shown to be
compositionally dominant in some New Zealand peat cores,
for example making up∼67% of the total assemblage in a
Holocene peat core taken from Eweburn Bog in the South
Island (Wilmshurst et al. 2002).
Small New Zealand testate amoebae are largely composed
of agglutinated xenosomes.Charman (1997)noted the high
abundance of these taxa in New Zealand peatlands and iden-tified them as: Difflugia Type A, Difflugia Type B, Difflugia Type Wilmshurst et al. (2002, 2003) later identified these agglutinated types as Pseudodifflugia fulva (D. type A), Dif-flugia pulex (DifDif-flugia type B), DifDif-flugia pristis (D. type C). Our study builds on this work by exploring the potential value of identifying these tests to the highest possible taxonomic level possible (using a light microscope). Such taxonomic improvements may enhance the value and ecological appli-cation of testate amoebae by providing more information on species relationships with environmental conditions, and thereby potentially increasing the reliability of predictive models.
The objective of this study is to assess the importance of
small taxa (<45m long) as environmental indicators in New
Zealand peatlands. We test how (a) lumping small taxa into broad morphotypes, and (b) including or excluding them, influence their use as environmental indicators. We hypothe-sise that greater environmental information could be attained by making the effort to identify the smaller morphotypes to the highest possible taxonomic resolution. Several outcomes are possible from this study: (1) small taxa are too difficult to resolve to species level and too unreliable to provide any meaningful ecological information and would be best left uncounted, (2) small taxa do provide useful information, but this information is also provided more easily by larger taxa with similar environmental relationships; meaning they can be lumped with similar morphotypes (or ignored) to speed up counting time, (3) small taxa provide useful complemen-tary information to the larger taxa (e.g. they are sensitive to other ecological gradients or correspond to other ecological functions).
Our goal is not to conduct a taxonomic revision of the small testate amoebae living in peatlands – this is beyond the scope of this paper – but to assess the bioindication value of these taxa with a taxonomic resolution that can be achieved using light microscopy alone, and hence is applicable to ecological and palaeoecological studies.
Materials and Methods
Study sites
The New Zealand archipelago is in the South Pacific
Ocean, spanning latitudes 34◦–47◦south. The largest island,
the South Island, is characterised by the Southern Alps moun-tain range that runs along the length of the island (maximum altitude 3724 m a.s.l.), creating a steep climatic gradient between the western and eastern sides of the South Island. New Zealand lies within the Southern Hemisphere tempera-ture zone. Prevailing westerlies winds dominate the weather system, which sometimes abate allowing air from either polar or tropical regions to reach the country (Macara, 2018). Tem-peratures are relatively mild, and rainfall is greatest in the winter months and drier conditions are typically observed in late-summer and early autumn (Macara, 2018). Mois-ture laden air masses that pass over the Southern Ocean can
provide up to >10 m yr−1 to the West Coast through
oro-graphic rainfall, with lower rainfall in coastal regions (c.
2000–3500 mm yr−1)(Macara, 2016). Temperatures in
low-land areas of the West Coast are mild throughout the year
(annual range between 0 and 25◦C) and have a median annual
temperature of between 11◦C and 13◦C (Macara, 2016).
The resulting superhumid and mesothermal climate of the
West Coast (Hessel, 1982) provides excellent conditions for
wetland development.
It is estimated that 10% of the New Zealand mainland was covered by wetlands before human arrival around 750 cal. yr BP (Ausseil et al., 2011; McGlone, 2009). Although the early indigenous M¯aori settlers caused extensive deforestation of
dryland forests by burning (Argiriadis et al., 2018; McWethy
et al., 2010), wetland extent was minimally affected until after European arrival (1800s) when wetland loss
accel-erated rapidly for development and agriculture (McGlone,
2009). In the last 160 years, logging, fires and drainage have
reduced wetland extent to less than 10% of its original cover
making wetland ecosystems highly-threatened (Robertson
et al., 2015). The most significant loss of wetlands occurred between 1920 and 1980 due to fragmentation and drainage (Taylor and Smith, 1997) to make way for large-scale agricul-tural activities. The least impacted wetlands in New Zealand are now found in the relatively undeveloped and high-rainfall
West Coast region of the South Island (Clarkson et al., 2013).
Field sampling
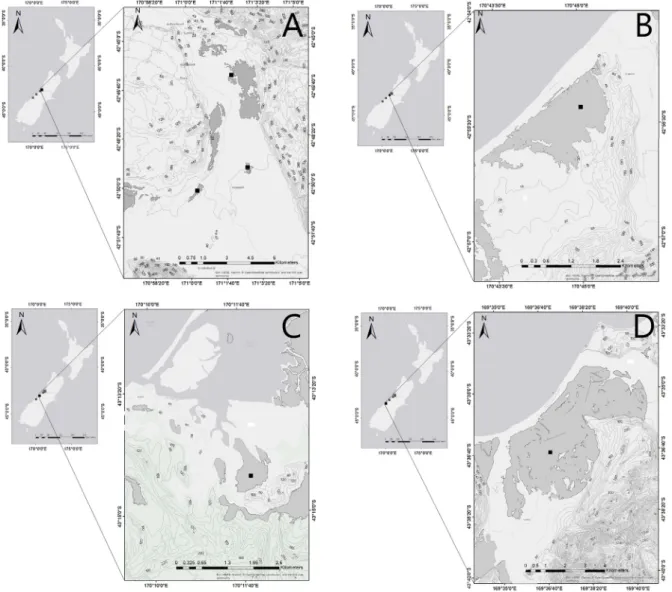
Six wetlands were selected for our study from the West Coast of the South Island of New Zealand, including three bog systems that were highly to moderately impacted, and three
that were relatively non-impacted (Fig. 1;Table 1).
Anthro-pogenic impacts on wetland condition were assessed using
the New Zealand Ecological Integrity Index (EII) (Ausseil
et al., 2011). This index is a useful tool to place New Zealand wetland conditions in a national perspective. Six human-induced impacts are measured under the EII, includ-ing: impervious cover such as urbanisation and roading, nitrate leaching risk, introduced fish, woody weeds, reduced naturalness of the land, and drainage. EEI is ranked 1–0, where 0 indicates complete loss of biodiversity and associated ecological function and 1 indicates pristine (non-impacted)
Fig. 1. Maps showing the location of the study sites in New Zealand. A: Hokitika 1–3 (Hokitika 1 is the northernmost site and Hokitika 3 the southernmost), B: Shearer, C: Okarito, D: Bruce Bay. Contour lines: 20 m intervals.
conditions; of the remaining wetlands in New Zealand, 60%
have an EII < 0.5 (Ausseil et al., 2011). Our three impacted
wetlands had EEI scores ranging from 0.28 to 0.65, compared with the three relatively unimpacted wetlands which ranged
from 0.72 to 0.87 (Tables 1 and 2).
Within each bog, three samples were taken to represent a range of micro-topographical conditions including
hum-mocks, hollows and lawns (Table 2). Each sample was
arbitrarily chosen from within a randomly selected 5× 5 m
plot. A long knife was used to shorten the living vegetation layer before sampling. The knife was then driven into the sur-face carpet and a 20-cm deep intact monolith was extracted, inspected and sectioned at the near surface peat to capture the living section of the carpet and the top 0.5 cm of sur-face peat. This was done to ensure that only modern testate amoeba communities were captured. In all micro-sites, depth to water table (accuracy to 1 mm), pH (accuracy to 0.1), and
conductivity (accuracy to 0.01 mS) were measured (Table 2).
Depth to water table was from either the top of the moss or the top of the peat, depending on site vegetation and conditions.
Testate amoebae extraction and analysis
To extract testate amoebae, approximately 30 g of the sur-face vegetation and near sursur-face peat was weighed, placed in a clean sealed container and shaken in tap water for at least 2 min with occasional stirring. The material was then sieved
through a 150m mesh to separate larger material from the
sample and then over a 20m mesh to remove fine particles.
The 20–150m fraction was then recovered in a 50-ml
cen-trifuge tube, cencen-trifuged at 3000 rpm for 3 min to concentrate the tests and the pellet transferred to a 2-ml vial to which 75% ethanol was added to preserve the samples.
Amoeba tests were counted and identified at 200–600× magnification up to a minimum of 120 individuals per sample. As we were interested in comparing the bioindication value of
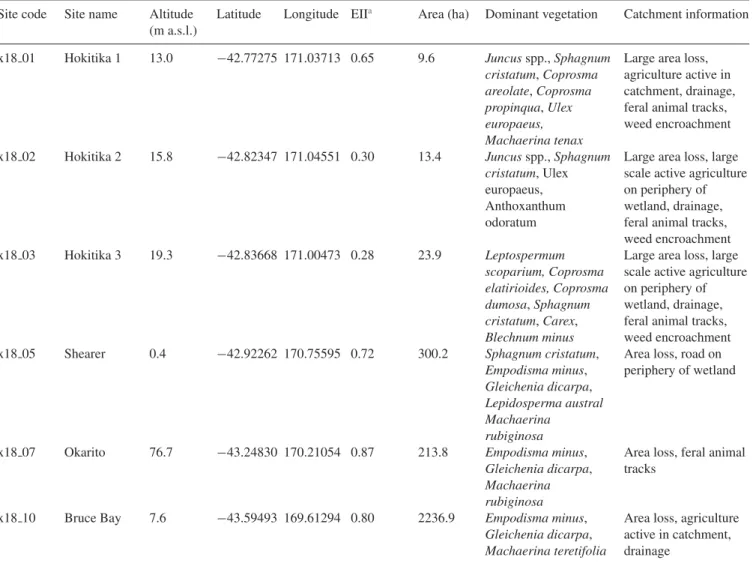
Table 1. Site and catchment information for bogs sampled for surface testate amoebae in this study. Site code Site name Altitude
(m a.s.l.)
Latitude Longitude EIIa Area (ha) Dominant vegetation Catchment information
x18 01 Hokitika 1 13.0 −42.77275 171.03713 0.65 9.6 Juncus spp., Sphagnum cristatum, Coprosma areolate, Coprosma propinqua, Ulex europaeus, Machaerina tenax
Large area loss, agriculture active in catchment, drainage, feral animal tracks, weed encroachment x18 02 Hokitika 2 15.8 −42.82347 171.04551 0.30 13.4 Juncus spp., Sphagnum
cristatum, Ulex europaeus, Anthoxanthum odoratum
Large area loss, large scale active agriculture on periphery of wetland, drainage, feral animal tracks, weed encroachment x18 03 Hokitika 3 19.3 −42.83668 171.00473 0.28 23.9 Leptospermum scoparium, Coprosma elatirioides, Coprosma dumosa, Sphagnum cristatum, Carex, Blechnum minus
Large area loss, large scale active agriculture on periphery of wetland, drainage, feral animal tracks, weed encroachment
x18 05 Shearer 0.4 −42.92262 170.75595 0.72 300.2 Sphagnum cristatum,
Empodisma minus, Gleichenia dicarpa, Lepidosperma austral
Area loss, road on periphery of wetland
Machaerina rubiginosa
x18 07 Okarito 76.7 −43.24830 170.21054 0.87 213.8 Empodisma minus,
Gleichenia dicarpa, Machaerina rubiginosa
Area loss, feral animal tracks
x18 10 Bruce Bay 7.6 −43.59493 169.61294 0.80 2236.9 Empodisma minus, Gleichenia dicarpa, Machaerina teretifolia
Area loss, agriculture active in catchment, drainage
aEII = Ecological Integrity Index. Ranked 1-0, where 0 indicates complete loss of biodiversity and associated ecological function and 1 indicates pristine
conditions.
least 50 tests of each of these two categories. We did not reach
the 50 count for the small taxa in four samples (Table 2). Light
microscopy photographs of all morphotypes were taken in broad view and morphometric features measured. Specimens were identified to the highest possible taxonomic level using
several general keys and monographs including (Charman
et al., 2000; Corbet, 1973; Deflandre, 1936; Hoogenraad and De Groot, 1948; Leidy, 1879; Mazei and Tsyganov, 2006; Ogden and Hedley, 1980; Penard, 1902; Van Oye, 1956).
Numerical analyses
The community patterns and community-environment relationships were compared among the sites. Statistical analysis was carried out in R version 3.4.4 (R-Core-Team
2018) using the package vegan 2.4.5 (Oksanen et al., 2013).
Species richness and Shannon Diversity indices were cal-culated and plotted for each site. The relationships between the amoeba communities and the three environmental
vari-ables that were measured at each sampling site, depth to water table (DWT), pH and conductivity, were explored using prin-cipal component analysis (PCA) and Pearson correlations to determine if any significant relationships existed between the site variables. We then investigated the correlation of species richness, Shannon Diversity, and the percentage abundance
of <45m taxa with these environmental variables using
generalised additive models (GAM). Such models allow
the discrimination of non-linear relationships (Guisan et al.,
2002) between the diversity metrics of small amoebae or the
entire community and the environmental variables. The hum-mock sample from Hokitika 3 was removed from this analysis as it was considered an outlier due to a much higher con-ductivity reading from this one site compared to the other samples.
Non-metric Multi-Dimensional Scaling (NMDS) was car-ried out using the Bray–Curtis dissimilarity index to identify the dominant community patterns. Relative abundance data of testate amoebae was subjected to redundancy analysis (RDA) to quantify the correlation between testate amoeba
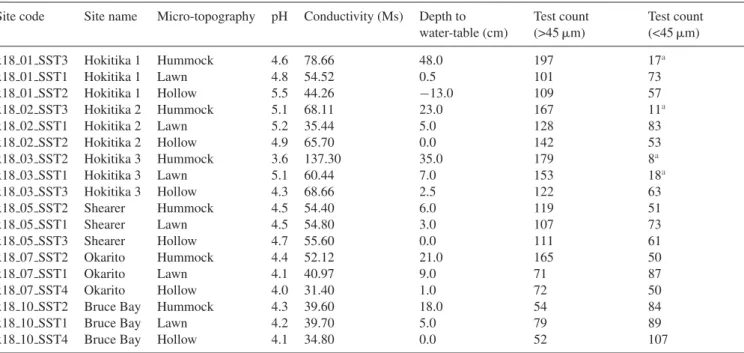
Table 2. Surface sample information for each micro-topographical location. Negative water-table values indicate the height of surface ponding. Site code Site name Micro-topography pH Conductivity (Ms) Depth to
water-table (cm) Test count (>45m) Test count (<45m) x18 01 SST3 Hokitika 1 Hummock 4.6 78.66 48.0 197 17a x18 01 SST1 Hokitika 1 Lawn 4.8 54.52 0.5 101 73 x18 01 SST2 Hokitika 1 Hollow 5.5 44.26 −13.0 109 57 x18 02 SST3 Hokitika 2 Hummock 5.1 68.11 23.0 167 11a x18 02 SST1 Hokitika 2 Lawn 5.2 35.44 5.0 128 83 x18 02 SST2 Hokitika 2 Hollow 4.9 65.70 0.0 142 53 x18 03 SST2 Hokitika 3 Hummock 3.6 137.30 35.0 179 8a x18 03 SST1 Hokitika 3 Lawn 5.1 60.44 7.0 153 18a x18 03 SST3 Hokitika 3 Hollow 4.3 68.66 2.5 122 63 x18 05 SST2 Shearer Hummock 4.5 54.40 6.0 119 51 x18 05 SST1 Shearer Lawn 4.5 54.80 3.0 107 73 x18 05 SST3 Shearer Hollow 4.7 55.60 0.0 111 61 x18 07 SST2 Okarito Hummock 4.4 52.12 21.0 165 50 x18 07 SST1 Okarito Lawn 4.1 40.97 9.0 71 87 x18 07 SST4 Okarito Hollow 4.0 31.40 1.0 72 50
x18 10 SST2 Bruce Bay Hummock 4.3 39.60 18.0 54 84
x18 10 SST1 Bruce Bay Lawn 4.2 39.70 5.0 79 89
x18 10 SST4 Bruce Bay Hollow 4.1 34.80 0.0 52 107
aSamples where we did not enumerate at least 50 tests.
community composition and the three environmental vari-ables, and the significance of these correlations were assessed using Monte Carlo permutation tests (999 unrestricted per-mutations). The species data were transformed prior to
analysis by the Hellinger distance technique (Rao, 1995).
Both analyses were carried out on four species matrices: a) the whole community with high taxonomic resolution of
small taxa (<45m in length);
b) whole community with low taxonomic resolution of small taxa, i.e., where smaller species were grouped into two morphotypes: (i) agglutinated xenosomes (e.g. small Difflugia, Schoenbornia, Pseudodifflugia fulva, Phry-ganella paradoxa etc.), and (ii) siliceous idiosomes (e.g. Corythion, Euglypha spp., Sphenoderia, etc.). This mor-photype grouping was selected as the availability of material and/or the higher cost of self-secretion can con-strain species distribution;
c) only the large taxa (>45m in length);
d) only the small taxa (<45m in length); with high
taxo-nomic resolution.
Results
DWT ranged from -13 (surface sample was 13 cm below the water table) to 48 cm. Conductivity ranged from 31.40 to 137.30 mS, with an average of 56.47. pH ranged from
3.6 to 5.5 (Table 2). The value of the EII index across
all sites ranged from 0.28 to 0.80, with the former indi-cating highly impacted and the latter indiindi-cating the least (Table 1). The highly-impacted sites, Hokitika 2 (EII = 0.30) and Hokitika 3 (EII = 0.28), and the moderately impacted
site, Hokitika 1 (EII = 0.65), all showed a larger range in DWT across the micro-topographical sites compared to
the non-impacted sites (Tables 1 and 2). The impacted
sites were also characterised by higher pH and
conductiv-ity (Table 2). The non-impacted sites, Shearer (EII = 0.72),
Okarito (EII = 0.87), and Bruce Bay (EII = 0.80) all had pH readings less than 4.75 and conductivity was less than 56 mS. Impacted sites also had notable encroachment of woody
veg-etation on the peatland (Table 1).
The Principal Component Analysis (PCA) applied to the environmental data measured at each site provides a general
overview of the pattern of change between sites (Fig. 2a).
PCA axis 1 explains 85.5% of the variance in the data; PCA axis 2 explains a further 14.5%. These axes are most closely related with vectors representing conductivity and DWT, respectively. Samples from hummocks are loading negatively on the conductivity and pH vectors in the biplots, and samples
from the lawn and hollow tend to load positively (Fig. 2a).
The impacted sites (both highly and moderately modified) are more spread in the ordination biplot compared to the sites with a higher ecological integrity index, which appear more clustered. Impacted sites are consistently aligned along the conductivity and pH gradients, having higher conductivity
and pH measurements (Fig. 2b). Impacted sites have a larger
range in all three variables, with samples from less impacted sites clustered together in all biplots. Conductivity and DWT are the only variables significantly correlated across all sites (r = 0.48, p = 0.05), where increasing conductivity is
posi-tively related to increasing DWT (Fig. 2b). This appears to
be driven by the impacted sites (r = 0.67, p = 0.072). Our data also shows a weak positive relationship between pH and conductivity across all sites (r = 0.31, p = 0.22). However,
Fig. 2. (a) Bai-plot of principal component analysis (PCA) of samples from impacted (black symbols) and non-impacted (grey symbols) sites classified by microtopography. Environmental variables depth to water table (DWT), pH and conductivity were passively projected in the ordination space. (b) Sbcatter plots of conductivity vs. Ph, DWT vs. Ph, and DWT vs. conductivity. Correlation coefficients presented in black is for all sites, green is for non-impacted sites and orange is for impacted sites. ***p < 0.001, **p < 0.01, *p < 0.05. (For interpretation of the references to colour in this figure legend, the reader is referred to the web version of this article.)
non-impacted sites show a strong correlation between the two variables, where decreasing acidity is positively related
to increasing conductivity (r = 0.94, p < 0.001) (Fig. 2b);
whereas, the impacted sites show a contradictory
relation-ship (r =−0.67, p < 0.071). The disassociated here could be
related to movement of water in the peatlands facilitated by drainage in the impacted sites.
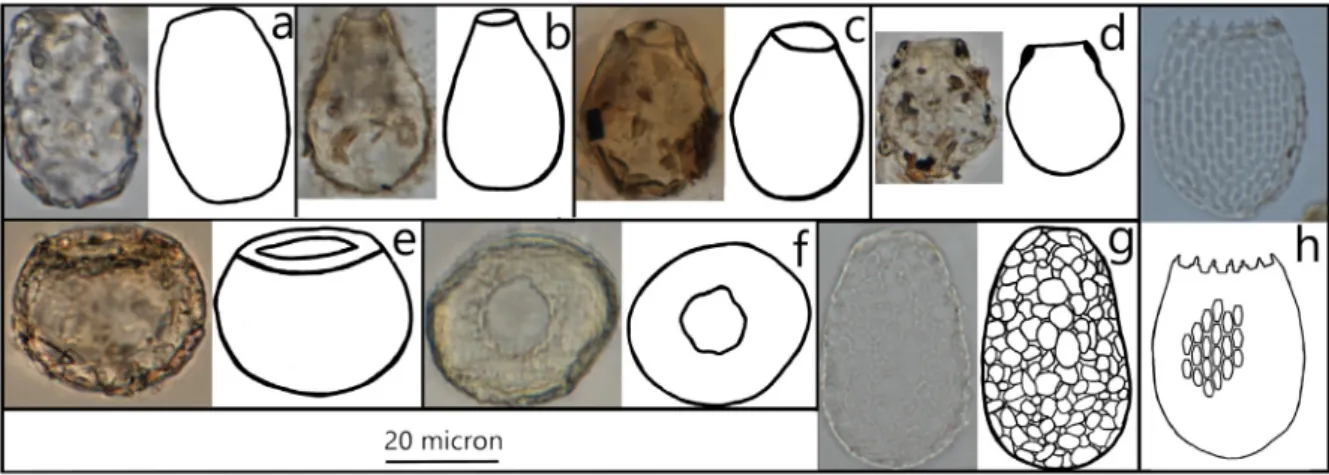
Detailed observations of small (<45m) testate
amoe-bae revealed the existence of multiple taxa within the 18
samples (Fig. 3). The smaller testate amoebae were named
only when we were confident that the observed speci-mens matched the taxonomic descriptions; however, we consider these identifications as tentative given the current state of taxonomic knowledge. We identified Difflugia pristis (Penard, 1902), Difflugia pulex (Penard, 1902), Pseudodif-flugia fulva (Archer, 1870), Phryganella paradoxa (Penard,
1902), Sphenoderia fissirostris (Penard, 1890),
Schoenbor-nia humicola (Schönborn et al., 1987), Corythion dubium (Taranek, 1871), Euglypha dolioformis (Bonnet and Thomas,
1959), Euglypha rotunda (Wailes and Penard, 1911),
Eug-lypha simplex (Coûteaux et al., 1979). Three taxa were not found to match available descriptions and are referred to as
morphotype A, B, and C for this study (Fig. 3).
In the GAM, species richness and diversity were both
neg-atively, although weakly, correlated with DWT (r2= 0.25,
p = 0.02, and r2= 0.38, p < 0.01, respectively,Fig. 4);
high-est values were observed in the 0–10 cm DWT range, while diversity was lower in hummocks. Diversity patterns in rela-tion to pH and conductivity were less clear. The percentage of smaller morphotypes was negatively correlated to DWT
(r2= 0.43, p = 0.02) and conductivity (r2= 0.37, p < 0.01).
Interestingly, the proportion of small taxa was lower than the overall average in most samples from impacted sites; a high proportion of small taxa thus seems to be indicative of less impacted sites.
All four NMDS ordinations (Fig. 5a–d) show a clear
divi-sion between impacted and less-impacted sites regardless of the data matrix used; the centroid of the two categories do not overlap except for the ordination scenario of species less than
45m in length where they overlap slightly (Fig. 5d). By
con-trast, the three habitats (hummocks, lawns, hollows/pools) were not clearly separated in any of the four ordinations, except for hummocks in the less-impacted sites for all but the NMDS of small taxa alone.
In the NMDS ordination of the whole community at high
taxonomic resolution (Fig. 5a), the samples from impacted
and non-impacted sites are clearly spread across Axis 1, and to a lesser extent Axis 2. The only evident pattern among the micro-topographical habitats is observed in the hummock microenvironments in the non-impacted sites; here, the hum-mock samples are clustered together in the ordination space in all NMDS analyses. While the overall percentage of small
Fig. 3. Light microscope pictures of agglutinated testate amoebae <45m in length from peatlands from the west coast of the South Island of New Zealand. Each morphotype image is complemented with an outline of test shape. a = Difflugia pristis, b = Difflugia pulex, c = Pseudodifflugia fulva, d = Phryganella paradoxa, e = morphotype A, f = morphotype B, g = Schoenbornia humicola, h = Euglypha dolio-formis. All images of taxa are in lateral view, apart from morphotype B (f), which is flattened and in planar view.
taxa seemed to be indicative of less impacted sites, not all taxa follow this pattern. Indeed, in the NMDS, the small agglutinated taxa, most notably D. pristis, D. pulex, Phry-ganella paradoxa, and morphotype B, tend to be associated with non-impacted sites while small siliceous species, such as E. simplex and E. rotunda, are associated with the impacted
sites (Fig. 5a,b, and d).
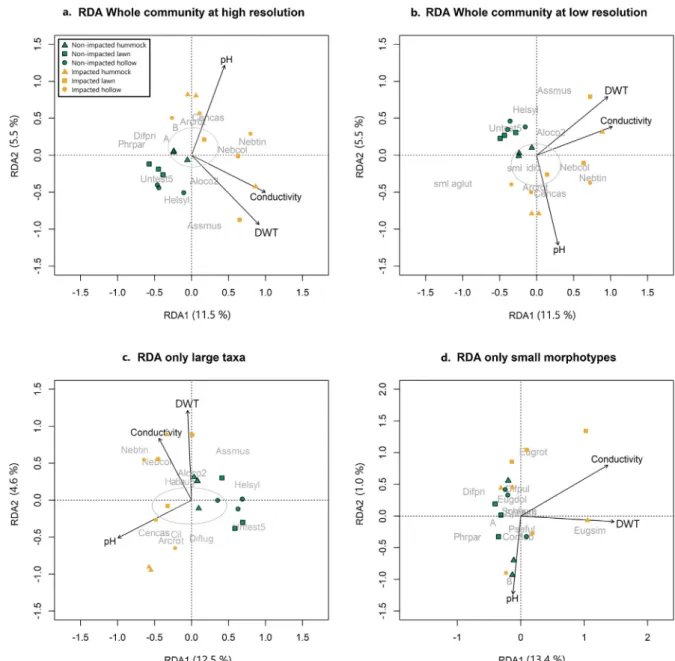
In the RDA ordinations of whole community with high and low taxonomic resolution of small taxa, and of only large
taxa (Fig. 6a–c), the impacted and non-impacted sites are
well separated across the ordination space. However, in the
analysis of small taxa alone, the two groups overlap (Fig. 6d).
In all ordinations, the non-impacted sites are more grouped than the impacted sites. The RDA of the whole community at a high taxonomic resolution revealed significant
correla-tion with all three variables (Table 3). Axis 1 and 2 jointly
accounted for 50.1% of the variance in the data. The RDA sample biplot shows that conductivity accounted for most of the variance, followed by pH and DWT. The biplot for the whole community shows that impacted sites are more spread across Axis 1 and 2 in comparison to the non-impacted sites (Fig. 6a), and that there is a clear separation of impacted and non-impacted sites. Samples from the impacted sites are load-ing positively on the pH vector, while almost all samples from the non-impacted sites are loading negatively. This appears to be largely driven by positive relationship of Centropy-xis cassis-type and Arcella rotundata to higher pH values and the preference for Assulina muscorum and Heleopera sylvatica to more acidic conditions. Samples from the hum-mock microenvironments in the impacted sites are loading positively on the DWT and conductivity vectors. Here, we observe a negative relationship of small agglutinated morpho-types to DWT and conductivity, most notably D. pristis and P. paradoxa (Fig. 4). When each variable was independently constrained to Axis 1, all three variables showed a significant relationship with the whole community, with DWT
show-ing the greatest variance (15.3%), followed by conductivity
(14.6%) and pH (11.2%) (Table 3).
For the scenario where we examine the whole commu-nity where the smaller taxa are lumped into two groups based on their test composition, i.e., agglutinated xeno-somes or siliceous idioxeno-somes, the RDA for Axis 1 & 2 showed that all three environmental variables accounted for 50.7% of the variance in the data. When each variable was independently constrained to Axis 1, DWT accounted for 19.7% of the variance, followed by conductivity (19.1%) and pH (12.8%). In the biplot, the samples are spread across both axes; however, samples associated with non-impacted sites are loading negatively along the pH vector, while the samples from the impacted sites are more spread out and loading positively. The lumped small agglutinated morphotypes are negatively related to the DWT and con-ductivity, while A. muscorum, Nebela tincta, Nebela collaris and Alocodera cockayni are positivity related to these three vectors.
For the amoebae data matrix including only large taxa, Axis 1 & 2 accounted for 49.4% of variance in the data (Axis
1 = 12.9%, Axis 2 = 4.6%) (Table 3; Fig. 6c). When each
variable was independently constrained to Axis 1, pH was the only variable to show a significant relationship with the variance explaining 16.2%. The impacted and non-impacted samples are spread across Axis 1, with the impacted sites in the general model located to the left of the bi-plot and the non-impacted sites to the right. Samples from impacted sites are more spread across Axis 2, which is largely driven by DWT and conductivity.
Ordination of the data matrix containing only the smaller taxa, showed all three variables accounted for 50.7% of
vari-ance in the data (Axis 1 = 13.4%, Axis 2 = 1.0%) (Table 3;
Fig. 6d). The biplot for the smaller taxa does not show the clear division between impacted and non-impacted sites observed in the other biplots. It is evident that the agglu-tinated taxa are negatively related to increasing DWT, most
Fig. 4. Smooths of generalised additive models (GAM) terms showing the inferred effect of various variables on (a) testate amoebae species richness of the whole community at a high resolution, (b) testate amoebae species diversity of the whole community at a high resolution, (c) only the percentage of small morphotypes. Locations of observations are shown as vertical lines on the x-axes. Solid lines are estimates of the smooths, shaded areas are standard errors of the estimated smooths, and points of the observation partial residuals. The hummock sample from Hokitika 3 was removed from this analysis as it was considered an outlier due to a much higher conductivity reading.
notably D. pristis, P. paradoxa, morphotypes A, and B, while E. simplex is largely separated from the rest of the taxa and is positively related to the DWT vector. When each variable was solely constrained to Axis 1, the percentage of vari-ance explained increased to 27.0% for DWT, and 23.9% for conductivity.
Discussion
This is the first study, to our knowledge, exploring the value of small testate amoebae as bioindicators in bog
envi-Fig. 5. Bi-plot of the two primary axes of the three-dimensional NMDS ordination of testate amoebae from four different community matrices. Samples are coded by microtopography and impact status. The broken line indicates the centroid of the community from the impacted sites and the solid line represents the centroid of the community from the non-impacted sites. Matrices are as follows: (a) NMDS bi-plot of the whole community where the small (less than 45m in length) testate amoebae are identified to a high taxonomic resolution, (b) NMDS bi-plot of the whole community where the small testate amoebae have been lumped into two groups (i) agglutinated (sml aglut), (ii) siliceous (sml idio). (c) NMDS bi-plot of only the large taxa, d. NMDS bi-plot of only the small morphotypes identified to a high taxonomic resolution. Testate amoe-bae abbreviations are as follows: Alabasta flabellulum type = Alafla, Alabasta militaris = Alamil, Alocodera cockayni (wider test) = Aloco1, Alocodera cockayni = Aloco2, Amphitrema wrightianum = Ampwri, Apodera vas (wide) = Apova1, Apodera vas (keel) = Apova2, Apodera vas (regular) = Apova3, Arcella rotundata = Arcrot, Argynnia caudata = Argcau, Argynnia dentistoma = Argden, Assulina muscorum = Assmus, Assulina seminulum = Asssem, Centropyxis aculeata = Cenacu, Centropyxis aerophila aerophila = Cenaae, Centropyxis aerophila sphag-nicola = Cenasp, Centropyxis cassis type = Cencas, Centropyxis constricta = Censtr, Centropyxis platystoma = Cenpla, Certesella type 1 = Cercer, Certesella type 2 = Certy2, Certesella type 3 = Cermar, Corythion constricta = Corcon, Corythion dubium = Cordub, Cyclopyxis arcelloides type = Cenarc, Cyphoderia = Cyp, Difflugia undif = Difund, Difflugia bacillariarium = Difbaa, Difflugia elegans = Difele, Difflu-gia globulosa = Difglo, DiffluDifflu-gia leidyi type = Diflei, DiffluDifflu-gia lucida = Difluc, DiffluDifflu-gia oblonga = Difobl, Euglypha compressa = Eugcom, Euglypha dolioformis = Eugdol, Euglypha rotunda = Eugrot, Euglypha simplex = Eugsim, Euglypha strigosa = Eugstr, Habotrocha augus-ticollis (a bdelloid rotifer) = Habaug, Heleopera petricola = Helpet, Heleopera rosea = Helros, Heleopera sphagni = Helsph, Heleopera sylvatica = Helsyl, Heleopora petricola = Helpet, Heleopora petricola var amethystea = Helpet 1, Nebela penardiana var minor = Nebpem, Nebela collaris complex = Nebcol, Nebela tincta = Nebtin, Padaungiella lageniformis = Padlag, Padaungiella tubulata = Padtub, Padaungiella wailesi = Padwai, Phryganella acropodia I = Phrac1, Phryganella paradoxa = Phrpar, Physochila griseola = Phygrc, Quadrulella symmet-rica = Quasym, Sphenoderia fissirostris = Sphfiss, Unidentified test 5 = Untest5, Cothurnia (Vaginicolidae) = Cil, Difflugia pristis = Difpri, Difflugia pulex = Difopul, Pseudodifflugia fulva = Pseful, Schoenbornia humicola = Schhum, morphotype A = A, morphotype B = B.
Fig. 6. Bi-plot of the two primary axes of the three-dimensional redundancy analysis (RDA) of testate amoebae from four different community matrices, which are the same asFig. 5. DWT = Depth to water-table. Samples are coded by microtopography and impact status. The grey circles around the centroid represent taxa that were clustered here and were thus removed for clarity.
ronments. Most of the work on peatland testate amoebae has been undertaken on Northern Hemisphere Sphagnum
bogs (Amesbury et al., 2016; Booth and Zygmunt, 2005;
Charman et al., 2004; Gałka et al., 2017; Lamentowicz et al., 2008; Mitchell et al., 1999; Swindles et al., 2010). In these ecosystems, the smaller taxa such as Difflugia pulex, Cryptodifflugia oviformis, and small Euglyphida (Trinema, Corythion, Euglypha rotunda-type) are generally associated
with dry conditions (Caseldine and Gearey, 2005). In New
Zealand, the main peat formers are the restiads Empodisma minus and E. robustum in the North Island; and graminoids, E. minus, and Sphagnum spp. in the South Island (McGlone
2009). Here, the smaller Difflugia A type and Difflugia B type
(Charman, 1997), later identified as Pseudodifflugia fulva
and D. pulex species, respectively (Wilmshurst et al., 2002),
are associated with wetter conditions in surface peat samples (Charman 1997). Our study further confirms the association of these two small taxa with high water tables. A similar
pattern has also been observed in Patagonia (Van Bellen
et al., 2014). However, a testate amoeba-based reconstruction spanning the Holocene in the South Island of New Zealand suggests that D. pulex can be abundant in communities where taxa typical of drier conditions are dominant, such as A. mus-corum, Alocodera (formerly Nebela) cockayni (Wilmshurst et al., 2003). This has raised the complexity around the fac-tors at play influencing the ecology of these small taxa and
their palaeoecological potential.Charman et al. (2007)
T able 3. Ordination statistics from RD A. V ariable Whole community small tests high res Only morphotypes >45 m Only morphotypes <45 m Whole community small tests lo w res λ 1 λ 1/ λ2 % v ariance λ 1 λ 1/ λ2 % v ariance λ 1 λ 1/ λ2 % v ariance λ 1 λ 1/ λ2 % v ariance D WT , pH and conducti vity 0.12 0.06 50.1 *** 0.13 0.05 49.4 *** 0.12 0.01 50.7 ** 0.12 0.06 55.5 *** V ariables constrained to Axis 1 λ 1 % v ariance λ 1 % v ariance λ 1 % v ariance λ 1 % v ariance D WT 0.08 15.3 *** 0.05 7.6 0.11 27.0 ** 0.09 19.7 ** pH 0.06 11.2 * 0.1 16.2 *** 0.01 2.0 0.06 12.8 * Conducti vity 0.08 14.6 ** 0.05 8.2 0.1 23.9 ** 0.08 19.1 ** P significance le v el for Monte Carlo permutation tests (999 unrestricted permutations). *** P< 0.001. ** P< 0.01. *P< 0.05.
are associated with shallow water tables in surface samples but can also survive, and dominate in, periods of
desicca-tion. Indeed,Wilmshurst et al. (2003)found that the period
of highest D. pulex abundance occurred during a period of marked alternations of wet and dry conditions brought on by
increasing ENSO variation.Sullivan and Booth (2011)
fur-ther corroborate these findings and suggest that D. pulex and P. fulva are more abundant under highly variable moisture conditions and are closely associated with short-term envi-ronmental variability. Thus, small taxa can reveal additional environmental information for ecological and palaeoecolog-ical research, and that (pseudo)cryptic taxa may be restricted to specific conditions/habitats, which was recently shown for
the larger-sized Nebela tincta group (Singer et al., 2018).
Our results show that there is greater heterogeneity of testate amoeba communities in micro-topographical gradi-ents from the impacted sites compared to the non-impacted sites. The latter have been drained, fragmented, suffered notable area loss, have large-scale agricultural activities in the surrounding catchment, along with the encroachment of woody-weedy vegetation. Thus, it is not surprising that the environmental measurements and a change in amoebae assemblage is evident between impacted and non-impacted sites. However, what is interesting, is the possible impact this may have on test size.
There is a general correlation between test size and trophic position, and more specifically the size of aperture: testate amoebae with a small aperture size mainly feed on bac-teria, fungi, algae and small heterotrophic protists such as flagellates, whereas species with a larger aperture size pref-erentially feed on larger protists and micro-metazoans such
as rotifers and nematodes (Gilbert et al., 2003; Jassey et al.,
2012; Mitchell et al., 2000).Wu et al. (2017)state that native wetlands and drained wetlands reclaimed to farmland have different microbial community structure and composition with a higher ratio of fungi to bacteria in the drained wet-lands and such a contrast was also observed in comparative
study of five European Sphagnum peatlands (Mitchell et al.,
2003). In our dataset, impacted and non-impacted sites appear
to be segregated by pH when samples are constrained to all three environmental variables in the RDA ordinations in the scenarios with (1) the whole community where small taxa are identified to a high taxonomic resolution, (2) the whole com-munity where small taxa are grouped into two categories (low taxonomic resolution), and (3) only large species. The RDA of small taxa only does not show this pattern and the amoeba communities are largely driven by changes in DWT and
con-ductivity, which are positively related in our dataset (Fig. 2b).
This relationship is particularly strong in the impacted sites, where deeper water table is significantly related to higher conductivity. The small agglutinated taxa, most notably D. pristis, D. pulex, P. paradoxa, and morphotypes A, and B,
tend to be associated with wetter conditions (Fig. 6d), and are
more abundant in samples from non-impacted sites (Fig. 5d);
although they are present in impacted sites. This is in con-trary to the small siliceous taxa, such as E. simplex and
E. rotunda, which are more closely associated with deeper
water tables in impacted sites (Figs.5a & b, and6a & b).
The lower percentage of smaller amoebae, particularly the agglutinated taxa, in impacted sites (more minerogenic, less acidic bogs, with deeper water tables), may be connected to food-web interactions. This change could be related to a reduction in available bacteria and increase in availability of larger prey (including bacterial grazers keeping bacterial pop-ulations in check). This would favour larger testate amoeba species over smaller ones. However, the exact mechanism between the notable change in testate amoeba assemblages across micro-environmental gradients between impacted and non-impacted sites in New Zealand would deserve a more detailed study, and ideally experimental work to fully under-stand the functional implications of the observed patterns.
Conclusion
Our study builds on and advances previous research and suggests (1) that the general assumption that all small taxa are indicative for dry conditions is not entirely accurate and more complex factors may be at play, and (2) that the true diversity of these small taxa is likely to be much higher than currently believed. Our results demonstrate that identifying small testate amoebae to the highest possible taxonomic reso-lution can provide more informed environmental assessment of wetlands than by lumping them into groups or ignoring them. This study shows promising results for the use of testate amoebae as indicators of ecological integrity in New Zealand bogs. Testate amoebae community assemblages from wet-lands that have been highly impacted by human activities show a clear segregation from less impacted sites. The
per-centage of testate amoebae less than 45m decreases in
highly impacted sites and they are found in greater abun-dance in the wetter hollow and lawn micro-topographical environments, with clear horizontal gradient restrictions.
Despite the relatively low number of sites in this study, we have been able to clearly demonstrate that several dis-tinct small taxa were more strongly related to water table depth and conductivity, while the larger species were more strongly correlated to pH. We suggest the possibility of count-ing and identifycount-ing solely larger taxa, any tests greater than
45m, as an indicator of pH; and separately identifying all
taxa less than 45m to a high taxonomic resolution only, as
a tool for reconstructing hydrological conditions. This could be carried out at the preparation stage (sieving at two dif-ferent sizes) where both larger and smaller sized groups are counted separately.
Author contributions
Michelle M. McKeown is the lead author, she wrote the manuscript, carried out the testate amoebae analysis and statistical modelling. Edward A. D. Mitchell substantially helped with testate amoebae identification and statistical
analysis, along with project design. Clément Duckert pro-vided expertise on test identification. Janet M. Wilmshurst and Jamie R. Wood provided information on previous testate amoebae work in New Zealand, along with providing exper-tise to the introduction and discussion sections. All authors helped edit the manuscript and approve of the manuscripts submission to the Journal of European Protistology.
Acknowledgements
The authors would like to thank Alex Fergus for his assis-tance with peat coring. We acknowledge funding from The Ministry of Business, Innovation and Employment – Smart Ideas Programme (contract C09X1616: Wetland Assessment and Monitoring Tool (WAAM) – pre-human baselines for assessing, monitoring and restoring New Zealand’s wetland ecosystems) and Strategic Science Investment Funding for Crown Research Institutes from the New Zealand Ministry of Business, Innovation and Employment’s Science and Inno-vation Group. We highly appreciate the reviews by Graeme Swindles and an anonymous reviewer.
References
Amacker, N., Mitchell, E.A., Ferrari, B.J., Chèvre, N., 2018. Devel-opment of a new ecotoxicological assay using the testate amoeba
Euglypha rotunda (Rhizaria; Euglyphida) and assessment of
the impact of the herbicide S-metolachlor. Chemosphere 201, 351–360.
Amesbury, M.J., Swindles, G.T., Bobrov, A., Charman, D.J., Holden, J., Lamentowicz, M., Mallon, G., Mazei, Y., Mitchell, E.A., Payne, R.J., 2016.Development of a new pan-European testate amoeba transfer function for reconstructing peatland palaeohydrology. Quat. Sci. Rev. 152, 132–151.
Amesbury, M.J., Roland, T.P., Royles, J., Hodgson, D.A., Convey, P., Griffiths, H., Charman, D.J., 2017. Widespread biological response to rapid warming on the Antarctic Peninsula. Curr. Biol. 27, 1616–1622.e1612.
Argiriadis, E., Battistel, D., McWethy, D.B., Vecchiato, M., Kirch-georg, T., Kehrwald, N., Whitlock, C., Wilmshurst, J.M., Barbante, C., 2018.Lake sediment fecal and biomass burning biomarkers provide direct evidence for prehistoric human-lit fires in New Zealand. Sci. Rep. 8, 12113.
Ausseil, A.-G.E., Lindsay Chadderton, W., Gerbeaux, P., Theo Stephens, R., Leathwick, J.R., 2011.Applying systematic con-servation planning principles to palustrine and inland saline wetlands of New Zealand. Freshw. Biol. 56, 142–161.
Bamforth, S.S., 2015.Composition of soil testate amoebae com-munities: their structure and modifications in the temperate rain forests of New Zealand and Tasmania. J. Eukaryot. Microbiol. 62, 217–226.
Barnett, R.L., Newton, T.L., Charman, D.J., Gehrels, W.R., 2017. Salt-marsh testate amoebae as precise and widespread indicators of sea-level change. Earth Sci. Rev. 164, 193–207.
Beaulne, J., Magnan, G., Garneau, M., 2018.Evaluating the poten-tial of testate amoebae as indicators of hydrological conditions in boreal forested peatlands. Ecol. Indic. 91, 386–394.
Bhattacharya, D., Helmchen, T., Melkonian, M., 1995.Molecular evolutionary analyses of nuclear-encoded small subunit riboso-mal RNA identify an independent rhizopod lineage containing the Euglyphina and the Chlorarachniophyta. J. Eukaryot. Micro-biol. 42, 65–69.
Booth, R.K., Zygmunt, J.R., 2005. Biogeography and compara-tive ecology of testate amoebae inhabiting Sphagnum-dominated peatlands in the Great Lakes and Rocky Mountain regions of North America. Divers. Distrib. 11, 577–590.
Caseldine, C., Gearey, B., 2005.A multiproxy approach to recon-structing surface wetness changes and prehistoric bog bursts in a raised mire system at Derryville Bog, Co. Tipperary, Ireland. Holocene 15, 585.
Chardez, D., 1969. Le genre Phryganella Penard (Protozoa, Rhizopoda Testacea). Bull l’Institut Agron des Station Rech Gembloux 4, 315–322.
Chardez, D., 1985.Protozoaires prédateurs de Thécamoebiens. Pro-tistologica 21, 187–194.
Charman, D.J., 1997.Modelling hydrological relationships of tes-tate amoebae (Protozoa: Rhizopoda) on New Zealand peatlands. J. R. Soc. N. Z. 27, 465–483.
Charman, D.J., Amesbury, M.J., Roland, T.P., Royles, J., Hodg-son, D.A., Convey, P., Griffiths, H., 2018.Spatially coherent late Holocene Antarctic Peninsula surface air temperature variability. Geology 46 (12), 1071–1074.
Charman, D.J., Blundell, A., members, A., 2007.A new European testate amoebae transfer function for palaeohydrological recon-struction on ombrotrophic peatlands. J. Quat. Sci. 22, 209–221. Charman, D.J., Brown, A.D., Hendon, D., Karofeld, E., 2004. Test-ing the relationship between Holocene peatland palaeoclimate reconstructions and instrumental data at two European sites. Quat. Sci. Rev. 23, 137–143.
Charman, D.J., Hendon, D., Woodland, W.A., Quaternary Research Association, 2000.The Identification of Testate Amoebae (Pro-tozoa: Rhizopoda) in Peats. Quaternary Research Association, Oxford.
Clarkson, B.R., Ausseil, A.-G.E., Gerbeaux, P., 2013. Wetland ecosystem services. Ecosystem services in New Zealand: condi-tions and trends. Manaaki Whenua Press, Lincoln, pp. 192–202. Corbet, S.A., 1973.An Illustrated Introduction to the Testate Rhi-zopods in Sphagnum: with Special Reference to the Area Around Malham Tarn. Headley Brothers, Yorkshire.
Coûteaux, M.M., Munsch, A., Ponge, J.F., 1979.Le genre Euglypha: essai de taxinomie numûrique. Protistologica 15 (4), 565–579. Decloître, L., 1962. Le genre Eugiypha Dujardin. Arch.
Protis-tenkunde 106, 51–100.
Deflandre, G., 1928. Le genre Arcella Ehrenberg. Morpholo-gie, biologie. Essai phylogénétique. Arch. Protistenkunde 126, 393–407.
Deflandre, G., 1929.Le genre Centropyxis Stein. G. Fischer. Deflandre, G., 1936. Etude monographique sur le genre Nebela
Leidy. Annales de Protistologie 5 (542), 201–286.
Delaine, M., Bernard, N., Gilbert, D., Recourt, P., Du Châtelet, E.A., 2017.Origin and diversity of testate amoebae shell com-position: Example of Bullinularia indica living in Sphagnum
capillifolium. Eur. J. Protistol. 59, 14–25.
Dumack, K., Baumann, C., Bonkowski, M., 2016. A bowl with marbles: revision of the thecate amoeba genus
Lecythium(Chlamydophryidae, Tectofilosida, Cercozoa,
Rhizaria) including a description of four new species and an identification key. Protist 167, 440–459.
Fernández, L.D., Lara, E., Mitchell, E.A., 2015.Checklist, diversity and distribution of testate amoebae in Chile. Eur. J. Protistol. 51, 409–424.
Fernández, L.D., Fournier, B., Rivera, R., Lara, E., Mitchell, E.A., Hernández, C.E., 2016.Water–energy balance, past ecological perturbations and evolutionary constraints shape the latitudinal diversity gradient of soil testate amoebae in south-western South America. Global Ecol. Biogeogr. 25, 1216–1227.
Gałka, M., Tobolski, K., Górska, A., Lamentowicz, M., 2017. Resilience of plant and testate amoeba communities after cli-matic and anthropogenic disturbances in a Baltic bog in Northern Poland: implications for ecological restoration. Holocene 27, 130–141.
Gilbert, D., Mitchell, E.A., Bourdier, G., Francez, A.-J., 2003. Pop-ulation dynamics and food preferences of the testate amoeba
Nebela tincta major-bohemica-collaris complex (Protozoa) in a Sphagnum peatland. Acta Protozool. 42, 99–104.
Gomaa, F., Todorov, M., Heger, T.J., Mitchell, E.A., Lara, E., 2012. SSU rRNA phylogeny of Arcellinida (Amoebozoa) reveals that the largest Arcellinid genus, Difflugia Leclerc 1815, is not mono-phyletic. Protist 163, 389–399.
Gomaa, F., Kosakyan, A., Heger, T.J., Corsaro, D., Mitchell, E.A., Lara, E., 2014. One alga to rule them all: unrelated mixotrophic testate amoebae (Amoebozoa, Rhizaria and Stra-menopiles) share the same symbiont (Trebouxiophyceae). Protist 165, 161–176.
Grospietsch, T., 1958. Wechseltierchen:(Rhizopoden). Franckh’sche Verlagshandlung.
Grospietsch, T., 1965. Monographische studie der gattung Hyalosphenia Stein. Hydrobiologia 26 (1–2), 211–241. Guisan, A., Edwards Jr., T.C., Hastie, T., 2002.Generalized linear
and generalized additive models in studies of species distribu-tions: setting the scene. Ecol. Modell. 157, 89–100.
Heger, T.J., Mitchell, E.A., Leander, B.S., 2013. Holarctic phy-logeography of the testate amoeba Hyalosphenia papilio (Amoebozoa: Arcellinida) reveals extensive genetic diversity explained more by environment than dispersal limitation. Mol. Ecol. 22, 5172–5184.
Hessel, J., 1982. The Climate and Weather of Westland: New Zealand Meteorological Service. Miscellaneous Publication, pp. 115.
Hoogenraad, H.R., De Groot, A.A., 1948. Thecamoebous moss-rhizopods from New Zealand. Hydrobiologia 1 (1–4), 28–44. Jassey, V.E., Shimano, S., Dupuy, C., Toussaint, M.-L., Gilbert, D.,
2012.Characterizing the feeding habits of the testate amoebae
Hyalosphenia papilio and Nebela tincta along a narrow
“fen-bog” gradient using digestive vacuole content and 13C and 15N isotopic analyses. Protist 163, 451–464.
Koenig, I., Mulot, M., Mitchell, E.A., 2018.Taxonomic and func-tional traits responses of Sphagnum peatland testate amoebae to experimentally manipulated water table. Ecol. Indic. 85, 342–351.
Kosakyan, A., Gomaa, F., Lara, E., Lahr, D.J., 2016a.Current and future perspectives on the systematics, taxonomy and nomencla-ture of testate amoebae. Eur. J. Protistol. 55, 105–117. Kosakyan, A., Lahr, D.J., Mulot, M., Meisterfeld, R., Mitchell,
E.A., Lara, E., 2016b.Phylogenetic reconstruction based on COI reshuffles the taxonomy of hyalosphenid shelled (testate)
amoe-bae and reveals the convoluted evolution of shell plate shapes. Cladistics 32, 606–623.
Lahr, D.J., Lara, E., Mitchell, E.A., 2012.Time to regulate microbial eukaryote nomenclature. Biol. J. Linn. Soc. 107, 469–476. Lamentowicz, M., Cedro, A., Gałka, M., Goslar, T.,
Miotk-Szpiganowicz, G., Mitchell, E.A., Pawlyta, J., 2008. Last millennium palaeoenvironmental changes from a Baltic bog (Poland) inferred from stable isotopes, pollen, plant macrofossils and testate amoebae. Palaeogeogr. Palaeoclimatol. Palaeoecol. 265, 93–106.
Lamentowicz, M., Milecka, K., Gałka, M., Cedro, A., Pawlyta, J., Piotrowska, N., Lamentowicz, Ł., van der Knaap, W.O., 2009. Climate and human induced hydrological change since AD 800 in an ombrotrophic mire in Pomerania (N Poland) tracked by testate amoebae, macro-fossils, pollen and tree rings of pine. Boreas 38, 214–229.
Lara, E., Mitchell, E.A., Moreira, D., García, P.L., 2011.Highly diverse and seasonally dynamic protist community in a pristine peat bog. Protist 162, 14–32.
Lara, E., Roussel-Delif, L., Fournier, B., Wilkinson, D.M., Mitchell, E.A., 2016.Soil microorganisms behave like macroscopic organ-isms: patterns in the global distribution of soil euglyphid testate amoebae. J. Biogeogr. 43, 520–532.
Leidy, J., 1879. Fresh-Water Rhizopods of North America, 12. United States Geological Survey of the Territories Report, pp. 1–324.
Macara, G.R., 2016.The climate and weather of West Coast. NIWA Science and Technology Series, 72., pp. 40.
Mazei, Y.A., Lebedeva, N.V., Taskaeva, A.A., Ivanovsky, A.A., Chernyshov, V.A., Tsyganov, A.N., Payne, R.J., 2018.Potential influence of birds on soil testate amoebae in the Arctic. Polar Sci. 16, 78–85.
McGlone, M.S., Wilmshurst, J.M., 1999.A Holocene record of cli-mate, vegetation change and peat bog development east Otago, South Island, New Zealand. J. Quat. Sci. 14, 239–254. McGlone, M.S., 2009.Postglacial history of New Zealand wetlands
and implications for their conservation. N. Z. J. Ecol., 1–23. McWethy, D.B., Whitlock, C., Wilmshurst, J.M., McGlone, M.S.,
Fromont, M., Li, X., Dieffenbacher-Krall, A., Hobbs, W.O., Fritz, S.C., Cook, E.R., 2010.Rapid landscape transformation in South Island New Zealand, following initial Polynesian set-tlement. Proc. Natl. Acad. Sci.
Meisterfeld, R., Aescht, E., Berger, H., 2008.Bullinularia foissneri
nov. sp. (Amoebozoa, Arcellinida) from Australia and synopsis of the genus Bullinularia. The Wilhelm Foissner Festschrift: a tribute to an outstanding protistologist on the occasion of his 60th birthday. Denisia 23, 235–241.
Meyer, C., Gilbert, D., Gillet, F., Moskura, M., Franchi, M., Bernard, N., 2012.Using “bryophytes and their associated testate amoeba” microsystems as indicators of atmospheric pollution. Ecol. Indic. 13, 144–151.
Mitchell, E.A., Buttler, A.J., Warner, B.G., Gobat, J.-M., 1999. Ecology of testate amoebae (Protozoa: Rhizopoda) in
Sphag-num peatlands in the Jura mountains, Switzerland and France.
Ecoscience 6, 565–576.
Mitchell, E.A., Borcard, D., Buttler, A.J., Grosvernier, P., Gilbert, D., Gobat, J.-M., 2000.Horizontal distribution patterns of tes-tate amoebae (Protozoa) in a Sphagnum magellanicum carpet. Microb. Ecol. 39, 290–300.
Mitchell, E.A., Gilbert, D., Buttler, A., Amblard, C., Grosvernier, P., Gobat, J.-M., 2003.Structure of microbial communities in
Sphagnum peatlands and effect of atmospheric carbon dioxide
enrichment. Microb. Ecol. 46, 187–199.
Mitchell, E.A., Charman, D.J., Warner, B.G., 2008.Testate amoebae analysis in ecological and paleoecological studies of wetlands: past, present and future. Biodivers. Conserv. 17, 2115–2137. Nikolaev, S.I., Mitchell, E.A., Petrov, N.B., Berney, C., Fahrni,
J., Pawlowski, J., 2005. The testate lobose amoebae (order Arcellinida Kent, 1880) finally find their home within Amoe-bozoa. Protist 156, 191–202.
Ogden, G., Hedley, R.H., 1980.An atlas of freshwater testate amoe-bae. Soil Sci. 130, 176.
Oksanen, J., Blanchet, F.G., Kindt, R., Legendre, P., Minchin, P.R., O’hara, R., Simpson, G.L., Solymos, P., Stevens, M.H.H., Wag-ner, H., 2013.Package ‘vegan’ Community ecology package, version 2.
Penard, E., 1890. Faune rhizopodique du bassin du Léman. H. Kündig.
Penard, E., 1902.Faune rhizopodique du bassin du Léman. Genéve Kündig, pp. 714.
Penard, E., 1911.Sarcodina: Rhizopodes d’eau douce, 1. W. Heine-mann.
Rao, C.R., 1995.A review of canonical coordinates and an alter-native to correspondence analysis using Hellinger distance. Qüestiió: quaderns d’estadística i investigació operativa 19. Robertson, L.D., King, D.J., Davies, C., 2015.Assessing land cover
change and anthropogenic disturbance in wetlands using vegeta-tion fracvegeta-tions derived from Landsat 5 TM imagery (1984–2010). Wetlands 35, 1077–1091.
Roland, T.P., Amesbury, M.J., Wilkinson, D.M., Charman, D.J., Convey, P., Hodgson, D.A., Royles, J., Clauß, S., Völcker, E., 2017. Taxonomic implications of morphological complexity within the testate amoeba genus Corythion from the Antarctic Peninsula. Protist 168, 565–585.
Royles, J., Amesbury, M.J., Roland, T.P., Jones, G.D., Convey, P., Griffiths, H., Hodgson, D.A., Charman, D.J., 2016.Moss sta-ble isotopes (carbon-13, oxygen-18) and testate amoebae reflect environmental inputs and microclimate along a latitudinal gra-dient on the Antarctic Peninsula. Oecologia 181, 931–945. Schönborn, W., Petz, W., Wanner, M., Foissner, W., 1987.
Obser-vations on the morphology and ecology of the soil-inhabiting testate amoeba Schoenbornia humicola (Schönborn, 1964) Decloitre, 1964 (Protozoa, Rhizopoda). Arch. Protistenkunde 134, 315–330.
Seddon, A.W., Mackay, A.W., Baker, A.G., Birks, H.J.B., Breman, E., Buck, C.E., Ellis, E.C., Froyd, C.A., Gill, J.L., Gillson, L., 2014.Looking forward through the past: identification of 50 pri-ority research questions in palaeoecology. J. Ecol. 102, 256–267. Seppey, C.V., Fournier, B., Szelecz, I., Singer, D., Mitchell, E.A., Lara, E., 2016. Response of forest soil euglyphid tes-tate amoebae (Rhizaria: Cercozoa) to pig cadavers assessed by high-throughput sequencing. Int. J. Leg. Med. 130, 551–562. Singer, D., Kosakyan, A., Pillonel, A., Mitchell, E.A., Lara, E.,
2015.Eight species in the Nebela collaris complex: Nebela
gim-lii (Arcellinida, Hyalospheniidae), a new species described from
a Swiss raised bog. Eur. J. Protistol. 51, 79–85.
Singer, D., Kosakyan, A., Seppey, C.V., Pillonel, A., Fernández, L.D., Fontaneto, D., Mitchell, E.A., Lara, E., 2018. Environ-mental filtering and phylogenetic clustering correlate with the distribution patterns of cryptic protist species. Ecology 99, 904–914.
Smith, H.G., Bobrov, A., Lara, E., 2007.Diversity and biogeogra-phy of testate amoebae. In: Protist Diversity and Geographical Distribution. Springer, pp. 95–109.
Stelling, J.M., Yu, Z., Loisel, J., Beilman, D.W., 2018.Peatbank response to late Holocene temperature and hydroclimate change in the western Antarctic Peninsula. Quat. Sci. Rev. 188, 77–89. Stout, J.D., 1958. Biological studies of some tussock-grassland
soils: IV. Bacteria. New Zeal. J. Agric. Res. 1 (6), 943–957. Stout, J.D., 1960.XV. Bacteria of two cultivated soils. New Zeal. J.
Agric. Res. 3 (2), 214–223.
Stout, J.D., 1984.The protozoan fauna of a seasonally inundated soil under grassland. Soil Biol. Biochem. 16 (2), 121–125. Stout, J.D., Rafter, T.A., 1978. The 13 C/12 C isotopic ratios of
some New Zealand tussock grassland soils. In: Stable Isotopes in the Earth Sciences. Lower Hutt, New Zealand.
Sullivan, M.E., Booth, R.K., 2011.The potential influence of short-term environmental variability on the composition of testate amoeba communities in Sphagnum peatlands. Microb. Ecol. 62 (1), 80–93.
Swindles, G.T., Roe, H.M., 2007.Examining the dissolution char-acteristics of testate amoebae (Protozoa: Rhizopoda) in low pH conditions: implications for peatland palaeoclimate studies. Palaeogeogr. Palaeoclimatol. Palaeoecol. 252, 486–496. Swindles, G.T., Ruffell, A., 2009.A preliminary investigation into
the use of testate amoebae for the discrimination of forensic soil samples. Sci. Justice 49, 182–190.
Swindles, G., Blundell, A., Roe, H., Hall, V., 2010.A 4500-year proxy climate record from peatlands in the North of Ireland: the identification of widespread summer ‘drought phases’? Quat. Sci. Rev. 29, 1577–1589.
Swindles, G.T., Amesbury, M.J., Turner, T.E., Carrivick, J.L., Woulds, C., Raby, C., Mullan, D., Roland, T.P., Galloway, J.M., Parry, L., 2015. Evaluating the use of testate amoebae for palaeohydrological reconstruction in permafrost peatlands. Palaeogeogr. Palaeoclimatol. Palaeoecol. 424, 111–122. Swindles, G.T., Green, S.M., Brown, L., Holden, J., Raby, C.L.,
Turner, T.E., Smart, R., Peacock, M., Baird, A.J., 2016. Evaluat-ing the use of dominant microbial consumers (testate amoebae) as indicators of blanket peatland restoration. Ecol. Indic. 69, 318–330.
Szelecz, I., Fournier, B., Seppey, C., Amendt, J., Mitchell, E., 2014. Can soil testate amoebae be used for estimating the time since death? A field experiment in a deciduous forest. Forensic Sci. Int. 236, 90–98.
Taylor, R., Smith, I., 1997.The state of New Zealand’s environment. Environment.
Thomas, R., Gauthier-Lièvre, L., 1959. Le genre Lesquereu-sia Schlumberger 1845 (Rhizopodes testacès). Bulletin de la Sociètè dé Histoire Naturelle de léAfrique du Nord 50, 34–86.
Valentine, J., Davis, S.R., Kirby, J.R., Wilkinson, D.M., 2013.The use of testate amoebae in monitoring peatland restoration man-agement: case studies from North West England and Ireland. Acta Protozool., 129–145.
Van Bellen, S., Mauquoy, D., Payne, R.J., Roland, T.P., Daley, T.J., Hughes, P.D., Loader, N.J., Street-Perrott, F.A., Rice, E.M., Pancotto, V.A., 2014.Testate amoebae as a proxy for reconstruct-ing Holocene water table dynamics in southern Patagonian peat bogs. J. Quat. Sci. 29, 463–474.
Van Oye, P., 1956.On the Thecamoeban fauna of New Zealand with description of four new species and biogeografical discussion. Hydrobiologia 8 (1–2), 16–37.
Wailes, G.H., Penard, E., 1911.Rhizopoda. Hodges Figgis & Com-pany, Williams and Norgate.
Wilmshurst, J.M., McGlone, M.S., Charman, D.J., 2002.Holocene vegetation and climate change in southern New Zealand: linkages between forest composition and quantitative surface moisture reconstructions from an ombrogenous bog. J. Quat. Sci. 17, 653–666.
Wilmshurst, J.M., Wiser, S.K., Charman, D.J., 2003.Reconstructing Holocene water tables in New Zealand using testate amoebae: differential preservation of tests and implications for the use of transfer functions. Holocene 13, 61–72.
Wu, H., Lai, C., Zeng, G., Liang, J., Chen, J., Xu, J., Dai, J., Li, X., Liu, J., Chen, M., Lu, L., 2017.The interactions of compost-ing and biochar and their implications for soil amendment and pollution remediation: a review. Crit. Rev. Biotechnol. 37 (6), 754–764.
Zheng, X., Amesbury, M.J., Hope, G., Martin, L.F., Mooney, S.D., 2019.Testate amoebae as a hydrological proxy for reconstruct-ing water-table depth in the mires of south-eastern Australia. Ecological Indicators 96, 701–710.