the Creative Commons Attribution 4.0 License.
Environmental and biological controls on Na/Ca ratios in
scleractinian cold-water corals
Nicolai Schleinkofer1,2, Jacek Raddatz1,2, André Freiwald3,4, David Evans1,2, Lydia Beuck3, Andres Rüggeberg5, and Volker Liebetrau6
1Institute of Geosciences, Goethe University Frankfurt, Altenhöferallee 1, 60438 Frankfurt am Main, Germany 2Frankfurt Isotope and Element Research Center (FIERCE), Goethe University Frankfurt, Altenhöferallee 1,
60438 Frankfurt am Main, Germany
3Senckenberg am Meer, Marine Research Department, Südstrand 40, 26382 Wilhelmshaven, Germany
4MARUM (Zentrum für Marine Umweltwissenschaften), Bremen University, Leobener Str. 8, 28359 Bremen, Germany 5Department of Geosciences, Faculty of Science and Medicine, University of Fribourg, Chemin du Musée 6,
1700 Fribourg, Switzerland
6GEOMAR Helmholtz Centre for Ocean Research Kiel, Wischhofstr. 1–3, 24148 Kiel, Germany
Correspondence: Nicolai Schleinkofer ([email protected]) Received: 29 January 2019 – Discussion started: 19 February 2019
Revised: 20 August 2019 – Accepted: 21 August 2019 – Published: 20 September 2019
Abstract. Here we present a comprehensive attempt to cor-relate aragonitic Na/Ca ratios from Desmophyllum pertusum (formerly known as Lophelia pertusa), Madrepora oculata and a caryophylliid cold-water coral (CWC) species with different seawater parameters such as temperature, salinity and pH. Living CWC specimens were collected from 16 dif-ferent locations and analyzed for their Na/Ca ratios using solution-based inductively coupled plasma-optical emission spectrometry (ICP-OES) measurements.
The results reveal no apparent correlation with salinity (30.1–40.57 g kg−1) but a significant inverse correlation with temperature (−0.31 ± 0.04 mmol mol−1◦C−1). Other marine aragonitic organisms such as Mytilus edulis (inner aragonitic shell portion) and Porites sp. exhibit similar results highlight-ing the consistency of the calculated CWC regressions. Cor-responding Na/Mg ratios show a similar temperature sen-sitivity to Na/Ca ratios, but the combination of two ratios appears to reduce the impact of vital effects and domain-dependent geochemical variation. The high degree of scatter and elemental heterogeneities between the different skele-tal features in both Na/Ca and Na/Mg, however, limit the use of these ratios as a proxy and/or make a high number of samples necessary. Additionally, we explore two models to explain the observed temperature sensitivity of Na/Ca ra-tios for an open and semi-enclosed calcifying space based
on temperature-sensitive Na- and Ca-pumping enzymes and transport proteins that change the composition of the calcify-ing fluid and consequently the skeletal Na/Ca ratio.
1 Introduction
Sodium-to-calcium ratios (Na/Ca) have been proposed as a new tool in paleoceanography to reconstruct seawater salini-ties. Cultured benthic and planktonic foraminifera as well as living planktonic foraminifera from the Red Sea showed the potential of calcitic Na/Ca ratios as a salinity proxy (Mezger et al., 2016; Wit et al., 2013). Cold-water corals provide one of the most promising marine paleoenvironmental archives for climatic research due to the potential to reconstruct high-resolution records using the aragonitic skeleton (Druffel, 1997). About half of the known scleractinian coral species do not live in tropical, shallow water (< 50 m) but in deeper waters, including deep-sea environments (> 200 m) (Roberts et al., 2009). These deep or cold-water corals lack pho-totrophic symbionts and, therefore, are azooxanthellate. Like their zooxanthellate shallow-water relatives, some azooxan-thellate deep-water species, such as Desmophyllum pertusum and Madrepora oculata, are also capable of building large three-dimensional reef frameworks that serve as habitats for
thousands of different organisms and constitute biodiversity hotspots in low to high latitudes and from shallower wa-ter to the deep seas (Henry and Roberts, 2016; Roberts et al., 2009). The distribution of cold-water corals (CWCs) is controlled by several parameters, amongst which is the den-sity of seawater (Dullo et al., 2008), which appears to corre-late with the so-called intermediate nepheloid layers (INLs). These INLs contribute an important source of particulate or-ganic matter (POM) (Kiriakoulakis et al., 2005, 2007) that CWCs feed on. Additionally, it has been suggested, that ga-mete density restricts the lateral transport to certain density envelopes (Dullo et al., 2008). For D. pertusum, the suit-able density envelope amounts to σθ =27.35–27.65 kg m−3
(Dullo et al., 2008), although these values are not applica-ble to every oceanic region (Flögel et al., 2014; Freiwald et al., 2009; Rüggeberg et al., 2011). Since seawater density is a function of temperature and salinity, these parameters also partly control the spatial distribution of CWCs. Most known CWCs occur in salinities of 35 g kg−1and mean temperatures of 4–12◦C (Freiwald, 2002; Freiwald and Roberts, 2005), al-though they are also able to thrive at lower and higher tem-peratures and salinities (e.g., Bett, 2001; Roder et al., 2013; Taviani et al., 2005).
Independent proxies are needed to reconstruct the envi-ronment in which CWCs lived in the past to better under-stand their temperature, salinity or pH tolerances and to study the influence of parameters on their spatial distribution. This would also help to better locate new unknown sites of CWC occurrences. For temperature and pH, different geochemical proxies can be used to calculate these parameters in the ge-ological past. Sr/Ca and Li/Mg ratios serve as temperature proxies (Cohen et al., 2006; Gagnon et al., 2007; Mitsug-uchi et al., 1996; Montagna et al., 2014; Raddatz et al., 2013, 2014b; Rollion-Bard and Blamart, 2015; Shirai et al., 2005), U/Ca and boron isotopes serve as proxies of the carbon-ate system (Anagnostou et al., 2011, 2012; Blamart et al., 2007; McCulloch et al., 2012; Raddatz et al., 2014a, 2016; Rollion-Bard et al., 2011). However, independent geochem-ical methods to reconstruct past salinities are absent but ur-gently needed to reconstruct spatial distribution patterns in the past and quantify the effects of ocean acidification on CWCs by researching its effects in the past. Even though CWCs show that they can maintain growth in undersatu-rated, corrosive waters, the older unprotected parts of the reef are susceptible to dissolution (Büscher et al., 2017; Form and Riebesell, 2012). This weakens the reef integrity and might have severe implications for available microhabitats (Büscher et al., 2017; Roberts, 2006).
Reconstructing past salinities can be accomplished with several different techniques, e.g., diatom and dinoflagellate species composition (Zonneveld et al., 2001), morphology and the size of placoliths from Emiliania huxleyi (Bollmann et al., 2009), Ba/Ca ratios in foraminiferal calcite (Weldeab et al., 2007), the strontium isotope composition of bivalves (Israelson and Buchardt, 1999), the process length of
di-noflagellate cysts (Mertens et al., 2009), the hydrogen iso-tope composition of alkenones (van der Meer et al., 2007; Schouten et al., 2006), or temperature-corrected (Mg/Ca, TEX86) oxygen isotopes (Elderfield and Ganssen, 2000).
While some of these proxies may yield reliable results (e.g., coupled Mg/Ca and oxygen isotopes – Elderfield et al., 2012; Lear et al., 2000) others suffer from rather large uncertainties introduced by modeled parameters or require a good knowl-edge of the regional oceanography (Wit et al., 2013). Others, like Ba/Ca ratios are more effected by terrestrial runoff and are therefore only applicable in proximal sites. Complica-tions with the existing proxies mean that further methods are desirable; therefore, we explore here whether coral Na/Ca ratios may be useful in this regard.
The influence of seawater salinity on Na/Ca ratios are known from Atlantic oysters (Rucker and Valentine, 1961), barnacle shells (Gordon et al., 1970) and inorganically pre-cipitated calcium carbonate (Ishikawa and Ichikuni, 1984). Recently it has been shown that Na incorporation into cal-citic planktonic and benthic foraminifera appears to be at least partly controlled by seawater salinity (Allen et al., 2016 (only in Globigerinoides ruber); Mezger et al., 2016; Wit et al., 2013). According to Wit et al. (2013), the incorporation of Na in calcite depends on the activity of Na in the seawa-ter which is a function of salinity. There is strong evidence that Na substitutes for Ca in biogenic aragonite despite its charge difference (Okumura and Kitano, 1986; Yoshimura et al., 2017). However, since Na and Ca compete for the same lattice positions, the calcium concentration and Na/Ca ac-tivity ratio of the surrounding seawater might also control the amount of sodium incorporation (Ishikawa and Ichikuni, 1984; White, 1977). Over longer periods of geological time, when concentrations of some elements in seawater have var-ied, this would inhibit the use of Na/Ca ratios as a salinity proxy but might prove useful to reconstruct oceanic calcium concentrations. Recent studies also show that the Na/Ca ratio in foraminiferal calcite is also mainly controlled by seawater Na/Ca ratios (Hauzer et al., 2018).
In this study, we investigate the impact of different seawa-ter parameseawa-ters on the incorporation of Na into the aragonitic skeleton of the scleractinian cold-water coral D. pertusum, M. oculataand a caryophylliid species from the Red Sea. The corals were collected alive from a variety of locations to cover a broad range of temperatures (5.9–21.6◦C) and salin-ities (30.1–40.6 g kg−1).
2 Materials and methods
2.1 Study area and sample collection
The samples were taken from 45 different coral specimens collected from 16 different locations (Table 1). Most of the samples (n = 25) were collected during different cruises from the Norwegian margin. The other samples derive from
salinity and temperature envelopes.
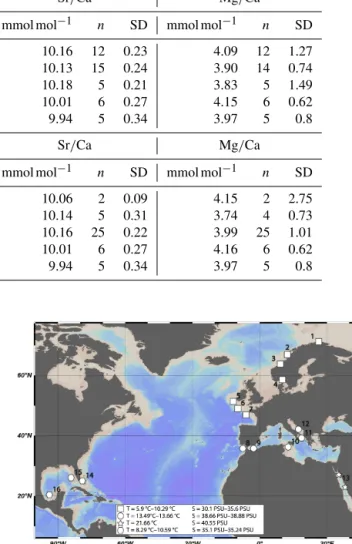
Na/Ca Sr/Ca Mg/Ca
Temperature (◦C) mmol mol−1 n SD mmol mol−1 n SD mmol mol−1 n SD 6.23 ± 0.31 26.30 12 2.88 10.16 12 0.23 4.09 12 1.27 7.94 ± 0.41 25.30 15 2.48 10.13 15 0.24 3.90 14 0.74 9.83 ± 0.46 24.96 5 3.26 10.18 5 0.21 3.83 5 1.49 13.56 ± 0.09 25.33 5 1.43 10.01 6 0.27 4.15 6 0.62 21.64 ± 0.02 21.13 4 0.82 9.94 5 0.34 3.97 5 0.8
Na/Ca Sr/Ca Mg/Ca
Average salinity (g kg−1) mmol mol−1 n SD mmol mol−1 n SD mmol mol−1 n SD 30.1 23.42 2 2.25 10.06 2 0.09 4.15 2 2.75 31.2 23.70 5 3.06 10.14 5 0.31 3.74 4 0.73 35.22 ± 0.21 26.18 25 2.46 10.16 25 0.22 3.99 25 1.01 38.67 ± 0.07 25.33 5 1.43 10.01 6 0.27 4.16 6 0.62 40.56 ± 0.01 21.13 4 0.82 9.94 5 0.34 3.97 5 0.8
the Irish margin and Bay of Biscay (n = 4), the Mediter-ranean Sea and Gulf of Cadiz (n = 7), the Gulf of Mexico and Great Bahama Bank (n = 4), and the Red Sea (n = 5) (Fig. 1). Conductivity–temperature–depth (CTD) downcast data for water parameters was available for all locations ex-cept the Red Sea and the Gulf of Mexico. Where no CTD data were available, the water parameters were retrieved from annual averaged data from the World Ocean Atlas 2013 (WOA13; Locarnini et al., 2013; Zweng et al., 2013). Where available, comparison of in situ CTD and WOA13 data re-vealed an agreement within 0.15◦C in Santa Maria de Leuca and 0.04◦C in the Bay of Biscay. The seawater carbonate system data such as pH were taken from the associated cruise report (Flögel et al., 2014), or in case of the Red Sea and the western Atlantic, from Mezger et al. (2016) and CARINA (Carbon in the Atlantic). Flögel et al. (2014) used a WTW Multi 350i compact precision handheld meter to determine pH (Flögel et al., 2014); pH in the Red Sea was calculated from DIC (dissolved inorganic carbon) and TA (total alka-linity), measured during PELAGIA 64PE158 (Mezger et al., 2016), using CO2SYS (Lewis and Wallace, 1998). pH values are reported using the total scale.
We took 31 samples from different coral colonies and three different species (D. pertusum, M. oculata, a caryophylliid species) that were collected during different cruises. The samples were taken from the uppermost calices after phys-ically cleaning them with a dental drill tool to remove sec-ondary overgrowths. We avoided further cleaning or rinsing with water because studies suggest that structurally substi-tuted Na is readily leached even by distilled water (Ragland et al., 1979). It is possible that organic contents inside the skeleton bias the results as shown in foraminifera (Bran-son et al., 2016). However, the study on foraminifera shows that the Na/Ca ratio only significantly varies in POS
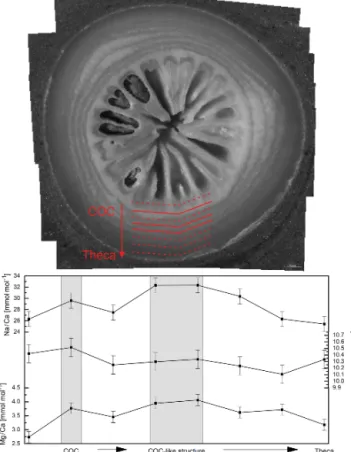
(pri-Figure 1. Map of sampling locations. Locations are grouped in four areas with similar physical parameters. (1) Lopphavet, Sot-bakken, Stjernsund; (2) Traenadjupet; (3) Sula, Nordleksa, Tautra, Røberg; (4) Oslofjord; (5) Galway Mound; (6) Whittard Canyon; (7) Guilvinec Canyon; (8) Meknes Carbonate Mound Province; (9) El Idrissi Bank; (10) Urania Bank; (11) Santa Maria di Leuca (SML) province; (12) Bari Canyon; (13) Red Sea; (14) Great Ba-hama Bank; (15) southwest Florida; (16) Campeche Bank.
mary organic sheet) regions. In corals the COC (centers of calcification) would be an equivalent structure, which we avoided during the sampling process. Furthermore, it has been suggested that these regions only significantly affect bulk sample elemental ratios in very thin-walled foraminifera (Branson et al., 2016). In corals the area of COC is larger (20 % of the total skeleton radius; Rollion-Bard and Bla-mart, 2015), but the Na/Ca ratio does not increase in the COC as strongly as it does in the POS areas of foraminifera (Branson et al., 2016; Rollion-Bard and Blamart, 2015). Avoiding the COC areas in bulk samples only reduces the
mean Na/Ca ratio by 0.18 mmol mol−1(0.18 mmol mol−1= Na/CaSample 1−iinc. COC −Na/CaSample 1−iexc. COC ); additional cleaning of organic material is, therefore, not necessary. An additional 14 samples (D. pertusum) were prepared as longitudinal slices through the coral’s calice, glued on metal plates. In order to identify elemental heterogeneities within the theca wall, subsamples were taken using a micromill (Merchantec MM-000-134).
2.2 ICP-OES analyses
Elemental ratios were measured by inductively cou-pled plasma-optical emission spectrometry (ICP-OES). The ICP-OES analysis was carried out with Thermoscientific iCap 6300 dual viewing at Goethe University, Frankfurt. This machine is both capable of measuring axially and ra-dially. Alkali metals (Na) were measured radially on line 589.59 nm, whereas earth alkali metals (Mg, Sr) were mea-sured axially on lines 279.55 and 421.55 nm, respectively. The sample powder (≈ 140 µg) was dissolved in 500 µL HNO3 (2 %) and 300 µL aliquots were separated.
Subse-quently 1500 µL of 1.2 mg L−1 yttrium solution was added to each aliquot as an internal standard resulting in 1 mg L−1. The intensity data were background subtracted and standard-ized internally to Y and normalstandard-ized to Ca. External stan-dards were mixed from single-element standard solutions to match the typical element concentrations of cold-water corals (cf. Rosenthal et al., 1988). The coral standard JCp-1 (Hathorne et al., 2013; Okai et al., 2002) was measured after every 10th sample to allow for drift correction and monitor measurement quality.
Relative precision of the element/Ca measurements was based on the international calcium-carbonate standard JCp-1 (20 replicates) and amounts to 20.47 ± 0.68 mmol mol−1Na/Ca (19.8 ± 0.14 mmol mol−1; Okai et al., 2002), 4.09 ± 0.11 mmol mol−1 Mg/Ca (4.199 ± 0.065 mmol mol−1; Hathorne et al., 2013; Okai et al., 2002) and 9.36 ± 0.07 mmol mol−1 Sr/Ca (8.838 ± 0.042 mmol mol−1; Hathorne et al., 2013; Okai et al., 2002). Measurements were conducted in two sessions lasting 10 and 5 h.
2.3 Data processing
Before applying statistics, outliers were removed from the raw data. Outliers were identified by the average ± 1.5 SD per oceanic region (Norwegian margin, Bay of Biscay– Irish margin, Mediterranean Sea, Red Sea, Gulf of Mexico– Bahamas). The threshold was chosen to eliminate data points <15 mmol mol−1and > 35 mmol mol−1over a range from 15 to 35 mmol mol−1, which is roughly 5 mmol mol−1higher and lower than the reported range from a similar study (Rollion-Bard and Blamart, 2015). The profiled samples were additionally checked for values that derive from the COC, which are identifiable through a positively correlating
Figure 2. Intraindividual element heterogeneities of one sample from Lopphavet (D. pertusum). Shaded gray areas indicate COC and COC-like structures (solid lines in sample picture). Error bars indicate 2 SD of the JCp-1 mean. Within the uncertainty Sr/Ca ratios show no significant changes throughout the coral, whereas Mg/Ca and Na/Ca show variations of 1.25 and 6 mmol mol−1, re-spectively.
increase in Mg/Ca and Na/Ca. The chosen threshold was the mean of the profiled sample + 2 SD of JCp-1. Statistical calculations were conducted with the ORIGIN Pro software suite.
3 Results
Spatial distribution patterns show great variations in Na/Ca ratios through the corals skeleton (Fig. 2). In the COC and COC-like structures (structures that geochemically cor-respond to COC but morphologically to fibrous deposits) Na/Ca ratios show significant increases but the amount of increase relative to the mean is not uniform in the sam-ple. Increases range from +2 to +10 mmol mol−1. Mg/Ca is positively correlated with Na/Ca in the COC structures but mostly independent from Na/Ca in the fibrous deposits (FDs). Similar to Na/Ca, the amplitude of Mg/Ca in the COC structures is very variable in their amount and ranges from +0.5 to +3 mmol mol−1. Both sodium and magnesium are often enriched in the outermost parts of the theca. Sr/Ca
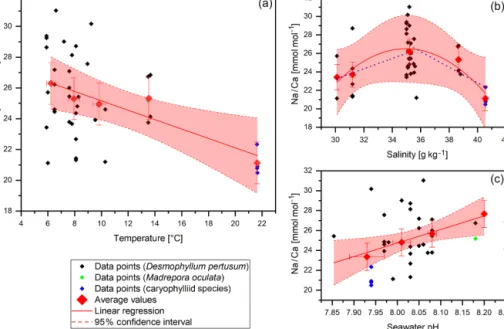
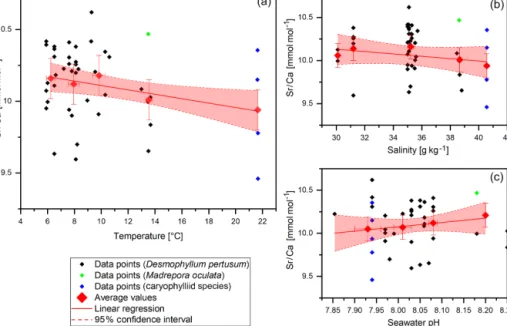
Figure 3. Na/Ca data (without COC) plotted against water temperature, salinity and pH. Red diamonds indicate averaged values for temper-ature ranges. Tempertemper-ature ranges are 5–7, 7–9, 9–11, 13–15 and 21–23◦C. The x error relates to the SD of the temperature or salinity mean. The y error bars indicate 2 SD of the JCp-1 mean. Red lines are linear regressions of the averaged values with the 95 % confidence interval shaded. Blue dotted lines indicate linear regressions for different salinity ranges.
ratios are mostly stable throughout the theca and seem to be independent from the different skeletal structures. In some samples, there are covariances between Sr/Ca and Mg/Ca and Na/Ca present, but in general they do not appear to be controlled by the skeletal morphology in the same way as Mg/Ca and Na/Ca, as shown by their independence from the different skeletal structures.
3.1 Element/Ca ratios of scleractinian cold-water corals
Na/Ca ratios vary between 20.49 ± 1.36 (1 SD) mmol mol−1 in the Red Sea and 31.04 ± 1.36 mmol mol−1 in the Nor-wegian reefs with a mean of 25.22 mmol mol−1and a stan-dard deviation of 2.8 mmol mol−1 (Fig. 3). The values are in accordance with previous studies on D. pertusum (21.94– 28.11 mmol mol−1; Rollion-Bard and Blamart, 2015) but 5 mmol mol−1higher than reported for zooxanthellate corals (Amiel et al., 1973; Busenberg and Niel Plummer, 1985; Mit-suguchi et al., 2001; Ramos et al., 2004; Swart, 1981). Sig-nificant deviations between D. pertusum (n = 38), M. ocu-lata(n = 2) and the caryophylliid species (n = 5) are not ob-servable. A linear correlation between salinity and Na/Ca over the whole salinity range is not observable, but the present dataset is best described with a second-order poly-nomial function. Accordingly, there is a positive trend from 30.1 to 35 g kg−1 followed by a negative trend from 35 to 40.5 g kg−1. Linear regressions equal f (S30.1−35) =6.4 +
0.56 · S(R2=0.99, P = 0.072) and f (S35−40.5) =56.61 −
0.84 · S(R2=0.66, P = 0.4). As the P values show, a
sig-nificant slope is missing in all these regressions. In the case of the polynomial fit the P value shows that the fit is not significantly superior to the f (S30,1−40,5) =constant.
Na/Ca and temperature show a significant negative cor-relation, which is, however, mainly driven by the samples from the highest temperature (Red Sea). The linear regres-sion equals
fT6−22◦C=28.2 ± 0.9 − 0.31 ± 0.07 × T
(R2=0.87, P = 0.02). (1)
Temperature and salinity show a positive correlation; ac-cordingly this negative correlation cannot be caused by co-variances between salinity and temperature. Corals from the Mediterranean Sea are slightly elevated in their Na/Ca ra-tio, but within error they still fit the correlation with both salinity and temperature. Distribution coefficients (KdNa= Na/Cacarbonate/Na/Caseawater) at specific temperatures for
several different species, including the scleractinian cold-water corals from this study, Porites sp. and M. edulis, show similar values. KdNafrom this study amounts to Kd (6.2Na ◦C)=
5.73 × 10⁻⁴, Kd (7.9Na ◦C)=5.51 × 10⁻⁴, Kd (9.8Na ◦C)=5.44 ×
10−4, Kd (13.5Na ◦C)=5.62 × 10⁻⁴ and Kd (21.6Na ◦C)=4.73 ×
10−4. Distribution coefficients for Porites sp. and M. edulis are Kd (26.03Na ◦C)=4.6 × 10⁻⁴ (Mitsuguchi et al., 2001) and
Kd (12.5Na ◦C)=5.25×10⁻⁴(Lorens and Bender, 1980),
respec-tively. For comparison, the inorganic distribution coefficient is 4.00 × 10⁻⁴at 15◦C, about 20 % lower (Kinsman, 1970). The results from White (1977) show that the composition of
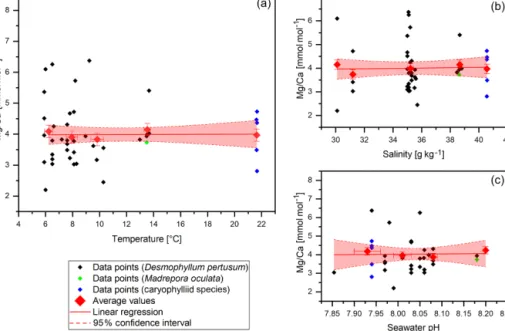
Figure 4. Mg/Ca data (without COC) plotted against water temperature, salinity and pH. Red diamonds indicate averaged values for tem-perature ranges. Temtem-perature ranges are 5–7, 7–9, 9–11, 13–15 and 21–23◦C. The x error relates to the SD of the temperature or salinity mean. The y error bars indicate 2 SD of the JCp-1 mean. Red lines are linear regressions of the averaged values with the 95 % confidence interval shaded.
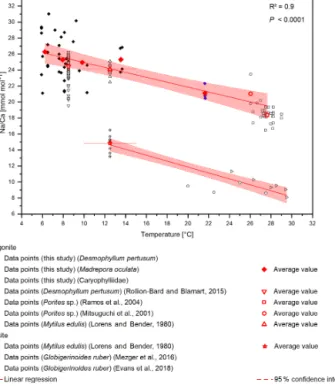
the solution affects the elemental ratios in the precipitate, but in the study from Kinsman (1970) the precipitation happened from seawater. Therefore, it is reasonable to use this data for comparison. A combined regression using the data from this study, the D. pertusum data from Rollion-Bard and Blamart (2015), M. edulis data from Lorens and Bender (1980), and Poritessp. data from Ramos et al. (2004) and Mitsuguchi et al. (2001) equals
fT6−27.63◦C=28.03 ± 0.7 − 0.31 ± 0.04 × T
(R2=0.9, P < 0.0001). (2)
Na/Ca also shows a significant positive correlation with pH of the ambient seawater. Linear regression equals f (pH) = −84.26 ± 40.15 + 13.63 ± 5.49 · pH(R2=0.14, P = 0.017). A negative trend between pH and temperature is visible. 3.2 Mg/Ca and Sr/Ca
Mg/Ca values vary between 2.2±0.2 mmol mol−1in the Red Sea and 6.38 ± 0.2 mmol mol−1 in the Mediterranean Sea with a mean of 3.99 mmol mol−1and a standard deviation of 0.97 mmol mol−1(Fig. 4). Maximum values are higher than the literature states for D. pertusum (2.99–4.72 mmol mol−1; Cohen et al., 2006; Gagnon et al., 2007; Raddatz et al., 2013; Rollion-Bard and Blamart, 2015), but the mean values are well inside the range given in the literature. Significant devia-tions between D. pertusum, M. oculata and the caryophylliid species are not observable, although there are limited pub-lished data for M. oculata and the caryophylliid species.
Sea-water parameters such as temperature, salinity and pH have no significant effect on Mg/Ca ratios in the skeleton.
Sr/Ca values vary between 9.46 ± 0.14 and 10.46 ± 0.14 mmol mol−1 with a mean of 10.1 ± 0.14 mmol mol−1 and a standard deviation of 0.25 mmol mol−1(Fig. 5). Both maximum and minimum values derive from corals that grew in reefs that are located in the Trondheimfjord. The val-ues are in accordance with previous studies on D. per-tusum(9.27–10.05 mmol mol−1; Cohen et al., 2006; Gagnon et al., 2007; Raddatz et al., 2013). Significant deviations between D. pertusum, M. oculata and the caryophylliid species are not observable. Despite the known temperature effect on Sr/Ca ratios, this effect is not pronounced in this dataset. The correlation shows a strongly deviating slope of −0.015 mmol mol−1◦C−1in comparison to that given in the literature (−0.083 ± 0.017 mmol mol−1◦C−1; Raddatz et al., 2013). Linear regressions equal f (T ) = 10.26 ± 0.05 − 0.015 ± 0.004 · T (R2=0.83, P = 0.03). Sr/Ca vs. salinity values show a distribution pattern similar to that of Na/Ca vs. salinity values with the maximum at 35 g kg−1 and de-scending values at lower and higher salinities, but an AIC (Akaike information criterion) and an F test confirm that a linear fit is better suited. The linear regression equals f (S) = 10.58 ± 0.03 − 0.015 ± 0.01 · S(R2=0.52, P = 0.17). P val-ues show that the correlation is not significant.
Figure 5. Sr/Ca data (without COC) plotted against water temperature, salinity and pH. Red diamonds indicate averaged values for temper-ature ranges. Tempertemper-ature ranges are 5–7, 7–9, 9–11, 13–15 and 21–23◦C. The x error relates to the SD of the temperature/salinity mean. The y error bars indicate 2 SD of the JCp-1 mean. Red lines are linear regressions of the averaged values with the 95 % confidence interval shaded.
3.3 Element concentrations in the extracellular calcifying fluid (ECF)
Based on the assumption of a semi-enclosed ECF with seawater leakage and a consequent [Na]ECF similar to
[Na]Seawater, it is possible to calculate [Ca]ECF and
[Mg]ECF using skeletal Na/Ca and Mg/Ca data.
Assum-ing [Na]Seawater= [Na]ECF=455 mmol L−1(Turekian et al.,
2010) and an invariant Na distribution coefficient, [Ca]ECF
can be calculated with the following equation: [Ca]ECF= [Na]ECF·
KdNa
Na Ca Coral
. (3)
In order to do so, knowledge of KdNa is required. White (1977) reports 1.8–4.1 × 10⁻⁴for inorganic aragonite in the four experiments with solution Na/Ca closest to the natural seawater ratio (∼ 45 mol mol−1), which would result in pre-dicted aragonite Na/Ca ratios of 8–18 mmol mol−1, slightly lower than the coral aragonite values we measure. Because this difference may be explained via differences in (e.g.) inor-ganic and coral aragonite growth rates (Mucci, 1988; White, 1977; Yoshimura et al., 2017) or the presence of organics (Amiel et al., 1973; Cuif et al., 2003; Stolarski, 2003), we adjust our data so that the predicted aragonite Na/Ca ratios fit our measured ratios by using KdNa=5.37 × 10⁻⁴ calcu-lated from the coral samples presented here. As such we can-not presently constrain absolute [Ca]ECF values using this
method; however, the aim here is simply to explore whether differences in [Ca]ECFcan explain the variance in both our
Na/Ca and Mg/Ca data. An improved understanding of the
inorganic distribution coefficient may enable both precise and accurate ECF reconstructions in the future. Using the method outlined above, we calculate [Ca]ECF values
rang-ing from 7.9 to 12.3 mmol L−1with a mean of 9.9 mmol L−1. This range is in good agreement with the microsensor studies on Galaxea fascicularis conducted by Al-Horani et al. (2003) (9–11 mmol L−1) by substituting these data into the follow-ing equation: [Mg]ECF= Mg CaCoral ·[Ca]ECF KdMg . (4)
With KdMg=7.9 × 10⁻⁴, calculated from the coral samples presented here, [Mg]ECF can also be calculated.
Result-ing values range from 32.8 to 104.7 mmol L−1and a mean of 51.5 mmol L−1and a median of 46.5 mmol L−1. Results show that the Mg concentration in the ECF is constant with changing Ca concentration.
4 Discussion
4.1 Heterogeneities of elemental ratios in scleractinian corals
Ninety percent of the sodium in corals is located in the arag-onitic mineral phase, the remaining sodium is bound to or-ganic material and exchangeable sites (Amiel et al., 1973). Magnesium, which covaries with sodium, is not located in the aragonitic phase but either in organic material (20 %– 30 %) and a highly disordered inorganic phase such as
amor-phous calcium carbonate (ACC) (70 %–80 %) (Amiel et al., 1973; Finch and Allison, 2008) or nano domains of Mg-bearing carbonate occluded in the aragonite (Finch and Al-lison, 2008). A small percentage seems to be also trapped along the (001) surface (Ruiz-Hernandez et al., 2012). El-emental heterogeneities are particularly visible when com-paring COC and fibrous deposits (Fig. 2). COC are both chemically and morphologically distinct from the fibrous de-posits. While the COC are built by submicron-sized gran-ular crystals (Constantz, 1989), the fibers that build the fi-brous zones are not single orthorhombic crystals but elon-gated composite structures with very fine organo-mineral al-ternations (Cuif and Dauphin, 1998). Reasons for the differ-ent chemical composition are still under debate and include (1) pH variations in the calcifying fluid (Adkins et al., 2003; Holcomb et al., 2009), (2) Rayleigh fractionation (Cohen et al., 2006; Gagnon et al., 2007), (3) kinetic fractionation (McConnaughey, 1989; Sinclair et al., 2006), (4) mixed ion transport through direct seawater transport and ionic pump-ing (Gagnon et al., 2012), and (5) precipitation from differ-ent compartmdiffer-ents (Meibom et al., 2004; Rollion-Bard et al., 2010, 2011).
The missing covariance between Sr/Ca and Mg/Ca or Na/Ca ratios excludes Rayleigh fractionation as the main mechanism responsible for the large variances of elemental ratios (Rollion-Bard and Blamart, 2015), as well as mixed ion transport for similar reasons (Rollion-Bard and Blamart, 2015). pH variations and consequent changes in the satura-tion of the calcifying fluid have been shown to alter Mg/Ca ratios in corals and abiogenic aragonite (Holcomb et al., 2009) and therefore, could potentially alter Na/Ca ratios as well. While the pH-elevation at the COC is supported by sev-eral studies (McCulloch et al., 2012; Raddatz et al., 2014a; Sinclair et al., 2006), Tambutté et al. (2007) propose that the nanometer-sized spaces between the skeleton and the cali-coblastic ectoderm does not allow a modification of the satu-ration state. Also, studies based on δ11B measurements show that the COC might be an area of lower pH-values com-pared to the fibrous zones (Blamart et al., 2007; Jurikova et al., 2019; Rollion-Bard et al., 2011). Our data may be ex-plained by different calcification compartments (Meibom et al., 2004; Rollion-Bard et al., 2010, 2011) in combination with kinetic effects caused by rapid calcification rates. Addi-tionally, we propose changing organic contents as a further mechanism that controls elemental ratio differences in the different skeletal parts, visible in the covariance of Mg/Ca and Na/Ca ratios throughout the skeleton. However, it is not clear in what way the different precipitation regions are dis-tinct from each other, for example, whether they are char-acterized by different cell types or different modes of the same cell types (Rollion-Bard et al., 2010). So far, only cali-coblasts and desmocytes are known from the aboral ectoderm of corals (Allemand et al., 2011; Tambutté et al., 2007), but calicoblasts show differences in their morphology, ranging from very thin, long and flat to thick and cup like
(Tam-butté et al., 2007). A major controlling factor on the cell shape is the calcification activity, with flat calicoblasts corre-sponding to low calcification activity and thick calicoblasts to high calcification activity (Tambutté et al., 2007). These different cell morphologies might be the reason for different types of precipitation: ACC, a proposed precursor phase of aragonite (Von Euw et al., 2017; Rollion-Bard et al., 2010), and granular crystals in the COC regions or organo-mineral fibers in the fibrous deposits. The precipitation of ACC in the COC would certainly explain the enrichment of Mg in these areas, as it is necessary to stabilize the otherwise un-stable ACC (Von Euw et al., 2017); however, the relevance of ACC to coral calcification has been questioned as it has so far not been possible to form ACC under carbonate sys-tem conditions thought to characterize the calcification space (Evans et al., 2019). Alternatively, the COC are known to be rich in organic material (Cuif et al., 2003; Stolarski, 2003), which would also explain the enrichment of Mg as well as a slight enrichment of Na. However, the amount of Na bound to organic material is not high enough (Amiel et al., 1973) for the enrichment in the COC to be explained solely by high organic contents. Kinetic effects, due to rapid calcifi-cation rates, are more likely to be the main control for Na variations in COC and fibrous deposits. Since Na is incorpo-rated into the aragonite lattice by direct substitution with Ca (Okumura and Kitano, 1986; Yoshimura et al., 2017), charge differences occur due to the exchange in divalent Ca with monovalent Na. These charge differences need to be com-pensated for by lattice defects (CO2−3 vacancies), which oc-cur more often at higher precipitation rates (Mucci, 1988; White, 1977; Yoshimura et al., 2017). Growth rate effects are also known for the incorporation of Mg into inorganic arag-onite, although these effects are more likely to result from crystal surface entrapment of Mg by newly formed aragonite (Gabitov et al., 2008, 2011; Watson, 1996).
Sr/Ca ratios in the warm-water coral Pocillopora damicor-nisseem to be largely unaffected by growth rate changes over a range of 1 to over 50 µm d−1(Brahmi et al., 2012), at least when comparing different skeletal architectures (Fig. 2). This is supported by our data as the observed Sr/Ca ratios show no significant decrease in the COC or COC-like areas as would be expected from the results of de Villiers et al. (1994) despite the significantly different growth rates in these ar-eas (COC > 50–60 µm d−1, FD = 1–3 µm d−1; Brahmi et al., 2012). In fact, an increase in the COC is more often but still not regularly visible (Cohen et al., 2006). Consequently, a significant effect of the different skeletal architectures on Sr/Ca ratios in coralline aragonite can be excluded. Slight in-creases in the COC, however, can be explained with the great adsorption potential of Sr to organic matter (Chen, 1997; Khani et al., 2012; Kunioka et al., 2006).
4.2.1 Salinity
Recently, Na/Ca ratios in foraminiferal calcite have been suggested as a potential salinity proxy (Allen et al., 2016; Bertlich et al., 2018; Mezger et al., 2016; Wit et al., 2013). Ishikawa and Ichikuni (1984) proposed that the activity of Na in seawater is the primary controlling factor for the incor-poration of Na in calcite. However, more recent studies have shown that Na/Ca in foraminiferal calcite is mainly driven by the seawater Na/Ca ratio instead of the Na activity when this is the dominant variable (Evans et al., 2018; Hauzer et al., 2018). Species-specific offsets make further biological con-trols highly plausible.
In this study, no correlation between salinity and Na/Ca ratios is present (Fig. 3). The positive trend up to 35 g kg−1 followed by a negative trend after 35 g kg−1can be explained by growth rate changes due to the changing salinity. To our knowledge no studies on the effect of salinity on growth rates have been conducted on D. pertusum, but it is plausible that it shows reduced growth rates in salinities diverging from the biological optimum similar to other marine organisms (e.g., M. edulis; Malone and Dodd, 1967). A specific osmoregula-tion is probably not needed for CWCs in the mostly salinity-stable habitats they live in (Roberts et al., 2009). Reduced growth rates consequently lower the amount of lattice defects and the amount of possible incorporation sites for sodium (Mucci, 1988; White, 1977; Yoshimura et al., 2017) if bulk extension rates are indeed related to crystal growth rates.
If Na/Ca ratios in corals are controlled by changes in cal-cification rate, a calcal-cification rate proxy could be used to cor-rect this effect. Sr/Ca ratios have been discussed as a pos-sible growth rate proxy (de Villiers et al., 1994) and may be used to determine changes in growth rate. However, our data show that the Sr/Ca ratios remain constant with chang-ing salinities. Accordchang-ingly, concludchang-ing from the results of de Villiers et al. (1994), the calcification rate would remain con-stant over the whole salinity range. It should be noted that higher growth rates do not necessarily imply higher calcifi-cation rates or vice versa. A higher growth rate can also be caused by higher organic deposits in the skeleton (Stolarski, 2003). Therefore, a change in calcification cannot necessarily be inferred from changing Sr/Ca ratios. Still, the effects that growth or calcification rate changes and the different skele-tal architectures have on Sr/Ca ratios in corals are still dis-cussed. There is evidence for positive and negative correla-tion of Sr/Ca with growth and calcificacorrela-tion rate as well as the different skeletal architectures (Allison and Finch, 2004; Co-hen et al., 2006; Kunioka et al., 2006; Raddatz et al., 2013). It still remains unknown why there is no persistent Sr/Ca vari-ation between the differential skeletal architectures (COC, fibrous deposits) in this study despite being visible in sev-eral other studies (Cohen et al., 2006; Gagnon et al., 2007; Raddatz et al., 2013). An explanation could be the low
sam-of COC and fibrous zone material. Further research is needed to evaluate the effects of growth and calcification rates on Sr/Ca ratios in biogenic carbonates.
4.2.2 Temperature
A temperature control on Na/Ca ratios has been shown in inorganic precipitated aragonite (White, 1977) and in the planktonic foraminifera G. ruber and G. sacculifer (Mezger et al., 2016), although temperature and salinity covary in that study. Furthermore, Rollion-Bard and Blamart (2015) suggest a possible temperature control on Na/Ca ratios in the CWC D. pertusum and the warm-water coral Porites sp. However, the temperature sensitivity in inorganically precip-itated aragonite is far lower compared to the biogenic arago-nite from CWCs including a systematic offset of Kd (15Na ◦C)=
1.17 × 10⁻⁴. Interestingly, other marine carbonates (Porites sp., M. edulis) also fit in the calculated temperature sensi-tivity. This holds true for biogenic aragonite and biogenic calcite, where M. edulis fits into the temperature sensitivity found by Mezger et al. (2016). A combined regression using the data from Evans et al. (2018), Mezger et al. (2016), and Lorens and Bender (1980) reveals a temperature sensitivity of −0.37 mmol mol−1◦C−1, which is strikingly similar to the sensitivity in aragonite of −0.31 mmol mol−1◦C−1 (Fig. 6). The samples that Mezger et al. (2016) used in their study de-rive from the Red Sea, where a negative correlation between the seawater salinity and seawater temperature exists. They conclude that the salinity effect on Na/Ca ratios and the co-variance between salinity and temperature cause the temper-ature sensitivity of Na/Ca ratios. However, it is also possible that the salinity sensitivity is caused by a temperature effect. The apparent offset between inorganically precipitated aragonite and biogenic carbonates further implies a biologi-cal control on Na incorporation. In contrast to other elements such as lithium (Montagna et al., 2014), the high correlation between D. pertusum, M. oculata, the caryophylliid species, Porites sp. and M. edulis implies that the Na/Ca variance introduced by these possibly occurring vital effects appears to be similar for all these species. We suggest that similar Na pathways into the calcifying space exist in foraminifera, mussels and scleractinian warm-water as well as cold-water corals, and temperature exerts a strong control on the activ-ity of these pathways, altering the sodium availabilactiv-ity dur-ing calcification. Further controls are possibly contributed by temperature-dependent solubility variations in CaCO3 and
Na2CO3and an exothermic Na incorporation mechanism.
Bertlich et al. (2018) proposed that lower temperatures in-crease the solubility of calcium carbonate and inin-crease the amount of free Ca, leading to higher Na/Ca ratios at lower temperatures. Yet such a solubility-controlled temperature effect on calcite and aragonite is rather small, whereas the sensitivity to pressure changes is much more pronounced (Pytkowicz and Conners, 1964; Zeebe and Wolf-Gladrow,
Figure 6. Compiled Na/Ca ratios from different studies. D. per-tusum, M. oculata, M. edulis and Porites sp. show a negative lin-ear relation with water temperature. R2relates only to the arag-onitic samples. Calcitic samples from M. edulis and Globigeri-noides ruber show the same sensitivity, albeit with an offset of 10 mmol mol−1. Temperature for the data from Lorens and Bender (1980) amounts to the average temperature of the tank the corals were cultivated in, while the error bars show maximum and mini-mum values.
2001). Accordingly, the Na/Ca ratio should also decrease with water depth. Here we do observe a relationship between Na/Ca ratios and water depth, but at constant temperatures (7.2–7.8◦C) there is no effect of water depth (160–280 m) on Na/Ca ratios. The relationship between depth and Na/Ca ratios is therefore presumably caused by the positive correla-tion between water temperature and water depth. A decrease in Na/Ca ratios with temperatures could also be explained by solubility effects similar to the effects that are discussed to cause the temperature effects on Li/Ca ratios (Marriott et al., 2004). The solubility of Na2CO3 increases with increasing
temperature (Haynes et al., 2016). Again, this would result in decreasing Na/Ca ratios with increasing temperature be-cause the solubility of Na2CO3decreases relative to calcium
carbonate (Haynes et al., 2016), making it thermodynami-cally less favorable to incorporate Na. The effects of pres-sure on the solubility of Na2CO3cannot be quantified at the
moment due to the lack of studies.
Moreover, the temperature effect can also be caused by an exothermic substitution mechanism of Na into the aragonite lattice, similar to the incorporation of Mg in calcite (Mucci and Morse, 1990). If the substitution between Ca and Na is exothermic, consequently the incorporation of Na is favored
at lower temperatures. However, there is to our knowledge, no study available that contains enthalpy data for this reac-tion. While the proposed mechanism by Bertlich et al. (2018) can be excluded as an explanation for the temperature sen-sitivity of Na/Ca ratios, the other explanations are equally plausible in terms of the existing studies. Still, the differences in the temperature sensitivity between inorganic precipitated aragonite and biogenic aragonite require further biological controls to explain this deviation.
As an alternative, we explore whether temperature-dependent Na membrane pathways can explain tempera-ture effects on aragonitic Na/Ca ratios. There are sev-eral enzymes and ion pumps known that constitute sodium pathways through the membrane of the calcifying space. Na+/K+ATPase are known from the tropical coral Galaxea fascicularis (Ip and Lim, 1991), Na/Ca ion pumps are suggested to exist in Galaxea fascicularis and Tubastraea faulkneri (Marshall, 1996). Na+/K+ ATPase was found
in the bivalve species M. edulis and Limecola balthica (Pagliarani et al., 2006; Wang and Fisher, 1999) as well as Na/Mg ion pumps in Ruditapes philippinarum and Mytilus galloprovincialis(Pagliarani et al., 2006). Whether these en-zymes exist in D. pertusum is unknown, but since corals pos-sess a nervous system (Chen et al., 2008) and D. pertusum shows a reaction to electrical stimulation (Shelton, 1980) at least the existence of Na+/K+ ATPase must be assumed. However, it remains unclear if this enzyme participates in the modification of the calcifying fluid. The participation of Na/Ca ion pumps is also plausible, since it would result in higher Ca concentrations in the calcifying space, which would aid the calcification process due to the high transport capacity (Carafoli et al., 2001). Membrane calcium pumps on the other hand are better suited to transport Ca from a compartment with low Ca concentrations, which is not appli-cable when considering seawater as the source compartment (Wang et al., 1992). Since the activity of enzymes is a func-tion of temperature (Sizer, 2006), a temperature control of the ion concentration in the calcifying fluid has to be considered. Rising temperatures would increase the activity of the par-ticular enzyme following the Arrhenius equation (Arrhenius, 1896) and consequently lower the Na concentration in the calcifying space. Unfortunately, it is impossible to quantify these effects from the data at hand because the optimum tem-perature and activation energy is not enzyme specific but fur-ther controlled by enzyme and substrate purity and the pres-ence of inhibitors or activators. Specific research is needed to identify the particular enzyme in these corals as well as to determine the rate of ion exchange, although we note that an enzymatic control on aragonitic Na/Ca ratios does not nec-essarily imply a temperature control. In addition, besides a temperature control, there is also a pH control on enzyme activity (Trivedi and Danforth, 1966). While a positive cor-relation between Na/Ca and seawater pH is present in the samples utilized here, it is not possible to determine if this is caused by pH-controlled enzymatic activity or due to an
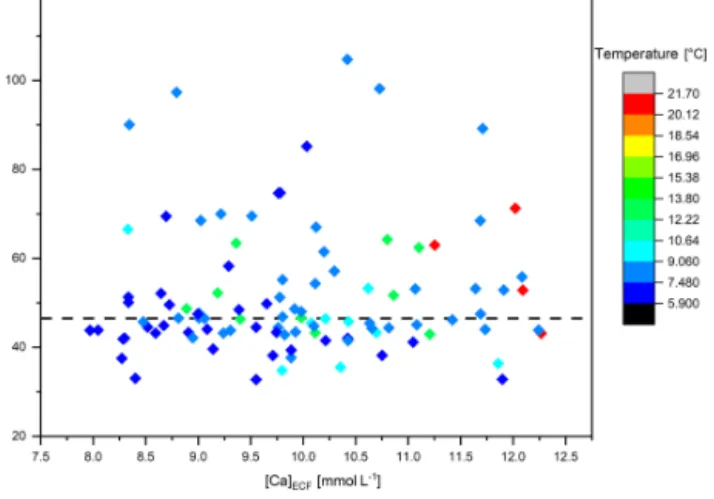
Figure 7. Calcium and Magnesium concentration in the ECF of the investigated corals. The color of the data points indicates the ambi-ent water temperature, which increases with increasing Ca concen-trations. The dashed line indicates the median of the Mg concentra-tion in the ECF.
increased calcification rate. Higher seawater pH would cause higher calcification fluid pH, which would consequently also increase the aragonite saturation in the calcifying fluid (Mc-Culloch et al., 2012). The degree of pH elevation in the coral calcifying space would, therefore, decrease, ultimately con-serving energy (≈ 10 %/−0.1 pHSW), which can be used for
ATP (adenosine triphosphate)-dependent transport proteins, pumping more Ca or CO2−3 and leading to faster calcification (McCulloch et al., 2012). It is also possible that the apparent sensitivity of Na/Ca to pH changes is caused by the negative covariance of pH and temperature.
Admittedly, the above discussion is only viable under the assumption of a closed calcifying space with a much lower [Na]ECF than [Na]Seawater. In the case of an open or
semi-enclosed calcifying space with [Na]ECF close or equal to
[Na]Seawater, the amount of Na removed by enzymes or other
ion pumps is far too low to cause any significant changes in the composition of the calcifying fluid with regards to Na. In combination with the low distribution coefficient, changes in the Na concentration of the ECF cannot cause the high variability of the skeletal Na/Ca ratios. Since there is evi-dence for an at least semi-enclosed calcifying space (Tam-butté et al., 2011), we also consider this option. As described in Sect. 3.3 it is possible to calculate the Mg concentra-tion of the ECF under the assumpconcentra-tion of seawater leakage into the calcifying space (Adkins et al., 2003; Gagnon et al., 2012) and a resulting approximately constant Na concentra-tion. Based on this hypothesis, and the calculations defined in Eqs. (3) and (4), we show that the Mg concentration in the ECF is constant, but with changing Ca concentration (Fig. 7). There is a large degree of scatter in the [Mg]ECF
reconstruc-tions (Fig. 7), which we suggest is unlikely to represent real changes in the ECF [Mg] as it is difficult to envisage a pur-pose for elevating [Mg]ECFabove the [Mg] of seawater given
tion by acting antagonistic to the calcium transport (Okazaki, 1956; Swart, 1981; Yamazato, 1966). It may be that the scat-ter above seawascat-ter values is derived from the presence of organic material, as a small positive bias in measured coral Mg/Ca would result in a large overestimation of [Mg]ECF.
Crucially however, we find that [Mg]ECF does not change
as a function of [Ca]ECF, with the implication that in this
model, changing skeletal Mg/Ca and Na/Ca ratios are not caused by changes in the Mg or Na concentration of the ECF but rather are entirely explicable through changes in the Ca concentration. Again, this might be caused by temperature-dependent enzyme or ion-pump activity. Higher temperatures would then cause a higher exchange capacity (Elias et al., 2001), leading to higher Ca- (Fig. 7) and marginally lower Na concentrations in the ECF and consequently lower Mg/Ca and Na/Ca ratios. An elevation of [Ca] in the ECF and the calcifying front is also supported by recent studies from De-carlo et al. (2018) and Sevilgen et al. (2019), who conducted Raman spectroscopic, δ11B and microsensor measurements on Pocillopora damicornis, Acropora yongei and Stylophora pistilla. The results furthermore indicate the involvement of transcellular pathways to elevate the Ca concentration in the ECF (Sevilgen et al., 2019).
Even though a clear correlation between temperature and Na/Ca is present, the usefulness of Na/Ca ratios is greatly reduced due to the large intraspecies variability. At 6◦C Na/Ca ratios vary by up to 20 % and even up to 10 % in a single polyp. There are several possible reasons for this vari-ability. One is the insufficient removal of the COC during the sampling process. Due to the high growth rate and high or-ganic content in the COC, elements, such as Mg, Na and Li, are enriched, whereas others, like U, are depleted (Gagnon et al., 2007; Raddatz et al., 2013, 2014a; Robinson et al., 2014; Rollion-Bard and Blamart, 2014, 2015). This effect would also explain the high Na/Ca values in corals from the Mediterranean Sea (T = 13.56◦C). It is possible that during the sampling process a larger amount of the fibrous deposits was removed in comparison to the other samples. This would cause a greater effect of the enriched COC ma-terial and therefore cause higher Na/Ca ratios. It is therefore preferable to use in situ techniques (laser ablation, EPMA (electron probe microanalyzer), SIMS (secondary ion mass spectrometry)) instead of solution-based chemistry and pro-file measurements through the theca wall instead of bulk samples because it allows for a better recognition and re-moval of values that derive from COC or COC-like struc-tures. Seasonality could be also a factor responsible for a percentage of the variation, but the sampled corals originate from depths where seasonality presumably only plays a mi-nor role. An estimated seasonal temperature change of 4◦C only suffices to explain 1 mmol mol−1variation but not the observed variation of 10 mmol mol−1. From this, it can be inferred that there must be other controls on Na/Ca ratios besides water temperature. Diurnal temperature fluctuations
caused by internal waves as found, for example, in the Rock-all Trough are also not high enough (3◦C) to explain these
variations (Mienis et al., 2007). As mentioned in Sect. 4.1, calcification rates constitute a major control on Na/Ca ratios by controlling the amount of incorporation sites for Na (Ki-tano et al., 1975; Mucci, 1988; White, 1977; Yoshimura et al., 2017). Therefore, numerous second-order control factors could cause variations in the Na/Ca ratios by controlling the calcification rate. These second-order controls include nutri-ent availability and supply, changes in the carbonate system, coral fitness, and many more. Some of these controls (nu-trient supply, coral fitness) have the potential to vary with a high spatial resolution and consequently cause great vari-ations in Na/Ca ratios even if the samples derive from the same colony.
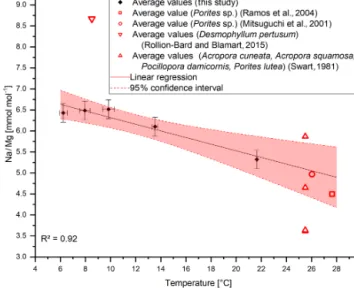
4.3 Na/Mg ratios to overcome vital effects
Even though a good correlation of R2=0.9 between Na/Ca and temperature is observable in our data, the samples from the Mediterranean Sea (T = 13.54◦C) show slightly elevated Na/Ca ratios. Reasons for this are discussed in Sect. 4.2. Rollion-Bard and Blamart (2015) proposed Na/Mg ratios to overcome these effects. The basis for this is that Na/Ca and Mg/Ca ratios could be controlled by similar vital effects such as growth rate and the amount of organic content. Combin-ing Na/Ca and Mg/Ca ratios reduces the impact of these effects, though the temperature sensitivity of Na/Ca ratios is preserved as Mg/Ca ratios show no apparent correlation with temperature (Fig. 8). The resulting regression between Na/Mg and temperature yields the following equation:
fT6−22◦C=7.1 ± 0.17 − 0.07 ± 0.01 × T
(R2=0.92, P = 0.009). (5)
The application of Na/Mg in this study does not signifi-cantly improve the regression, as it removes the inverse cor-relation between 6 and 10◦C. This might be caused by co-variance between sodium and magnesium. It was shown that magnesium in the parent solution reduces the amount of in-corporated sodium (Okumura and Kitano, 1986). However, utilizing Na/Mg ratios removes the striking irregularity at 13.54◦C. The large scatter, however, is not significantly duced, which implies further vital effects that cannot be re-solved with this technique. To overcome this, the mean of at least 10 analyzed samples should be used to obtain reliable results. If these prerequisites are fulfilled, Na/Mg and Na/Ca could provide a means of reconstructing temperature. This could prove useful especially for temperature reconstructions in deep time on organisms that are extinct today. In this case the nearest living relative principle is used, which potentially introduces large errors. Further research on different arag-onitic and calcitic organisms is necessary to detect further species that show the same temperature sensitivity. If it is shown that Na/Ca and/or Na/Mg ratios show no species-specific variations, empirical calibrations could be applied to
Figure 8. Na/Mg ratios from this study vs. water temperature. Na/Mg ratios can be used to correct for the sampling of varying proportions of different domains. The y error bars relate to 2 SD of the JCp-1 measurements. The x error bars relate to 1 SD of the temperature mean for the chosen temperature ranges.
extinct species for which proxy calibrations are not possible. Still though, when using Na/Ca for temperature reconstruc-tions, changes in seawater have to be considered that would lead to an underestimation of temperature at high pH. How-ever, Na/Mg shows no sensitivity to changes in seawater pH, so by combining Na/Ca and Mg/Ca ratios, this effect can be ignored.
5 Conclusion
The data at hand do not support the utility of Na/Ca in cold-water corals as a salinity proxy as proposed by Wit et al. (2013) and Mezger et al. (2016) for biogenic calcite. While there is a positive trend between Na/Ca and salinity when excluding data from the Red Sea samples, it is not sta-tistically significant.
A significant inverse correlation between temperature and Na/Ca ratios is present, which cannot be explained by a co-variance of temperature and salinity (cf. Mezger et al., 2016). Two additional organisms, Porites sp. (Mitsuguchi et al., 2001; Ramos et al., 2004) and M. edulis (Lorens and Bender, 1980) fit in this regression too. The mechanism of sodium incorporation, therefore, appears to be consistent between these three species. We propose temperature-dependent ac-tivity in Na ion or Ca ion transport proteins as the underlying mechanism behind the observable correlation. While the in-traspecies and intraindividual variation is large, Na/Ca can be well correlated to environmental variables when based on the averages of several specimens. Therefore, Na/Ca ratios might provide a temperature proxy that is usable for a wide variety of aragonitic organisms and maybe even calcitic
or-Na/Mg ratios can be used to correct for inconsistencies dur-ing the sampldur-ing process.
Data availability. All of the data used are found in the Supplement.
Supplement. The supplement related to this article is available on-line at: https://doi.org/10.5194/bg-16-3565-2019-supplement.
Author contributions. JR and NS designed the experiments and conducted the measurements. JR, AF, LB, AR and VL provided samples and environmental data. NS prepared the paper with con-tributions from all co-authors.
Competing interests. The authors declare that they have no conflict of interest.
Acknowledgements. We are grateful to all cruise captains, crew members and cruise participants of research cruises POS325, POS391, POS455, POS 385, M61, POS625, B10-17a/b, 64PE284, M70/1, COR2, MSM20-4, KRSE2013 and RV Gunnerus. Ship time of RV Belgica was provided by BELSPO and RBINS–OD Nature.
FIERCE is financially supported by the Wilhelm and Else Heraeus Foundation, which is gratefully acknowledged. This is FIERCE contribution no. 002.
Financial support. This research has been supported by the DFG (grant nos. RI 598/4-1, ECHO RA 2516-1), the Swiss National Sci-ence Foundation (grant no. 200021_149247) and the Wilhelm and Else Heraeus Foundation.
Review statement. This paper was edited by Aldo Shemesh and re-viewed by William Gray and one anonymous referee.
References
Adkins, J. F., Boyle, E. A., Curry, W. B., and Lutringer, A.: Stable isotopes in deep-sea corals and a new mechanism for “vital effects”, Geochim. Cosmochim. Ac., 67, 1129–1143, https://doi.org/10.1016/S0016-7037(02)01203-6, 2003. Al-Horani, F. A., Al-Moghrabi, S. M., and De Beer, D.: The
mech-anism of calcification and its relation to photosynthesis and respiration in the scleractinian coral Galaxea fascicularis, Mar. Biol., 142, 419–426, https://doi.org/10.1007/s00227-002-0981-8, 2003.
Allemand, D., Tambutté, É., Zoccola, D. and Tambutté, S.: Coral Calcification, Cells to Reefs, in: Coral Reefs: An Ecosystem in Transition, pp. 119–150, Springer, Dordrecht, the Netherlands, 2011.
thal, Y., and Yu, J.: Trace element proxies for surface ocean conditions: A synthesis of culture calibrations with plank-tic foraminifera, Geochim. Cosmochim. Ac., 193, 197–221, https://doi.org/10.1016/j.gca.2016.08.015, 2016.
Allison, N. and Finch, A. A.: High-resolution Sr/Ca records in modern Porites lobata corals: Effects of skeletal extension rate and architecture, Geochem. Geophy. Geosy., 5, Q05001, https://doi.org/10.1029/2004GC000696, 2004.
Amiel, A. J., Friedman, G. M., and Miller, D. S.: Distribution and nature of incorporation of trace elements in modern aragonitic corals, Sedimentology, 20, 47-64, https://doi.org/10.1111/j.1365-3091.1973.tb01606.x, 1973.
Anagnostou, E., Sherrell, R. M., Gagnon, A., LaVigne, M., Field, M. P., and McDonough, W. F.: Seawater nutrient and carbonate ion concentrations recorded as P/Ca, Ba/Ca, and U/Ca in the deep-sea coral Desmophyllum dianthus, Geochim. Cosmochim. Ac., 75, 2529–2543, https://doi.org/10.1016/j.gca.2011.02.019, 2011.
Anagnostou, E., Huang, K. F., You, C. F., Sikes, E. L., and Sherrell, R. M.: Evaluation of boron isotope ratio as a pH proxy in the deep sea coral Desmophyllum dianthus: Evidence of physiolog-ical pH adjustment, Earth Planet. Sc. Lett., 349–350, 251–260, https://doi.org/10.1016/j.epsl.2012.07.006, 2012.
Arrhenius, S.: XXXI. On the influence of carbonic acid in the air upon the temperature of the ground, Dublin Philos. Mag. J. Sci., London, Edinburgh, 41, 237–276, https://doi.org/10.1080/14786449608620846, 1896.
Bertlich, J., Nürnberg, D., Hathorne, E. C., de Nooijer, L. J., Mezger, E. M., Kienast, M., Nordhausen, S., Re-ichart, G.-J., Schönfeld, J., and Bijma, J.: Salinity con-trol on Na incorporation into calcite tests of the planktonic foraminifera Trilobatus sacculifer – evidence from culture exper-iments and surface sedexper-iments, Biogeosciences, 15, 5991–6018, https://doi.org/10.5194/bg-15-5991-2018, 2018.
Bett, B. J.: UK Atlantic Margin Environmental Survey: Introduction and overview of bathyal benthic ecology, Cont. Shelf Res., 21, 917–56, https://doi.org/10.1016/S0278-4343(00)00119-9, 2001. Blamart, D., Rollion-Bard, C., Meibom, A., Cuif, J. P., Juillet-Leclerc, A., and Dauphin, Y.: Correlation of boron isotopic composition with ultrastructure in the deep-sea coral Lophelia pertusa: Implications for biomineraliza-tion and paleo-pH, Geochem. Geophy. Geosy., 8, 1–11, https://doi.org/10.1029/2007GC001686, 2007.
Bollmann, J., Herrle, J. O., Cortés, M. Y., and Fielding, S. R.: The effect of sea water salinity on the morphology of Emiliania hux-leyi in plankton and sediment samples, Earth Planet. Sc. Lett., 284, 320–328, https://doi.org/10.1016/j.epsl.2009.05.003, 2009. Brahmi, C., Kopp, C., Domart-Coulon, I., Stolarski, J., and Meibom, A.: Skeletal growth dynamics linked to trace-element composition in the scleractinian coral Pocillo-pora damicornis, Geochim. Cosmochim. Ac., 99, 146–158, https://doi.org/10.1016/j.gca.2012.09.031, 2012.
Branson, O., Bonnin, E. A., Perea, D. E., Spero, H. J., Zhu, Z., Winters, M., Hönisch, B., Russell, A. D., Fehrenbacher, J. S., and Gagnon, A. C.: Nanometer-Scale Chemistry of a Calcite Biomineralization Template: Implications for Skeletal Composi-tion and NucleaComposi-tion, P. Natl. Acad. Sci. USA, 113, 12934–12939, https://doi.org/10.1073/pnas.1522864113, 2016.
Büscher, J. V., Form, A. U., and Riebesell, U.: Interactive Ef-fects of Ocean Acidification and Warming on Growth, Fit-ness and Survival of the Cold-Water Coral Lophelia pertusa under Different Food Availabilities, Front. Mar. Sci., 4, 1–14, https://doi.org/10.3389/fmars.2017.00101, 2017.
Busenberg, E. and Niel Plummer, L.: Kinetic and thermodynamic factors controlling the distribution of SO2−3 and Na+in calcites and selected aragonites, Geochim. Cosmochim. Ac., 49, 713– 725, https://doi.org/10.1016/0016-7037(85)90166-8, 1985. Carafoli, E., Santella, L., Branca, D., and Brini, M.:
Gen-eration, control, and processing of cellular calcium sig-nals, Crit. Rev. Biochem. Mol. Biol., 36, 107–260, https://doi.org/10.1080/20014091074183, 2001.
Chen, E., Stiefel, K. M., Sejnowski, T. J., and Bullock, T. H.: Model of traveling waves in a coral nerve network, J. Comp. Physiol. A Neuroethol. Sensory, Neural, Behav. Physiol., 194, 195–200, https://doi.org/10.1007/s00359-007-0305-z, 2008.
Chen, J.-P.: Batch and Contunuous Adsorption of Stontium by Plant Root Tissues, Bioresour. Technol., 60, 185–189, https://doi.org/10.1016/S0960-8524(97)00021-7, 1997. Cohen, A. L., Gaetani, G. A., Lundälv, T., Corliss, B.
H., and George, R. Y.: Compositional variability in a cold-water scleractinian, Lophelia pertusa: New insights into “vital effects”, Geochem. Geophy. Geosy., 7, Q12004, https://doi.org/10.1029/2006GC001354, 2006.
Constantz, B. R.: Skeletal Organization in Caribbean Acropora Spp. (Lamarck), in: Origin, Evolution, and Modern Aspects of Biomineralization in Plants and Animals, pp. 175–199, Springer, Boston, MA, USA, 1989.
Cuif, J.-P. and Dauphin, Y.: Microstructural and physico-chemical characterization of ‘centers of calcification’ in septa of some Re-cent scleractinian corals, Paläontologische Zeitschrift, 72, 257– 270, https://doi.org/10.1007/BF02988357, 1998.
Cuif, J. P., Dauphin, Y. Y., Doucet, J., Salome, M., and Susini, J.: XANES mapping of organic sulfate in three sclerac-tinian coral skeletons, Geochim. Cosmochim. Ac., 67, 75–83, https://doi.org/10.1016/S0016-7037(02)01041-4, 2003. Decarlo, T., Comeau, S., Cornwall, C., McCulloch, M., and Edward,
C.: Coral resistance to ocean acidification linked to increased cal-cium at the site of calcification, P. Roy. Soc. B-Biol. Sci., 285, 20180564, https://doi.org/10.1098/rspb.2018.0564, 2018. de Villiers, S., Shen, G. T., and Nelson, B. K.: The
Sr/Ca-temperature relationship in coralline aragonite: Influence of variability in (Sr/Ca)Seawater and skeletal growth parameters, Geochim. Cosmochim. Ac., 58, 197–208, https://doi.org/10.1016/0016-7037(94)90457-X, 1994.
Druffel, E. R. M.: Geochemistry of corals: Proxies of past ocean chemistry, ocean circulation, and climate, P. Natl. Acad. Sci. USA, 94, 8354–8361, https://doi.org/10.1073/pnas.94.16.8354, 1997.
Dullo, W. C., Flögel, S., and Rüggeberg, A.: Cold-water coral growth in relation to the hydrography of the Celtic and Nordic European continental margin, Mar. Ecol. Prog. Ser., 371, 165– 176, https://doi.org/10.3354/meps07623, 2008.
Elderfield, H. and Ganssen, G.: Past temperature and δ18O of sur-face ocean waters inferred from foraminiferal Mg/Ca ratios, Na-ture, 405, 442–445, https://doi.org/10.1038/35013033, 2000. Elderfield, H., Ferretti, P., Greaves, M., Crowhurst, S. J.,
McCave, I. N., Hodell, D. A., and Piotrowski, A. M.:
Evolution of ocean temperature, Science, 337, 704–709, https://doi.org/10.1594/PANGAEA.786205, 2012.
Elias, C. L., Xue, X. H., Marshall, C. R., Omelchenko, A., Hryshko, L. V., and Tibbits, G. F.: Temperature dependence of cloned mammalian and salmonid cardiac Na(+)/Ca(2+) exchanger isoforms., Am. J. Physiol. Cell Physiol., 281, C993–C1000, https://doi.org/10.1111/j.1432-1033.1984.tb08031.x, 2001. Evans, D., Müller, W., and Erez, J.: Assessing foraminifera
biomin-eralisation models through trace element data of cultures under variable seawater chemistry, Geochim. Cosmochim. Ac., 236, 198–217, https://doi.org/10.1016/j.gca.2018.02.048, 2018. Evans, D., Webb, P., Penkman, K. E. H., Kroger, R., and
Allison, N.: The characteristics and biological relevance of inorganic amorphous calcium carbonate (ACC) pre-cipitated from seawater, Cryst. Growth Des., 4300–4313, https://doi.org/10.1021/acs.cgd.9b00003, 2019.
Finch, A. A. and Allison, N.: Mg structural state in coral aragonite and implications for the paleoenvironmental proxy, Geophys. Res. Lett., 35, 1–5, https://doi.org/10.1029/2008GL033543, 2008.
Flögel, S., Dullo, W. C., Pfannkuche, O., Kiriakoulakis, K., and Rüggeberg, A.: Geochemical and physical constraints for the oc-currence of living cold-water corals, Deep-Sea Res. Pt. II, 99, 19–26, https://doi.org/10.1016/j.dsr2.2013.06.006, 2014. Form, A. U. and Riebesell, U.: Acclimation to ocean
acid-ification during long-term CO2 exposure in the cold-water
coral Lophelia pertusa, Glob. Chang. Biol., 18, 843–853, https://doi.org/10.1111/j.1365-2486.2011.02583.x, 2012. Freiwald, A.: Reef-Forming Cold-Water Corals, in Ocean Margin
Systems, pp. 365–385, Springer, Berlin, Heidelberg, 2002. Freiwald, A. and Roberts, J. M. (Eds.): Cold-Water Corals and
Ecosystems, Springer, Berlin, Heidelberg, 2005.
Freiwald, A., Beuck, L., Rüggeberg, A., Taviani, M., and Hebbeln, D.: The White Coral Community in the Central Mediterranean Sea Revealed by ROV Surveys, Oceanography, 22, 58–74, https://doi.org/10.5670/oceanog.2009.06, 2009.
Gabitov, R. I., Gaetani, G. A., Watson, E. B., Cohen, A. L., and Ehrlich, H. L.: Experimental determination of growth rate ef-fect on U6+and Mg2+partitioning between aragonite and fluid at elevated U6+concentration, Geochim. Cosmochim. Ac., 72, 4058–4068, https://doi.org/10.1016/j.gca.2008.05.047, 2008. Gabitov, R. I., Schmitt, A. K., Rosner, M., McKeegan, K. D.,
Gaetani, G. A., Cohen, A. L., Watson, E. B., and Harri-son, T. M.: In situ δ7Li, Li/Ca, and Mg/Ca analyses of syn-thetic aragonites, Geochem. Geophys. Geosyst., 12, Q03001, https://doi.org/10.1029/2010GC003322, 2011.
Gagnon, A. C., Adkins, J. F., Fernandez, D. P., and Robinson, L. F.: Sr/Ca and Mg/Ca vital effects correlated with skeletal architecture in a scleractinian deep-sea coral and the role of Rayleigh fractionation, Earth Planet. Sc. Lett., 261, 280–295, https://doi.org/10.1016/j.epsl.2007.07.013, 2007.
Gagnon, A. C., Adkins, J. F., and Erez, J.: Seawater transport during coral biomineralization, Earth Planet. Sc. Lett., 329–330, 150– 161, https://doi.org/10.1016/j.epsl.2012.03.005, 2012.
Gordon, C. M., Carr, R. A., and Larson, R. E.: the Influ-ence of Environmental Factors on the Sodium and Manganese Content of Barnacle Shells, Limnol. Oceanogr., 15, 461–466, https://doi.org/10.4319/lo.1970.15.3.0461, 1970.
Boer, W., Caillon, N., Case, D., Cobb, K. M., Douville, E., De-Menocal, P., Eisenhauer, A., Garbe-Schönberg, D., Geibert, W., Goldstein, S., Hughen, K., Inoue, M., Kawahata, H., Kölling, M., Cornec, F. L., Linsley, B. K., McGregor, H. V., Montagna, P., Nurhati, I. S., Quinn, T. M., Raddatz, J., Rebaubier, H., Robinson, L., Sadekov, A., Sherrell, R., Sinclair, D., Tudhope, A. W., Wei, G., Wong, H., Wu, H. C., and You, C.-F.: In-terlaboratory study for coral Sr/Ca and other element/Ca ra-tio measurements, Geochem. Geophy. Geosy., 14, 3730–3750, https://doi.org/10.1002/ggge.20230, 2013.
Hauzer, H., Evans, D., Müller, W., Rosenthal, Y., and Erez, J.: Calibration of Na partitioning in the calcitic foraminifer Oper-culina ammonoides under variable Ca concentration: Toward re-constructing past seawater composition, Earth Planet. Sc. Lett., 497, 80–91, https://doi.org/10.1016/j.epsl.2018.06.004, 2018. Haynes, W. M., Lide, D. R., and Bruno, T. J.: CRC Handbook of
chemistry and physics: a ready-reference book of chemical and physical data, CRC Press, Boca Raton, Florida, 2016.
Henry, L.-A. and Roberts, J. M.: Global Biodiversity in Cold-Water Coral Reef Ecosystems, in Marine Animal Forests, pp. 1–21, Springer International Publishing, Cham, 2016.
Holcomb, M., Cohen, A. L., Gabitov, R. I., and Hutter, J. L.: Compositional and morphological features of arago-nite precipitated experimentally from seawater and biogeni-cally by corals, Geochim. Cosmochim. Ac., 73, 4166–4179, https://doi.org/10.1016/j.gca.2009.04.015, 2009.
Ip, Y. K. and Lim, A. L. L.: Are calcium and strontium transported by the same mechanism in the hermatypic coral Galaxey fascic-ularis?, J. Exp. Biol., 159, 507–513, 1991.
Ishikawa, M. and Ichikuni, M.: Uptake of sodium and potassium by calcite, Chem. Geol., 42, 137–146, https://doi.org/10.1016/0009-2541(84)90010-X, 1984.
Israelson, C. and Buchardt, B.: Strontium and oxygen isotopic com-position of East Greenland rivers and surface waters: Implication for palaeoenvironmental interpretation, Palaeogeogr. Palaeocl., 153, 93–104, https://doi.org/10.1016/S0031-0182(99)00068-1, 1999.
Jurikova, H., Liebetrau, V., Raddatz, J., Fietzke, J., Trotter, J., Rocholl, A., Krause, S., McCulloch, M., Rüggeberg, A., and Eisenhauer, A.: Boron isotope composition of the cold-water coral Lophelia pertusa along the Norwegian mar-gin: Zooming into a potential pH-proxy by combining bulk and high-resolution approaches, Chem. Geol., 513, 143–152, https://doi.org/10.1016/j.chemgeo.2019.01.005, 2019.
Khani, M. H., Pahlavanzadeh, H., and Alizadeh, K.: Biosorp-tion of strontium from aqueous soluBiosorp-tion by fungus As-pergillus terreus, Environ. Sci. Pollut. Res., 19, 2408–2418, https://doi.org/10.1007/s11356-012-0753-z, 2012.
Kinsman, D.: Trace cations in aragonite, Abstr. Geol. Soc. Am., 2, 596–597, 1970.
Kiriakoulakis, K., Fisher, E., Wolff, G. A., Freiwald, A., Grehan, A., and Roberts, J. M.: Lipids and nitrogen isotopes of two deep-water corals from the North-East Atlantic: initial results and im-plications for their nutrition, in: Cold-Water Corals and Ecosys-tems, pp. 715–729, Springer-Verlag, Berlin/Heidelberg, 2005. Kiriakoulakis, K., Freiwald, A., Fisher, E., and Wolff, G. A.:
Or-ganic matter quality and supply to deep-water coral/mound
sys-96, 159–170, https://doi.org/10.1007/s00531-006-0078-6, 2007. Kitano, Y., Okumura, M., and Idogaki, M.: Incorporation of sodium, chloride and sulfate with calcium carbonate., Geochem. J., 9, 75– 84, https://doi.org/10.2343/geochemj.9.75, 1975.
Kunioka, D., Shirai, K., Takahata, N., Sano, Y., Toyofuku, T., and Ujiie, Y.: Microdistribution of Mg/Ca, Sr/Ca, and Ba/Ca ra-tios in Pulleniatina obliquiloculata test by using a NanoSIMS: Implication for the vital effect mechanism, Geochem. Geophys. Geosyst., 7, Q12P20, doi:10.1029/2006GC001280, 2006. Lear, C., Elderfield, H., and Wilson, P.: Cenozoic
Deep-Sea Temperatures and Global Ice Volumes from Mg/Ca in Benthic Foraminiferal Calcite, Science, 287, 269–272, https://doi.org/10.1126/science.287.5451.269, 2000.
Lewis, E. and Wallace, D. W.: R: Program developed for CO2 sys-tem calculations ORNL/CDIAC-105, Carbon Dioxide Inf. Anal. CentreOak Ridge Natl. Lab. US Dep. Energy, Oak Ridge, Ten-nessee, 1998.
Locarnini, R. A., Mishonov, A. V, Antonov, J. I., Boyer, T. P., Garcia, H. E., Baranova, O. K., Zweng, M. M., Paver, C. R., Reagan, J. R., Johnson, D. R., Hamilton, M., Seidov, D., and Levitus, S.: World ocean atlas 2013, Volume 1, Temperature, edited by: O. C. L. National Oceanographic Data Center (U.S.) and N. E. S. United States Data, and Information Service, https://doi.org/10.7289/V55X26VD, 2013.
Lorens, R. B. and Bender, M. L.: The impact of solution chemistry on Mytilus edulis calcite and aragonite, Geochim. Cosmochim. Ac., 44, 1265–1278, https://doi.org/10.1016/0016-7037(80)90087-3, 1980.
Malone, P. G. and Dodd, J. R.: Temperature and salinity ef-fects on calcification rate in Mytilus edulis and its pale-oecological implications, Limnol. Oceanogr., 12, 432–436, https://doi.org/10.4319/lo.1967.12.3.0432, 1967.
Marriott, C. S., Henderson, G. M., Belshaw, N. S., and Tudhope, A. W.: Temperature dependence of δ7Li, δ44Ca and Li/Ca during growth of calcium carbonate, Earth Planet. Sc. Lett., 222, 615– 624, https://doi.org/10.1016/j.epsl.2004.02.031, 2004.
Marshall, A. T.: Calcification in hermatypic and ahermatypic corals, Science, 271, 637–639, https://doi.org/10.1126/science.271.5249.637, 1996.
McConnaughey, T.:13C and18O isotopic disequilibrium in biolog-ical carbonates: I. Patterns, Geochim. Cosmochim. Ac., 53, 151– 162, https://doi.org/10.1016/0016-7037(89)90282-2, 1989. McCulloch, M., Trotter, J., Montagna, P., Falter, J., Dunbar, R.,
Frei-wald, A., Försterra, G., López Correa, M., Maier, C., Rüggeberg, A., and Taviani, M.: Resilience of cold-water scleractinian corals to ocean acidification: Boron isotopic systematics of pH and sat-uration state up-regulation, Geochim. Cosmochim. Ac., 87, 21– 34, https://doi.org/10.1016/j.gca.2012.03.027, 2012.
Meibom, A., Cuif, J. P., Hillion, F., Constantz, B. R., Juillet-Leclerc, A., Dauphin, Y., Watanabe, T., and Dunbar, R. B.: Distribution of magnesium in coral skeleton, Geophys. Res. Lett., 31, 1–4, https://doi.org/10.1029/2004GL021313, 2004.
Mertens, K. N., Ribeiro, S., Bouimetarhan, I., Caner, H., Com-bourieu Nebout, N., Dale, B., De Vernal, A., Ellegaard, M., Fil-ipova, M., Godhe, A., Goubert, E., Grøsfjeld, K., Holzwarth, U., Kotthoff, U., Leroy, S. A. G., Londeix, L., Marret, F., Matsuoka, K., Mudie, P. J., Naudts, L., Peña-Manjarrez, J. L., Persson, A., Popescu, S. M., Pospelova, V., Sangiorgi,