HAL Id: cea-00268837
https://hal-cea.archives-ouvertes.fr/cea-00268837
Submitted on 1 Apr 2008
HAL is a multi-disciplinary open access
archive for the deposit and dissemination of
sci-entific research documents, whether they are
pub-lished or not. The documents may come from
teaching and research institutions in France or
abroad, or from public or private research centers.
L’archive ouverte pluridisciplinaire HAL, est
destinée au dépôt et à la diffusion de documents
scientifiques de niveau recherche, publiés ou non,
émanant des établissements d’enseignement et de
recherche français ou étrangers, des laboratoires
publics ou privés.
Improving sensitivity of a small angle x-ray scattering
camera with pinhole collimation using separated optical
elements
Thomas Zemb, Olivier Taché, Frédéric Né, Olivier Spalla
To cite this version:
Thomas Zemb, Olivier Taché, Frédéric Né, Olivier Spalla. Improving sensitivity of a small angle
x-ray scattering camera with pinhole collimation using separated optical elements. Review of Scientific
Instruments, American Institute of Physics, 2001, 74 (4), pp.2456. �10.1063/1.1556954�. �cea-00268837�
Improving sensitivity of a small angle x-ray scattering camera with pinhole
collimation using separated optical elements
Th. Zemb, O. Tache´, F. Ne´, and O. Spallaa)
Service de Chimie Mole´culaire (D.R.E.C.A.M./C.E.A.), C.E./Saclay, F91191 Gif sur Yvette Cedex, France 共Received 12 July 2001; accepted 5 January 2003兲
We show that a significant improvement in the sensitivity of a Huxley–Holmes design for a small angle x-ray scattering camera is obtained by separating the mirror and the monochromator. The design of the camera involves a long x-ray mirror close to a point x-ray source associated with a curved focusing crystal located close to the sample. The sample area is located at half the distance between the source and detector planes. Diffuse scattering produced by the mirror is not incident on the focusing crystal, thus reducing the background signal. Complete elimination of hard x rays allows precise calibration and hence absolute determination of sample cross section by means of a semitransparent beam stop. In pinhole geometry, the flux corresponds to a⬃107photons/s through the sample, collimated to 10⫺2Å⫺1in q range. This allows determination of scattered intensities on the order of 10⫺3cm⫺1, corresponding to the scattering related to isothermal compressibility of less than 0.1 mm of pure water. As a reference sample, the widely used Lupolen™, a semicrystalline polymer, is calibrated. The high-q limit (q⬇4.5 nm⫺1) of a porous calcite sample can be used as a secondary standard for specific area determination of solid/solid or solid–liquid dispersions. © 2003 American Institute of Physics. 关DOI: 10.1063/1.1556954兴
I. INTRODUCTION
According to the classical Huxley–Holmes design,1 a camera used for general experiments in small angle x-ray scattering 共SAXS兲 should work in the so-called pinhole ge-ometry. Using a mirror, a bent monochromator and a point source avoids the delicate problem of desmearing raw data in order to obtain the scattered intensity2 I(q). Pinhole
geom-etry has allowed for instance the identification of the DNA double helix from oriented gels.3
Interaction peaks in colloidal samples made of repulsive particles such as micelles are difficult to measure without a pinhole geometry.4Our aim is to increase the sensitivity of a pinhole camera, in order to be able to analyze a wide range of different samples, including anisotropic and very low con-trast, by improving signal over background ratio and avoid-ing desmearavoid-ing procedures. This requires the ratio between the background count rate at the pixel corresponding to the lowest scattering angle recorded and the number of photons passing through the sample 共defining the so-called limiting factor兲 to be less than 10⫺8. In our setup, these low-angle pixels correspond to Bragg spacing on the order of 60 nm. Our goal is to realize on a laboratory source:
共i兲 typical counting times for weakly scattering samples such as pure water or small ionic micelles on the or-der of 1 h, and a few minutes for inorganic colloids; 共ii兲 the advantage of obtaining directly absolute intensity
without desmearing; and
共iii兲 avoiding the necessity of a secondary standard.
II. DESIGN OF THE CAMERA
A. General layout of the camera
The general layout of the camera is shown in Fig. 1. A rotating copper anode provides a point source 共50 kV, 300 mA兲. This source is used with the classical takeoff angle of 6°. Thus, the apparent size of the source is 1 mm⫻1 mm full width half maximum 共FWHM兲. The horizontal x-ray beam penetrates through a beryllium window in a vacuum cham-ber, through a set of removable calibrated attenuators and two different optical devices, a planar x-ray mirror, and a bent germanium crystal as monochromator. After the sample area, where thermostated rotating sample holders or cham-bers for control of the osmotic pressure may be inserted,5the x-ray beam enters into a second conic vacuum chamber. The input window of this chamber is made of a 50m Littrex™ producing negligible parasitic scattering as compared to Kapton™ and Mylar™ 共see Fig. 2兲. The 300 mm diam cir-cular output window is a carbon–epoxy fiber plate of thick-ness 0.3 mm. The scattering is recorded with a sample to detector distance of 2160 mm. The direct beam hits a semi-transparent beam stop in a position as asymmetric as possible in order to increase the spatial frequency dynamic range (qmax/qmin⫽30). An image plate used as a detector when resolving Bragg peaks is crucial or scattered intensity close to the beam stop is required precisely. Otherwise, two dimen-sional gas position sensitive detectors of the Gabriel type6 are used routinely. Limitations in local dynamic range, am-plification stability, and resolution due to avalanche shape have been reviewed by Petrascu et al.7
a兲Author to whom correspondence should be addressed; electronic mail:
2456
B. Optical elements
1. X-ray mirror
The x-ray mirror is a 1 m long piece of float glass coated by a 50 m chemical vapor deposition nickel layer. This efficient x-ray mirror, which absorbs the radiation harder than Cu K␣ at grazing incidence, is located as close as pos-sible to the x-ray source. For the Cu K␣ radiation, the critical reflection angle is 5.5 mrad. Optimization of the limiting factor and hence the sensitivity requires an average incidence angle of 4 mrad.8The horizontal level of the mirror and its angle with the horizontal 共4 mrad兲 is adjusted with the help of a laser in order to produce a horizontal reflected x-ray beam. For hard x rays of Cu/3, which would pass through the monochromator, the incidence angle on the mirror is nearly three times the critical reflection angle. Two horizon-tal slits avoid direct illumination of the monochromator by the source. Therefore, this particular setting of this camera
avoids beam-hardening through the attenuator, hence allow-ing measurement of sample transmission coefficient for a pure Cu K␣ beam.
2. Bent monochromator
In order to further filter out hard x rays as well as the K radiation produced by the source, the camera is equipped with a bent germanium crystal, cut at ␣⫽2° to the 共111兲 crystallographic plane, and with a radius of curvature of 11.5 m optimized to let the detector plane be the focal plane. This crystal is roughly located in the middle of the camera, at SC⫽2.30 m from the source and at CF⫽2.94 m of the de-tector plane. The focusing condition was first given by Johann9
SC⫽CFsin共B⫺␣兲
sin共B⫹␣兲 ⫽CF•b, 共1兲
where b is the asymmetry factor.
For germanium reflecting copper K␣radiation, the Bragg angle B is 13.21°. The asymmetric ratio induces a slight magnification of the source in the detector plane SC/CF ⫽0.78. Due to the large acceptance angle of asymmetrically cut bent germanium, the whole length of the monochromator is then efficient for focusing10
acc⫽0/
冑
b. 共2兲 In the case of the separated optics camera based on a germa-nium crystal, the acceptance angle is 90rad and the diver-gence angle is 70rad, since0is 80rad for the quality of germanium used.11This natural divergence of an asymmetric Ge crystal sets the minimum q accessible for measurements. To optimize the flux through the sample, the whole source must be seen with angles less than the acceptance angle from any point of the monochromator. Also, the beam-stop size must be contained within the divergence angle, as seen from any point of the monochromator. These conditions impose a total length of more than 4 m for the whole camera as well as a size of the beam stop, larger than the geometrical extension of the image of the source in the plane of the detector.The monochromator is first optically adjusted using the procedure described by Spencer.12A specially designed mir-ror bender共ACTAL, Canberra兲 imposes asymmetric couples on both ends of the thin rectangular Ge plate. Optimal thick-ness was found to be 0.25 mm: finer plates are too difficult to machine and thicker plates break when bent. To improve sensitivity of the camera, lateral ‘‘tails’’ observed near the edge of the beam stop have to be reduced. This strong para-sitic scattering is observed when monochromators are used with the surface state after cut and flattening. The origin of this strong ‘‘tail’’ close to the beam stop is the residual sur-face roughness and defects introduced during cutting. At least 1 order of magnitude of reduction can be obtained by chemical etching, which has the advantage of removing the perturbed layer without introducing strain. Optimization of the etching procedure has to be performed. It has been found13,14that a few minutes of etching in warm acid mix-ture removes 40 m of surface and reduces the observed limiting factor in the horizontal plane by a factor of 10. The
FIG. 1. General layout of the separated optics camera. The horizontal mir-ror under grazing incidence is used to filter out hard x rays and is located as close as possible from the x-ray source, in order to prevent nonspecular reflection from arriving on the focusing monochromator. 2is the scattering angle, is the small angle between detection plane, and the normal to scattered beam.
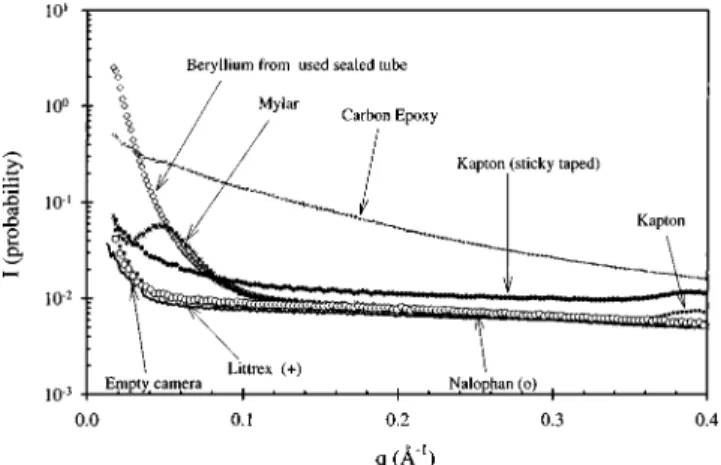
FIG. 2. Scattering cross section of windows, measured in sample position, compared to the scattering obtained with the empty camera: Littrex 共trans-mission T⫽0.98, thickness t⫽50m), carbon–epoxy fiber plate 共transmis-sion T⫽0.75, thickness t⫽350m), Mylar 共transmission T⫽0.91, thick-ness t⫽50m), Kapton windows 共transmission T⫽0.98, thickness t
⫽30m) and Nalophan共transmission T⫽0.98, thickness t⫽50m) com-pared to the scattering of the empty camera; units is scattering probability, i.e., absolute scattering for a length unit sample thickness.
2457
quality of etching also controls the ratio of the beam-size FWHM in the detector plane to the beam-stop size. In the horizontal direction, the surface scattering of the crystal duces off-specular, i.e., nonfocusable reflection, which pro-duces the residual scattering at the edge of the beam stop.11,14
3. Slits
The sensitivity of the separated optics camera is due to two pairs of X – Y slits. The first one is located as close as possible to the exit of the x-ray mirror. The guard slits— sometimes called ‘‘antiscatter’’ slits—are located just in front of the sample area. Since the edges of the slits always pro-duce some parasitic scattering, the limiting factor is inversely proportional to the square of the distance between extreme slits. The design of the camera allows an unusually large separation distance of D⫽100 cm between the first and the guard slits. Therefore, the diffuse scattering produced by the mirror imperfections is not incident on the monochromator. Therefore, the beam emerging from the monochromator is free of hard x rays, as well as Cu K radiation, which is eliminated by the nickel layer, used under grazing incidence. The horizontal metallic edges limiting the beam to an adjust-able width over the mirror共typically 3 mm兲 also avoid scat-tering by the edges of the mirror.
Horizontal and vertical collimation slits15are located be-tween the mirror and the crystal共see Fig. 1兲. The quality of those slits is very important, since the parasitic scattering of those slits are incoming on the guard slits and thus play a major role in the sensitivity of the camera. The guard slits are a crossed pair of crossed slits with steel edges16 located as close as possible of the sample. The main slits are adjusted using an image plate imprint in order to use most of the available area of the monochromator which maintains the required limiting factor.
The guard slits are set in order to minimize the value of parasitic counting at the beam-stop edge relative to the total flux. When all slits are set, we can quantify the final sensi-tivity by defining and routinely measuring the so-called lim-iting factor lf:
lf⫽ Cvh/⌬t
S , 共3兲
where Cvh is the number of photons detected during⌬t on the most intense pixel at the edge of the beam stop over the flux of photons incoming the sample area in the direct beam (•S). The limiting factor is the ratio between the back-ground count rate and the number of photons passing through the sample. After optimization of the slits, the weak-est scattering samples should produce at least as much scat-tering as this background scatscat-tering 共BS兲 produced by the empty camera at the edge of the beam stop in order to ensure safe background subtraction procedures. Limiting factors ob-tained in our setup are: 6.5⫻10⫺9 top of the BS, 6.5 ⫻10⫺9bottom of the BS, 28⫻10⫺9right side of the BS, and 14⫻10⫺9 left side of the BS.
4. Beam stop
We use a thin slab of nickel of thickness 300 m 共at-tenuation factor 204 000兲 cut at a size of 21 mm ⫻42 mm in order to attenuate the direct beam by roughly 53 db. The beam stop is made of nickel foil of thickness t⫽0.30 mm. The expected attenuation is estimated from the mass attenu-ation factor ⫽45.7 cm2/g (Cu K␣) and density ⫽8.9 g/cm3:
A⫽Jout Jin⫽e
⫺ t.
The expected attenuation is A⫽2.105.
The protocol to measure the beam-stop attenuation is the following. We use a second attenuator of predetermined at-tenuation factor of 500 and make exposures of the direct beam using the 5 decades of linearity in the signal/dose ratio of the image plate readout system, typically 1 min without beam stop and 1 night with beam stop. The ratio of inte-grated value of the small spot left by the direct beam gives the beam-stop attenuation factor. The experimental value is
A⫽204 000 with a few percent reproducibility.
Finally, the count rate due to scattering of the sample near the beam stop and the image of the direct beam through the sample are of the same order of magnitude, thus allowing dead-time corrections to be neglected.
C. Position sensitive systems
To record SAXS patterns, we use either a large two-dimensional 共2D兲 position sensitive gas chamber, built by Gabriel6 共EMBL outstation, Grenoble兲 or an image plate reader.17 The gas chamber is a 2D multiwire gas position sensitive detector 512⫻512 pixels, filled with 1.6 bar xenon/ ethane mixture. The largest available gas chamber has an effective diameter of 30 cm, with a carbon sheet as an entry window, and an electronic resolution of 0.9 mm. With a 3 mm pitch and low resolution, the dark count rate per pixel is typically reduced to 3.1⫻10⫺4counts per pixel and per sec-ond. Possible artifacts in measurements introduced by non-ideal counting of gas position sensitive detectors have been discussed in detail previously.18
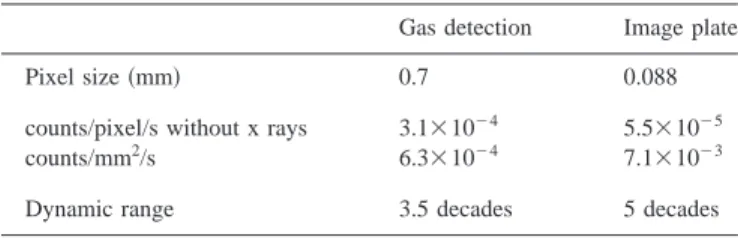
Using the image plates as well as the gas detectors and associated electronics, an adsorbed radiation dose of 1 photon/pixel produces well identified signals in the readout system for both technologies. The ratio of pixel area for the two systems is 65 共see Table I兲 and therefore gives the ratio of resolution as well as the ratio in sensitivity. Cosmic back-ground can be electronically discriminated with the gas de-tector, but not with the image plate, since it is an integrating device. The dynamic range of typical image-plate based sys-TABLE I. Comparison of the detector systems used.
Gas detection Image plate
Pixel size共mm兲 0.7 0.088
counts/pixel/s without x rays 3.1⫻10⫺4 5.5⫻10⫺5 counts/mm2/s 6.3⫻10⫺4 7.1⫻10⫺3
tems, as integrating devices, rely on the linearity of a light intensity to electric charge conversion, which is currently limited to 5 decades if cascades of logarithmic amplifiers are used.17 Detectors based on ionization of gas cannot usually extend the dynamic range above 3 decades due to diffusion without ionization within the gas, as described in detail in Ref. 17.
Scattering cross sections, i.e., absolute intensity multi-plied by the respective thickness of the parasitic scattering introduced by the presence of windows in the setup, are shown in Fig. 2, and compared to the total scattering of the empty camera.
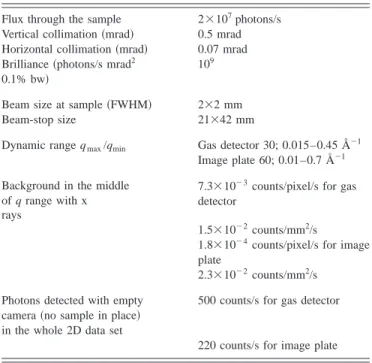
After adjustment, the technical characteristics of the camera are summarized in Table II for 15 kW source electri-cal power. At this power, the total brilliance of the source is on the order of 109photons/s/mm2/0.1% bandwidth. The to-tal entry angle used by the input slits of the camera is 3.5 ⫻10⫺2mrad2. The theoretical flux is therefore almost com-parable to the maximum possible brilliance19(3⫻107). The difference is due to loss in windows.
III. ABSOLUTE SCALING A. Calibration of the Q range
Liquid crystals of the lyotropic type, cubic, hexagonal phases, as well as colloidal crystals exhibit long range order and sharp Bragg peaks. The value of the scattering angle at the maximum of the first order needs to be measured with precision, while the higher orders, usually weaker, are ob-served if the sensitivity of the camera is sufficient. q in re-ciprocal length is given by
q⫽4
sin共兲 with tan共2兲⫽
d
D, 共4兲
where is the incident wavelength andis half of the
scat-tering angle, which can be evaluated for each pixel knowing the distance d to the center of the direct beam in the detector plane, located at distance D to the sample.
The position of the Bragg peaks, after radial averaging, may be routinely checked by the use of a secondary standard. Long chain fatty alcohol may be used to check calibration, as suggested by Nakamura et al.20
Exact value of the spacing can only be determined if the exact location of the detection plane in the gas detector is determined. In order to determine the effective sample to detection plane distance, we use dry octadecanol, showing sharp Bragg peaks indicated in Table III. We use the two types of detectors for specific purposes. The resolution of the solid state detector共image plate with 88m pixel兲 is higher than that of the gas detector but it requires roughly four times more accumulation time as shown in Fig. 3. Thus, when high resolution around the Bragg peak, for instance, is required the image plate will be used 共with a section along the hori-zontal axis as the beam is focused in that direction兲. On the other hand, when good statistics on the absolute scaled in-tensity is required on a radially average spectrum, the gas detector is preferred.
B. Absolute intensity
The scaled scattered intensity produced by the sample is evaluated using the relation
TABLE II. Characteristics of the camera.
Flux through the sample 2⫻107photons/s
Vertical collimation共mrad兲 0.5 mrad Horizontal collimation共mrad兲 0.07 mrad Brilliance共photons/s mrad2
0.1% bw兲
109
Beam size at sample共FWHM兲 2⫻2 mm Beam-stop size 21⫻42 mm
Dynamic range qmax/qmin Gas detector 30; 0.015–0.45 Å⫺1
Image plate 60; 0.01–0.7 Å⫺1 Background in the middle
of q range with x rays
7.3⫻10⫺3counts/pixel/s for gas detector
1.5⫻10⫺2counts/mm2/s
1.8⫻10⫺4counts/pixel/s for image plate
2.3⫻10⫺2counts/mm2/s Photons detected with empty
camera共no sample in place兲 in the whole 2D data set
500 counts/s for gas detector
220 counts/s for image plate
TABLE III. Values of q (Å⫺1) of Bragg peaks in the SAXS domain from dry alcohol crystals in powder average used for detector calibration.
Tetradecanol Octadecanol
0.1583 0.1525
0.3167 0.3050
0.4749 ¯
0.6334 ¯
FIG. 3. 共Insert兲 Readout obtained from an image plate exposed 4 h to the scattering of octadecanol.共Main兲 One-dimensional section 共average on a few lines兲 is shown together with the same section on a gas detector 共1 h of exposure time兲 image and the radially averaged spectrum obtained with the gas detector. Radial averaging damages the final resolution, due to convo-lution by the image of the source. On a vertical cut where resoconvo-lution is best, gas and image plate detection can be compared, balancing sensitivity, which is better with a gas detector vs resolution, which is better with an image plate. The radially averaged gas detector signal is broadened due to the slightly larger dimension of the image of the source in the detector plane.
2459
I共q兲⫽1 V d d⍀ ⫽ 1Ci j 2共0ST兲dt 1 ⌬⍀ 1 e, 共5兲
where the scattered intensity I(q) is defined by the differen-tial scattering cross-section density per unit volume of sample; Ci j is the number of counts detected on pixel i j
during dt; 2 is the detector quantum efficiency for the counts Ci j;1is the detector quantum efficiency when mea-suring the direct beam; (0ST) is the flux共in detector units: counts/s兲 integrated over the whole beam transmitted by the sample; T is the transmission of the sample;⌬⍀ is the solid angle covered by 1 pixel seen from the center of the sample: ⌬⍀⫽p2/D2, where p is the pixel size and D the sample to detector distance; and e is the thickness of the sample 共cm兲. For absolute scaled measurement, one has to ensure that
1⫽2. As already mentioned, we use a semitransparent beam stop of transmission typically 1/204 000 in order to record the direct beam through the sample and the small angle scattering signal of roughly the same intensity. Then, we can use the product (0•S•T•dt)•TBS as a monitor which can be obtained by integrating the direct beam during
dt through the semitransparent beam stop of previously
mea-sured transmission coefficient TBS. This procedure is reliable as long as there is a negligible hard x-ray component in the direct beam.
1. Determination of the transmission of the sample and beam stability monitoring
In order to ensure reliable empty cell subtraction, and thus good reproducibility of calibration using the scattering of pure water, the transmission of the sample has to be mea-sured with good accuracy.
The transmission is measured using an ionization cham-ber located after the sample. The device consists of two con-ducting plates, each with an area of⬃5 cm2, separated by 2 cm. A homogeneous electric field of 100 V/cm is generated between the plates. For a flux on the order of 106photons/s in the beam of size 3⫻2 mm at the position of the ionization chamber, an induced current of typically 200 pA is measured using a conventional picoammeter. The reproducibility and reliability of this simple device is ensured using ultrathin Mylar windows which isolate air inside the ionization cham-ber from the laboratory atmosphere. Moisture is avoided by inserting a small quantity of a dessicating agent into the ion-ization chamber. The transmission of the sample is measured by the ratio of current measured with and without the sample, which is located a few centimeters before the ioniza-tion chamber.
Once the absolute intensities are radially averaged, scat-tering due to a sample can be obtained by direct subtraction of the background I共q兲⫽ 1 ⌬⍀
冋
冉
Ci j 共0S dt兲T冊
⫺冉
Ci j ec 共0S dt兲Tec冊册
1 e, 共6兲where the background, Ci jec, is taken with an empty cell in place 共measurement of liquids兲, or a cell filled with pure solvent 共case of diluted colloids兲.
2. Calibration of absolute scaling of SAXS experiments using water
Pure solvents can be used as secondary standards to cali-brate the whole setup.21 Nevertheless, our setup does not require a secondary standard and we can indeed measure the absolute scattering of water and other solvents. As an ex-ample, we compare below the theoretical value for water to the direct absolute value that can be measured with the setup. The low-q limit of small angle scattering arising from a com-pressible pure solvent is given by22
I共q⫽0兲⫽共fe2ne2兲kTT, 共7兲
where the leading terms in brackets represent the scattering of independent molecules of density w and multiplied by
the isothermal compressibility 共the constant fe⫽0.282
⫻10⫺12cm is the electron ‘‘Thomson scattering length’’兲. Pure water has a density of⫽3.3⫻1022molecules/cm3, the number of electrons per water molecule is 10, and the iso-thermal compressibility is t⫽45.7⫻10⫺11Pa⫺1 共298 K兲. Finally, the scattering produced by pure water used as a ref-erence standard is Iwater(q⫽0)⫽1.62⫻10⫺2cm⫺1.
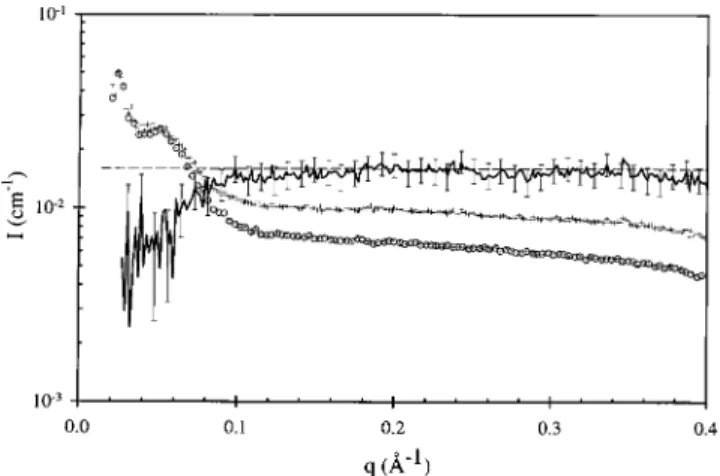
It should be noted that careful control of temperature is important in calibration experiments, since the compressibil-ity of water varies with temperature.23The raw data obtained on our setup with a 1.5 mm thick sample between Mylar windows are shown in Fig. 4. The experimental value that is found is in good agreement with the calculated value. This value was confirmed experimentally by Hendricks.24
Other solvents used as an internal standard in samples or for calibration are
⫺Dodecane t⫽98.7⫻10⫺11 Pa⫺1 and Idodecane共q⫽0兲⫽2.15⫻10⫺2 cm⫺1, 共8兲 ⫺Hexane t⫽16.5⫻10⫺10 Pa⫺1 and Ihexane共q⫽0兲⫽2.87⫻10⫺2 cm⫺1.
FIG. 4. Absolute intensity obtained for a water sample of transmission T
⫽0.19 and for an accumulation time of 4 h 共mylar windows thickness 50 m of transmission 0.98 each兲. 共䊊兲 is the normalized scattering with an empty sample cell共⫹兲 is the scattering with a 1.5 mm sample of water. Dots and error bars are the result of subtraction, as compared to the expected value of the scattering calculated from compressibility共dashed line兲.
3. Measuring strong secondary reference scatterers such as Lupolen™
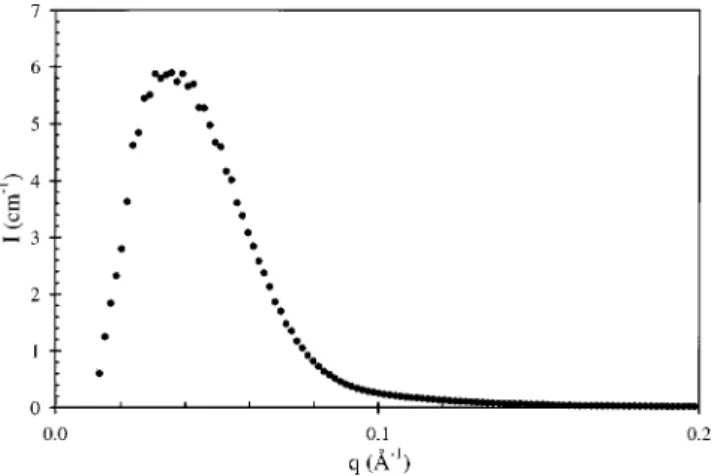
Lupolen is a semicrystalline high molecular weight poly-ethylene produced by BASF. This sample produces a very strong signal, nearly 3 orders of magnitude stronger than pure water. At q⫽0.03 Å⫺1, a scattering maximum is ob-served. This strong signal with a broad peak at a convenient angle can also be easily desmeared when using a slit geom-etry. It is a solid, so no windows are required and it is not subject to aging. For these reasons, the scattering of Lupolen is widely used as a secondary reference standard. Wignall25 has determined the differential cross section per unit length for this sample with different geometries. This sample, used in a large number of laboratories as a reference, has a scat-tered intensity peak of 6⫾0.1 cm⫺1 at q⫽0.03 Å⫺1. The result obtained in the separated optics camera is shown in Fig. 5. Strong signals such as those produced by solid poly-mers are easily measured within 15 min with good statistics.
4. Using the high sensitivity of the separated optics camera for strongly decreasing signals
Porous or biphasic heterogeneous samples produce a characteristic signal decaying sharply with q. Conditions to obtain a pure ‘‘Porod decay’’26when the intensity at large q asymptotic limit decays as q⫺4, taken between limits qinf and qsup, are as follows:27
共i兲 The interface is ‘‘sharp’’, i.e., the transition from me-dia 1 to meme-dia 2 occurs in a distance much smaller than 2/qMax, so that fluctuation of the electronic density inside both media can be neglected. Average ‘‘particle’’ diameter or grain size, interparticle dis-tance, and inverse of average curvature of interface are all at least 5–10 times larger than 1/qmin. 共ii兲 Structural polydispersity is large enough to dampen
the oscillations in scattering form factor. Under these conditions, the Porod decay is given by
lim共I共q兲q4兲q→⬁⫽2⌺共⌬n兲2, 共9兲
where (⌬n)2 is the square of the scattering length density difference 共cm⫺2兲, and the specific area per unit volume ⌺
共cm2/cm3兲 contains ‘‘open’’ as well as inaccessible pores. For granulometry of submicron size, the high-q Porod regime corresponds to the small angle part of the SAXS intensity, thus allowing a nondestructive determination of surface-to-volume ratio in emulsions.28 The advantage of direct struc-tural determination by SAXS over the more widespread BET method is that inaccessible closed volumes contribute to the Porod decay behavior. As an example, the specific surface of a widely used industrial calcite powder 共Socal 30, produced by the Solvay Company兲 extracted from the Porod limit is shown in Fig. 6. The experimental value, 17 m2/g is in very good agreement with the Brunauer–Emmett–Teller determi-nation made by P. Delord共Montpellier University兲.
ACKNOWLEDGMENTS
The authors acknowledge Jacques Lambard for the me-chanical design of the camera and Didier Gazeau, who was responsible for the camera while in our laboratory, for valu-able discussions, and the development of calibration proce-dures.
1For a review of classical SAXS designs, see H. E. Huxley and W. Brown,
J. Mol. Biol. 30, 383共1967兲.
2
O. Yoda, J. Appl. Crystallogr. 17, 337共1984兲.
3For a discussion of this point, see G. S. Stent in a critical edition of The
Double Helix, edited by J. D. Watson共W. W. Norton, Norton, New York, 1980兲.
4
K. Mu¨ller, in Small Angle X-ray Scattering, edited by O. Glatter and O. Kratky共Academic, London, 1982兲.
5M. Dubois and Th. Zemb, J. Phys. IV 8, 55共1998兲. 6A. Gabriel, Rev. Sci. Instrum. 48, 1303共1977兲.
7A. M. Petrascu, M. H. J. Koch, and A. Gabriel, J. Macromol. Sci., Phys.
37, 463共1998兲.
8E. Erola, V. Etelaniemi, P. Suortti, Ph. Pattison, and W. Thomson, J. Appl.
Crystallogr. 23, 35共1990兲.
9A. Guinier and G. Fournet, Small Angle Scattering of X-Rays共Wiley, New
York, 1995兲, Chap. 3.
10
T. Matsushita and U. Kaminaga, in Handbook on Synchrotron Radiation, edited by E. Koch共Elsevier, Amsterdam, 1983兲, Vol. 1, p. 261.
FIG. 5. Scaled SAXS intensity obtained for the Lupolen™ sample of thick-ness t⫽3 mm and transmission T⫽0.37 共exposure time 15 mn兲.
FIG. 6. Scattering of samples producing steeply decreasing power-law be-havior.共Inset兲 Result shown in log–log scale for the dry solid. 共Main兲 Porod representation I(q)•q4function of q4produced by calcite powder used for
calibration. This representation allows determination of Porod constant in-dependently from value of flat parasitic background. Taking ⌬n
⫽0.815 e/Å3as the contrast between air and calcite, the specific area
deter-mined from Porod plot as well as BET is 17 m2/g as compared to the 20 m2/g nominal value共transmission 0.28, average powder thickness 65m兲 of
the calibration sample supplied and cross-checked by P. Delord共Montpellier University兲.
2461
11J. Lambard, P. Lesieur, and Th. Zemb, J. Phys. I 2, 1191共1992兲. 12M. J. Spencer, J. Appl. Crystallogr. 11, 715共1978兲.
13H. Shiwaku and H. Hyodo, Jpn. J. Appl. Phys., Part 2 30, L2065共1991兲. 14
M. Amagalian, D. K. Christen, A. R. Drews, C. J. Clinkak, H. Matsuoka, and G. G. Wignall, J. Appl. Crystallogr. 31, 235共1998兲.
15Sietronics, Canberra, Producing slits with Tantalum edges, Australia. 16Slits with crossed stainless steel edges, Huber, Germany, ref. 3013/1. 17F. Ne´, D. Gazeau, J. Lambard, P. Lesieur, Th. Zemb, and A. Gabriel, J.
Appl. Crystallogr. 26, 763共1993兲.
18F. Ne´, A. Gabriel, M. Koksis, and Th. Zemb, J. Appl. Crystallogr. 30, 306 共1997兲.
19V. Honkima¨ki, J. Sleight, and P. Suortti, J. Appl. Crystallogr. 23, 412 共1990兲.
20
Y. Nakamura, G. Gebel, and P. Aldebert, J. Appl. Crystallogr. 22, 75 共1989兲.
21D. Orthaber, A. Bergmann, and O. Glatter, J. Appl. Crystallogr. 33, 218 共2000兲.
22A. Guinier and G. Fournet, Small Angle X-rays Scattering共Wiley, New
York, 1955兲, p. 47.
23
L. Bosio, J. Teixeira, and H. E. Stanley, Phys. Rev. Lett. 46, 9共1981兲.
24R. W. Hendricks, P. G. Mardon, and L. B. Shaffer, J. Chem. Phys. 61, 319 共1974兲.
25G. D. Wignall, J. Appl. Crystallogr. 24, 479共1991兲. 26
G. Porod, Z. Koll. 124, 83共1951兲.
27Th. Zemb, in Neutron, X-Ray and Light Scattering: An Introduction to an
Investigative Tool for Colloidal and Polymer Systems, edited by P. Lindner and Th. Zemb共North-Holland Delta Series, Amsterdam, 1991兲, pp. 177– 199.
28
P. Lesieur, P. Lindner, C. Desforges, J. Lambard, and Th. Zemb, Physica B