HAL Id: hal-03008798
https://hal.inria.fr/hal-03008798
Submitted on 16 Nov 2020
HAL is a multi-disciplinary open access
archive for the deposit and dissemination of
sci-entific research documents, whether they are
pub-lished or not. The documents may come from
teaching and research institutions in France or
abroad, or from public or private research centers.
L’archive ouverte pluridisciplinaire HAL, est
destinée au dépôt et à la diffusion de documents
scientifiques de niveau recherche, publiés ou non,
émanant des établissements d’enseignement et de
recherche français ou étrangers, des laboratoires
publics ou privés.
Diffusion MRI-based Connectivity Enriched with
Microstructure Information Predicts the Propagation of
Cortico-Cortical Evoked Potentials
Patryk Filipiak, Fabien Almairac, Théodore Papadopoulo, Denys Fontaine,
Lydiane Mondot, Stéphane Chanalet, Rachid Deriche, Maureen Clerc, Demian
Wassermann
To cite this version:
Patryk Filipiak, Fabien Almairac, Théodore Papadopoulo, Denys Fontaine, Lydiane Mondot, et al..
Diffusion MRI-based Connectivity Enriched with Microstructure Information Predicts the Propagation
of Cortico-Cortical Evoked Potentials. ISMRM 2020 - 28th Annual Meeting & Exhibition of the
International Society for Magnetic Resonance in Medicine, Aug 2020, Sydney / Virtual, Australia.
�hal-03008798�
Diffusion MRI-based Connectivity
Enriched with Microstructure Information
Predicts the Propagation of Cortico-Cortical
Evoked Potentials
Patryk Filipiak1, Fabien Almairac2, Th´eodore Papadopoulo1, Denys Fontaine2,
Lydiane Mondot3, St´ephane Chanalet3, Rachid Deriche1, Maureen Clerc1, and
Demian Wassermann1,4
1 INRIA, Universit´e Cˆote d’Azur, France
2
Service de Neurochirurgie, CHU de Nice, Universit´e Cˆote d’Azur, France,
3
Service de Radiologie, CHU de Nice, Universit´e Cˆote d’Azur, France
4
INRIA, CEA, Universit´e Paris-Saclay, Paris, France
Abstract. Propagation of Cortico-Cortical Evoked Potentials (CCEPs) varies depending on numerous structural features of brain tissue. In this work, we show that dMRI-based connectivity enriched with microstruc-ture data has the potential to measure cortico-cortical communication as it predicts CCEP-based effective connectivity. Our multiple linear regression model incorporates q-space indices like Q-space Inverse Vari-ance, Non-Gaussianity and Return to Plane Probability with minimum streamline lengths obtained from tractography to predict delays and am-plitudes of the N1 peaks in CCEPs. In our experiment, we use presurgical dMRI and intrasurgical ECoG recordings of 9 patients operated on brain tumor in the awake condition.
1
Introduction
Propagation of Cortico-Cortical Evoked Potentials (CCEPs) varies depending on numerous structural features of the brain tissue [1, 2]. In this work, we show that dMRI-based connectivity enriched with microstructure data has the potential to measure cortico-cortical communication as it predicts CCEP-based effective connectivity. For this, we studied a group of 9 patients undergoing brain tumor resection in the wide awake condition.
2
Methods
For each of the 9 patients (5 female, aged 40 ± 13), we acquired presurgical mul-tishell dMRI (b ∈ {400, 800, 1550, 3100} [s/mm2] with {6, 13, 29, 51} directions,
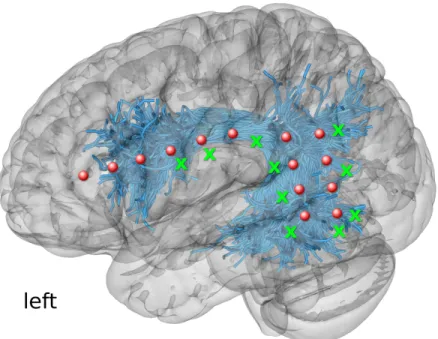
respectively) and intrasurgical ECoG recordings in the exposed perisylvian lan-guage area, as illustrated in Figure 1. Direct Electrical Stimulation (DES) of the
cortex induced a series of repetitive CCEPs, which we quantified with delays and amplitudes of N1 peaks [1, 3]. Then, we trained linear regression models to predict the above effective connectivity measures using variables describing structural links between DES sites and ECoG recording electrodes, i.e. (i) log-transformed streamline counts, (ii) minimum and (iii) median streamline lengths, (iv) distances measured along the surface of white matter (WM).
Taking into account that propagation of evoked potentials is related to tissue microstructure [4], we extended our set of variables obtained from dMRI with common tensor-based and q-space indices: Fractional Anisotropy (FA); Mean (MD), Axial (AD), and Radial Diffusivities (RD); Return to Origin (RTOP), Axis (RTAP), and Plane Probabilities (RTPP); Mean Squared Displacement (MSD), Q-space Inverse Variance (QIV), Non-Gaussianity (NG), and parallel (NGk) and perpendicular Non-Gaussianity (NG⊥). Our approach was strictly
data-driven. We applied stepwise regression on the full set of indices for a feature selection. Also, we arranged the streamlines in the ascending order with respect to their lengths and tested various subsets of streamlines restricted with
low-Fig. 1: ECoG electrodes for recording CCEPs in Patient 1. The scheme illus-trates the presurgical planning of the locations of electrodes (red circles) and stimulation sites (green crosses) using the tractography-based dissections of Ar-cuate Fasciculus and Superior Longitudinal Fasciculus III (both pictured jointly as blue streamlines).
pass and high-pass filters with cut-off values defined by percentiles of lengths plower, pupper∈ {0, 10, 20, ..., 100}.
3
Results
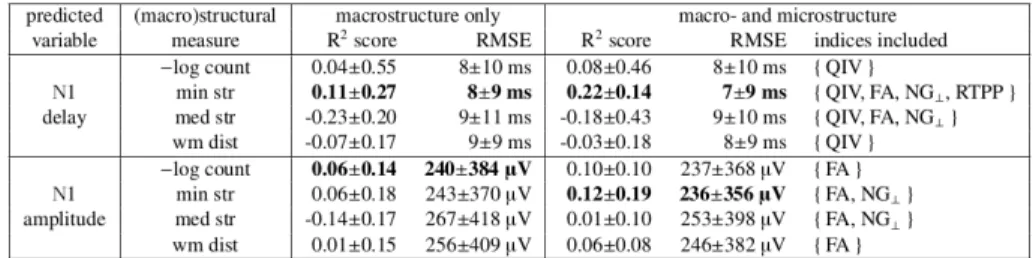
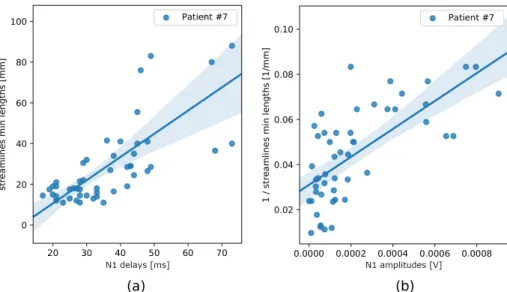
The linear regression models which used macrostructure information only (abbr. macrostructure only ) produced comparable mean residuals for each of the four in-put measures, nonetheless a dispersion of residuals was relatively high (Table 1). Variances of the effective connectivity data were best explained by minimum streamline lengths (Figure 2), for which R2 scores were the highest (Table 1).
The stepwise regression method gave consistent results regarding microstruc-ture feamicrostruc-tures selection (Table 1): QIV was chosen in all the four models aimed at predicting N1 delays, while FA, NG⊥, and RTPP appeared in the models
based on the streamline lengths. Analogously, for predicting N1 amplitudes, the stepwise regression method selected FA and NG⊥.
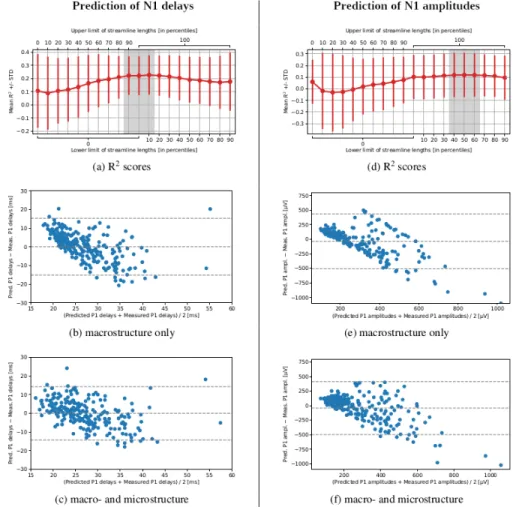
The models based on a combination of macro- and microstructure data reached higher prediction accuracy than the ones using macrostructure only. However, their performance varied depending on the length of streamlines along which the microstructure indices were computed (Figure 3). While predicting the N1 delays with minimum streamline lengths and {QIV, FA, NG⊥, RTPP},
the R2 scores were highest and least dispersed when all the streamlines were
included. Meanwhile, for predicting the N1 amplitudes, it was better to re-move a shorter half of the streamlines from the data set. Also note that the macrostructure only models visibly overestimated the low values of N1 delays and N1 amplitudes, yet understimated the high ones (Figure 3). An inclusion of the microstructure indices helped reduce this bias.
Table 1: Macro- and microstructure information allowed to predict the N1 delays and N1 amplitudes using the linear regression models. The combined model outperformed the macrostructure only variant in N1 delays (t-statistic: -1.72) and N1 amplitudes (t-statistic: -1.19). The included microstructure indices are provided in the last column. Abbreviations: QIV – Q-space Inverse Variance, FA – Fractional Anisotropy, NG⊥ – perpendicular Non-Gaussianity, and RTPP –
Fig. 2: Scatter plots showing the positive correlation between: (a) N1 delays and minimum streamline lengths, (b) N1 amplitudes and the inverse of minimum streamline lengths (both in Patient 7).
4
Discussion
We hypothesized that the propagation of N1 peaks in CCEPs depends on the macro- and microstructural properties of the WM fibers connecting the pyrami-dal cells excited with DES and the distal recording areas. The observed increases of the R2 scores and decreases of the mean squared residuals after including the microstructure-related indices in our linear regression models imply tangibly that these variables contained information about the propagation of CCEPs and thus can serve as a measure of cortico-cortical comunication.
The presence of FA among the features selected with the stepwise regression method is by far the most intuitive. This tensor-based index relates, although
Fig. 3: The accuracy of prediction of N1 delays and N1 amplitudes varied depend-ing on the lengths of streamlines used for computdepend-ing microstructure information. The mean R2scores with standard deviations for various lower and upper cut-off percentiles are shown for (a) N1 delays and (d) N1 amplitudes. The four remain-ing figures are Bland-Altman plots illustratremain-ing the prediction accuracy obtained with the leave-one-patient-out cross-validation for the macrostructure only cases (b and e) or macro- and microstructure cases with best cut-off values.
non-specifically, to numerous properties of WM microstructure, including fiber density, neurites dispersion, axonal diameter, and myelination level [5]. Also note that QIV appeared systematically in all the studied regression models for the N1 delays. As pointed out by Fick et al. [6], this index reflects changes in tissue composition and is probably more sensible in doing so than FA. Another notable example is RTPP which is typically attributed to the length of a pore [7]. Addi-tionally, it doesn’t require an angular integral and doesn’t suffer from the power law phenomena [8]. However, RTPP feature was selected only once, so its rel-evance in predicting the effective connectivity measures might be questionable. Finally, the role of NG⊥ is most difficult to interpret. This index quantifies the
non-Gaussian, hence restricted, portion of the diffusion signal measured perpen-dicularly to the principal fiber direction. However, one must keep in mind that NG⊥ is computed under the assumption of an axial symmetry of a tissue, which
is often not satisfied.
5
Conclusion
In this study, we showed that brain tissue microstructure features help explain the propagation of CCEPs. Particularly, the N1 delays and amplitudes measured
instrasurgically in brain tumor patients were linearly related to FA and q-space indices quantifying axon dispersion and WM tissue composition. We believe that our findings extend the clinical significance of microstructure indices and contribute to the goal of understanding the propagation of CCEPs.
Acknowledgements
This work has received funding from the ANR/NSF award NeuroRef; the MAX-IMS grant funded by ICM’s The Big Brain Theory Program and ANR-10-IAIHU-06.
References
1. Keller, C.J., Honey, C.J., M´egevand, P., Entz, L., Ulbert, I., Mehta, A.D.: Map-ping human brain networks with cortico-cortical evoked potentials. Philosophical Transactions of the Royal Society B: Biological Sciences 369(1653) (2014) 20130528 2. Yamao, Y., Matsumoto, R., Kunieda, T., Arakawa, Y., Kobayashi, K., Usami, K., Shibata, S., Kikuchi, T., Sawamoto, N., Mikuni, N., et al.: Intraoperative dorsal language network mapping by using single-pulse electrical stimulation. Human brain mapping 35(9) (2014) 4345–4361
3. Vincent, M., Guiraud, D., Duffau, H., Mandonnet, E., Bonnetblanc, F.: Electrophys-iological brain mapping: Basics of recording evoked potentials induced by electrical stimulation and its physiological spreading in the human brain. (2017)
4. Goldman, L., Albus, J.S.: Computation of impulse conduction in myelinated fibers; theoretical basis of the velocity-diameter relation. Biophysical journal 8(5) (1968) 596–607
5. Basser, P.J., Pierpaoli, C.: Microstructural and physiological features of tissues elucidated by quantitative-diffusion-tensor MRI. Journal of magnetic resonance 213(2) (2011) 560–570
6. Fick, R.H.J., Pizzolato, M., Wassermann, D., Zucchelli, M., Menegaz, G., Deriche, R.: A sensitivity analysis of q-space indices with respect to changes in axonal diameter, dispersion and tissue composition. In: 2016 IEEE 13th International Symposium on Biomedical Imaging (ISBI), IEEE (2016) 1241–1244
7. ¨Ozarslan, E., Koay, C.G., Shepherd, T.M., Komlosh, M.E., ˙Irfano˘glu, M.O., Pier-paoli, C., Basser, P.J.: Mean apparent propagator (MAP) MRI: A novel diffusion imaging method for mapping tissue microstructure. NeuroImage 78 (2013) 16–32 8. Veraart, J., Fieremans, E., Novikov, D.S.: Universal power-law scaling of water
diffu-sion in human brain defines what we see with MRI. arXiv preprint arXiv:1609.09145 (2016)