HAL Id: hal-01726581
https://hal.archives-ouvertes.fr/hal-01726581
Submitted on 8 Mar 2018
HAL is a multi-disciplinary open access archive for the deposit and dissemination of sci-entific research documents, whether they are pub-lished or not. The documents may come from teaching and research institutions in France or abroad, or from public or private research centers.
L’archive ouverte pluridisciplinaire HAL, est destinée au dépôt et à la diffusion de documents scientifiques de niveau recherche, publiés ou non, émanant des établissements d’enseignement et de recherche français ou étrangers, des laboratoires publics ou privés.
Angela Greulich, Aurélien Dasre
To cite this version:
Angela Greulich, Aurélien Dasre. The quality of periodic fertility measures in EU-SILC. Demographic Research, Max Planck Institute for Demographic Research, 2017, 36, pp.525-556. �10.4054/Dem-Res.2017.36.17�. �hal-01726581�
VOLUME 36, ARTICLE 17, PAGES 525
-556
PUBLISHED 9 FEBRUARY 2017
http://www.demographic-research.org/Volumes/Vol36/17/ DOI: 10.4054/DemRes.2017.36.17
Research Article
The quality of periodic fertility measures in
EU-SILC
Angela Greulich
Aurélien Dasré
© 2017 Angela Greulich & Aurélien Dasré.
This open-access work is published under the terms of the Creative Commons Attribution NonCommercial License 2.0 Germany, which permits use, reproduction & distribution in any medium for non-commercial purposes, provided the original author(s) and source are given credit.
1 Introduction 526
2 Description of the database 527
3 Quantification of the measurement bias in total fertility rates 529
4 Attrition 532
5 Applying a retrospective approach 540
6 Differentiation by rotational groups 547
7 Conclusion 458
8 Acknowledgements 550
References 551
The quality of periodic fertility measures in EU-SILC
Angela Greulich1
Aurélien Dasré2
Abstract
BACKGROUND
The European Union Statistics on Income and Living Conditions (EU-SILC) are increasingly used in demographic analysis, due to their large country coverage, the availability of harmonized socioeconomic measures, and the possibility to merge partners. However, so far there exists no comprehensive analysis of the representativeness of the fertility behavior reported by EU-SILC.
OBJECTIVE
This paper quantifies the quality of periodic fertility measures in EU-SILC.
METHODS
We compare periodic fertility measures obtained with EU-SILC to unbiased measures from the Human Fertility Database (HFD) for several European countries, by applying a cross-sectional perspective.
RESULTS
We show that EU-SILC measures of periodic fertility are biased downward, mainly due to attrition, while births of order one for ages 20‒29 are particularly underreported. However, we find no evidence of socioeconomic differentials in attrition.
CONCLUSION AND CONTRIBUTION
Our results suggest that for the majority of European countries, EU-SILC can be used for the analysis of childbearing behavior when respecting the measures of precaution mentioned in this article. These contain, for example, applying a retrospective approach and differentiating by rotation groups when calculating aggregate measures of periodic fertility.
1 Centre d’Economie de la Sorbonne and Institut national d'études démographiques (Ined), France.
E-Mail:angela.greulich@univ-paris1.fr.
2 Centre de Recherches Sociologiques et Politiques de Paris (CRESPPA), Genre, Travail, Mobilités (GTM),
1. Introduction
The European Union Statistics on Income and Living Conditions (EU-SILC) are becoming increasingly popular in socioeconomic and demographic analysis.3 The main advantage of EU-SILC is its large country coverage, with a provision of harmonized socioeconomic measures for both individuals and households.
EU-SILC is mainly used for economic analysis, with the demographic information (such as the number of children present in the household) used as controls. However, EU-SILC is also increasingly used for demographic analysis, particularly in fertility research, as the large international sample allows both marginal effects to be modeled and institutional determinants to be taken into account.
EU-SILC provides not only cross-sectional data but also a follow-up of individuals and households, albeit for only a relatively short period (see the schematic for more detailed information about the database). Therefore, EU-SILC is used not only for measuring household size but also for modeling determinants (and/or consequences) of childbearing behavior. The follow-up helps limit the risk of endogeneity, as individual and household characteristics can be observed during a certain period before the potential conception of a child when the purpose is to investigate determinants of childbirth.
EU-SILC-based studies on socioeconomic determinants of timing and intensity of childbirth, differentiated by birth order, have been conducted, for example, by d’Albis, Gobbi, and Greulich (forthcoming), d’Albis, Greulich, and Ponthière (2015), Greulich and Rendall (2016), Greulich, Thévenon, and Guergoat-Larivière (2016), Nitsche et al. (2015), Matysiak, Sobotka, and Vignoli (2016), Klesment et al. (2014), Rendall et al. (2014) and De Santis, Drefahl, and Vignoli (2014).
However, EU-SILC has not been designed to directly measure fertility indicators. Those indicators have to be compiled indirectly by using the ‘own children method.’4 Moreover, the sampling and the weighting procedures are not directly designed to ensure non-biased fertility measures. Thus, measures of periodic fertility are likely to be biased due to sample selection (underrepresentation of childless individuals who are ‘at risk of having’, i.e., likely to have, a child) and attrition. It is possible that attrition is directly linked to fertility, as childbirth (be it planned, expected, or just completed) might cause the individual or household to move, which implies a risk of losing
3 http://ec.europa.eu/eurostat/web/microdata/european-union-statistics-on-income-and-living-conditions 4
This method consists of calculating fertility rates by age for a certain year by considering children who are living in the observed household at the time of the survey and who are born in the particular year of interest (Grabill and Cho 1965; Desplanques 1993).
respondents. This phenomenon potentially creates a systematic underestimation of periodic fertility measures (in the following called ‘measurement bias’).
This measurement bias causes problems if the individuals for whom childbirths are underreported have particular socioeconomic characteristics. In that case, not only descriptive but also econometric analyses will suffer from distortion.
While systematic work has been done to evaluate the quality of fertility measures in other important data sets such as the Gender and Generations Survey (Vergauwen et al. 2015),5 few studies have addressed the issue of measurement bias of fertility in EU-SILC. The quantifications of the bias are not systematic and the available studies only focus on one country (De Santis, Drefahl, and Vignoli 2014, for example, for Italy). Other studies, for example, Iacovou, Kaminska, and Levy (2012), discuss the quality of EU-SILC data in general but do not provide a detailed analysis of the quality of fertility measures. They find, however, that the percentage of individuals followed on leaving their family home (young adults, separating couples) in EU-SILC is very low, which suggests that for at least some groups of individuals, fertility behavior is underreported.
This article systematically evaluates the quality of periodic fertility measures in the European Union Statistics on Income and Living Conditions (EU-SILC) for a large set of countries. We proceed in the following way. We first compare each country’s aggregate measure of periodic fertility (total fertility rates) obtained with EU-SILC to unbiased measures of total fertility rates and discuss potential reasons for the identified biases (section 2). We then focus on the problem of attrition in order to evaluate the risk that the measurement bias in periodic fertility is linked to socioeconomic characteristics (section 3). In section 4 we propose a retrospective approach which allows circumventing the measurement bias for most countries. For those countries with a remaining bias, we quantify the bias by age and birth order. In section 5 we evaluate how far the measurement bias in periodic fertility can be circumvented by differentiating between rotational groups. Section 6 concludes.
2. Description of the database
The European Union Statistics on Income and Living Conditions (EU-SILC) is a European survey provided by Eurostat. This survey was created in 2003 to replace the European Community Household Panel (ECHP) and now includes 31 European countries. Since then, Eurostat has released a new wave every year. The survey gathers harmonized and comparable data at the individual and the household level on income
5 Vergauwen et al. (2015) compare indicators of first marriage and fertility estimated retrospectively from
and living conditions, as well as on adults’ demographic and socioeconomic characteristics (sex, age, education, labor market position, parenthood etc.).
EU-SILC is composed of two datasets, one cross-sectional and one longitudinal. The annual cross-sectional data is produced from the longitudinal panel (integrated design). The longitudinal dataset of EU-SILC is a rotational panel of four years, which means that for the majority of countries, individuals are observed for a maximum period of four years. The integrated design allows for a large number of observations for the cross-sectional database. In the cross-sectional database a quarter of individuals are observed for the first time, a quarter for the second time, a quarter for the third time, and a quarter for the fourth time (as shown by ‘Time = T’ in the schematic below). This integrated design reduces measurement bias due to cumulated respondent burden and sample attrition.
Source: Eurostat Guidelines for EU-SILC, 2012
Some countries provide a follow-up of longer than four years (nine years in France, five or more years in some Eastern European countries). By contrast, there is no longitudinal database for Germany. The majority of countries joined the survey in 2004 and 2005, while several Eastern European and Mediterranean countries joined in later (Malta, Croatia, Romania, etc.).
The survey contains information on both individuals and households. It is possible to identify adult women, their partner if they have one, and any children who live in the same household. EU-SILC does not report information on the number of children directly. However, children are observed with a proper identification number when living in their parents’ households. For individuals aged 15+, EU-SILC provides both a register file and a personal file. The register file contains basic demographic information (age, sex, residential status, etc.). The personal file contains information about education, labor market participation, and income. For children aged 0 to 14, EU-SILC provides only a register file. Besides an individual registration number, the register files contain IDs for the household, father, mother, and spouse/partner, which
enables users to merge household members. However, no distinction is made between biological parents, adoptive parents, foster parents, and step-parents.
Households are generally followed when moving as a whole. However, individuals who leave their original household are hard to follow, and this leads to problems of attrition.
EU-SILC provides detailed measures of individuals’ labor market status (reported on a monthly basis and distinguishing between full-time and part-time employment, employment and self-employment, type of contract, hierarchy and sector, etc.). This information is rarely available in other, more ‘demographic’ surveys. One exception is the Gender and Generations Surveys, but this survey has more limited country and time coverage (just three waves, and only the first wave is nationally representative). Also, in the GGS, information on socioeconomic characteristics of the partner is not available, and employment measures are less detailed than in the EU-SILC. Other surveys, such as the European Labor Force survey, contain information on labor supply but not on income. Some surveys exist that contain both demographic and economic variables, with individuals being tracked for more than only four years. But the limitation of these datasets is their national focus, since these long-run surveys generally cover only one given country (the German Socioeconomic Panel or the American Panel Study of Income Dynamics, for example).
3. Quantification of the measurement bias in total fertility rates
To get a first idea of the extent to which measures of periodic fertility are biased in EU-SILC, we use EU-SILC to construct total fertility rates (TFR) for each country. The cross-sectional samples of EU-SILC can theoretically be used to calculate aggregates, as the country samples are designed to be nationally representative probability samples of the population residing in private households within the country, irrespective of language or nationality. For each country, a minimum effective sample size is respected, and the personal cross-sectional weights of observed individuals (children included) sum to the real population size of each country.
To quantify the measurement bias, we compare the weighted fertility measures obtained from EU-SILC with the unbiased measure from the World Bank World Development Indicators (WB WDI) for 27 European countries. We use the WB WDI rather than the Human Fertility Database (HFD) in this section in order to obtain the largest possible country coverage. The HFD is then used in our later analysis, as it provides information on age-specific fertility by birth order, but only for a subgroup of European countries.
The WDI measures seem relatively unbiased, as they are limited to populations where the registration of births by official statistical agencies is virtually complete and where population estimates over the range of reproductive ages are reliable.
To measure total fertility rates with EU-SILC, we observe children born in 2010 in the cross-sectional database of 2011, for women aged 15+. To obtain the TFR, we calculate the sum of age-specific fertility rates for each country. We compare this measure to the total fertility rates for 2010, given in the World Bank’s World Development Indicators.
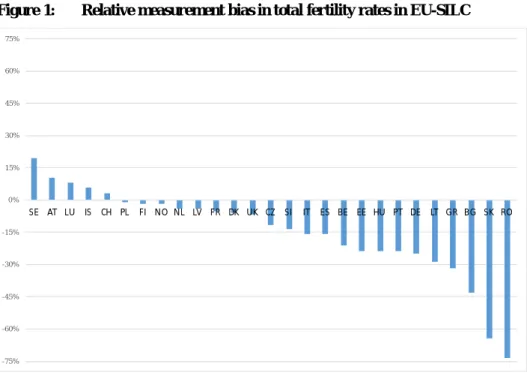
Figure 1: Relative measurement bias in total fertility rates in EU-SILC
Sources: TFR: EU-SILC CS 2011 - children born in 2010, against WB WDI 2010
Figure 1 illustrates the relative measurement bias in total fertility rates for each country. EU-SILC underestimates total fertility rates in most European countries except Switzerland, Iceland, Luxembourg, Austria, and Sweden. The downward bias is highest in Romania, Slovakia, Bulgaria, Greece, Lithuania, and Germany. The arithmetic mean of the relative difference between the EU-SILC-derived TFR and the unbiased TFR is 15%. -75% -60% -45% -30% -15% 0% 15% 30% 45% 60% 75% SE AT LU IS CH PL FI NO NL LV FR DK UK CZ SI IT ES BE EE HU PT DE LT GR BG SK RO
The biases are quite heterogeneous between countries and fertility measures. Countries with high fertility rates are not automatically those with the highest biases in EU-SILC. The country classification in high- and low-fertility countries remains the same for the large majority of countries when using the EU-SILC measures or the unbiased fertility measures. Exceptions occur only for those countries with fertility measures around the European mean. EU-SILC identifies the same highest-high and lowest-low-fertility countries as in the HFD and the WB WDI. Figure A-1 in the Appendix compares EU-SILC-derived TFRs with the unbiased TFR measures and, besides an underestimation, also illustrates a high consistency between the series. There are larger discrepancies in total fertility rates for only a few countries. Without Slovakia and Romania, the correlation coefficient (R2) between the two series is 0.72.
It should be noted that our method for calculating total fertility rates, also called the ‘own children method’ (as defined in section 1), is known to underestimate total fertility rates because between the date of birth and the time of the survey some children may die and some children may no longer live with their mother. Omissions of newborn children by respondents can also lead to understating this measure. However, the underestimation caused by these factors is known to be very low in European countries (5% of children in France, for example: see Desplanques 1993). Given the relatively large extent of the downward bias in total fertility rates in EU-SILC, it is likely that the bias is caused by other factors.
There are three possible main explanations of the downward bias in TFR in EU-SILC.
· First, it is possible that in the questionnaire some parents do not declare having a new child shortly after childbirth, but provide information about their children with a certain time delay.
· Second, it is possible that parents who have just had a child, who are about to have children, or who are at least likely to have children, are underrepresented in the sample (sampling selection bias). This is potentially linked to attrition. · Third, attrition is potentially linked to childbirth. Parents who are planning to
have a child, who are about to have a child, or who have just had a child might move due to this event, which would increase the risk of dropping out of the survey (sampling attrition bias). Attrition affects not only the longitudinal database but also the cross-sectional EU-SILC samples, due to its integrated design (see the schematic in the introduction for more information about the integrated design in EU-SILC).
In theory, as both the cross-sectional and the longitudinal data are based on nationally representative probability samples (see, for example, Eurostat, 2013, p. 20),
the weighting procedure in EU-SILC should compensate for these losses. For each country Eurostat defines the minimum number of individuals and households required for sample sizes, and the database provides a series of weights (household design and cross-sectional weights, individual base weights, individual cross-sectional and longitudinal weights). According to the Commission Regulation on sampling and tracing rules (EC No 1982/2003, §7.4), “weighting factors shall be calculated as required to take into account the units’ probability of selection, non-response and, as appropriate, to adjust the sample to external data relating to the distribution of households and persons in the target population, such as by sex, age (five-year age groups), household size and composition and region (NUTS II level), or relating to income data from other national sources where the Member States concerned consider such external data to be sufficiently reliable” (Eurostat, 2013, p. 30). Hence, for each country, weights are supposed to be adjusted to external sources (like censuses, population registers, labor force surveys etc.). In theory, by using weights, researchers should be able to reproduce the population structure of each country; in terms of composition by age and sex, for example, but also in terms of socioeconomic characteristics. However, the documentation provided by Eurostat about how weights are constructed is unclear (see also Iacovou, Kaminska, and Levy 2012), and Eurostat gives no precise information about the effectiveness of the weighting procedure conducted in each country. Consequently, the degree to which the weighted data is really representative of each country is unknown, both in terms of particular demographic characteristics such as fertility and in terms of particular socioeconomic characteristics. The fact that we identify a downward bias in total fertility rates suggests that the weighting process is inefficient in compensating for the underrepresentation of childbirths/ newborn children in EU-SILC.
4. Attrition
Among the three potential causes mentioned above, attrition merits particular attention due to its causal link with fertility.
In general, efforts are made by the interviewers to follow up households for the foreseen time period, even when the household moves or splits. In the longitudinal survey, Household ID and Personal ID never change, not even when the person moves to another household (Eurostat 2013). Information on household and individual movements is included separately in the longitudinal database (coded as “household status” and “membership status” in EU-SILC). However, tracing individuals and households who move between waves is not always successful. In the French SRCV, for example, only 65% – 70% of individuals who have moved in one year are followed
up in the next year. The likelihood of being followed up when moving is highest for the principal respondent, and much lower for the other household members. Longitudinal weights provided in EU-SILC are supposed to take into account the phenomenon of non-response, but they are constructed based on the implicit hypothesis that individuals who moved but could have been followed up have the same characteristics as those who moved but could not have been followed up (Burricand and Lorgnet 2014).
When comparing the events of childbirth reported by the longitudinal database to the ones reported by the cross-sectional EU-SILC database, we find that the longitudinal weights are calibrated to represent the cross-sectional population (for more detailed information, see Figures A-2 and A-3 and their interpretation in the Appendix). This reduces the bias caused by attrition to some extent, as the cross-sectional database is less affected by attrition. However, due to its integrated design, not only the longitudinal but also the cross-sectional databases are affected by attrition in EU-SILC.
Attrition is potentially linked to fertility, as starting or enlarging a family might incite parents to move, which increases the risk of not being followed up in EU-SILC. This risk is even higher in case of household splits. If a member of the household leaves the household to live elsewhere, the chances are high that he/she is no longer followed up, especially if the person is not the principal respondent. Adult children who leave the parental home are thus potential candidates for having relatively low follow-up rates. These are in general likely to have a first child, which might explain why EU-SILC especially underestimates childbirth of order one for young women below the age 30. Following this logic, first childbirth will be particularly underestimated for those adult children who leave the parental home because they start their own families. While in some European countries it is relatively common to live alone or to share a flat or live with a partner for a certain time before having children (Nordic countries, Continental countries), in other countries, especially Mediterranean ones, it is usual to leave the parental household only just before having one’s own children (Eurostat 2015, Prioux 2006, Macura and Beets 2002, Kiernan 2002). These childbirths are particularly at risk of not being observed in the longitudinal EU-SILC database. Another group of individuals that might be particularly affected by attrition is people who divorce and separate (Iacovou, Kaminska, and Levy 2012). Births for those who found a new family shortly after separation also risk being under-reported in EU-SILC.
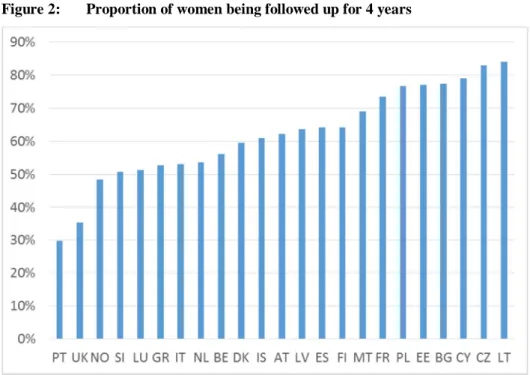
In order to gain more insight into the question of who is particularly concerned by attrition, we now analyze follow-up rates for women aged 15 to 55 who entered the EU-SILC in 2009 and who are supposed to be followed up for four years until wave 2012 (women are in the same rotation group, in each country). EU-SILC does not provide longitudinal data for Ireland, Switzerland, Germany, and Croatia. Sweden, Slovakia, and Romania are missing in Figure 2, as for these three countries longitudinal data was only available until 2011 at the time we conducted the analysis.
On average, for the 23 European countries 61% of women are followed up for four years. Figure 7 illustrates that the follow-up rates are very heterogeneous among European countries in EU-SILC. The countries with the lowest follow-ups are Portugal, the United Kingdom, and Norway, while follow-up rates are highest in Lithuania, the Czech Republic, and Cyprus.
Figure 2: Proportion of women being followed up for 4 years
EU-SILC LT 2009-2012, women aged 15 to 55
The heterogeneity in follow-up is potentially linked to a variety of factors, such as age structure and fertility behavior, but also data collection methods. In France, where a subgroup of individuals is supposed to be followed up for nine years, follow-up rates for the first four years were relatively good. However, Norway, Portugal, Slovakia, and Luxembourg also provide follow-up periods of more than four years for at least one-third of the sample for more recent periods, but the follow-up rates for the first four years for the period 2009‒2012 are low in Norway, Portugal, and Luxembourg. In general, we observe that besides Norway, follow-up rates are also relatively low in Denmark and Iceland. This might also be linked to the fact that the in the Nordic countries (as in the Netherlands and Slovenia), data collection is based on
administrative registers (they use registers to collect several variables) and other information is obtained via interviews with a ‘representative’ person in the household (Iacovou, Kaminska, and Levy 2012).6
Those countries presented in Figure 2 that have the highest follow-up rates are not necessarily those countries with the lowest bias in TFR. Lithuania, Bulgaria, Estonia, and France, for example, have relatively high follow-up rates but also high downward biases in TFR. Thus, a good follow-up does not necessarily lead to less-biased periodic fertility measures. Even if 80% or more individuals of a population are followed up, fertility will be downward-biased due to attrition if the individuals who are most ‘at risk’ of childbirth are the ones that are most likely to drop out of the database.
To understand which categories of women are most affected by attrition, we now calculate follow-up rates by age and number of children.
Figure 3 shows that, on average, in the 23 countries follow-up rates drop between age 15 and age 25 and then increase until age 30. Thus, follow-up rates are lower for women aged 20 to 30 than for women aged 30+.
Figure 4 shows that between ages 25 to 35 the proportion of childless women being followed up for four years is much lower than the proportion of women with at least one child. It is only from age 45 onwards that differences between women without and with children are no longer significant. Differences between mothers having one, two, and three or more children are never significant. Figures 3 and 4 suggest that once women have their own household with children they are quite well followed up, at least from age 25 onwards. Childless women seem to be difficult to follow, especially between the ages of 25 and 35. Follow-up rates are better for childless women at younger ages, probably because a significant proportion of these women still live with their parents. Follow-up rates are also better for childless women at later ages, probably because an significant proportion of these women are settled and no longer move home so much.
6
The register countries are also problematic when it comes to observing the personal information of several household members at the same time in EU-SILC (for example, when the objective is to simultaneously observe a woman’s and her partner’s characteristics in terms of education, activity status, income, etc.). While the register files give complete information on the basic demographic characteristics of each household member, in many cases the personal file containing information about socioeconomic characteristics is only complete for the respondent. For about 50% of partners, some information, such as monthly activity status, is missing.
Figure 3: Proportion of women being followed up for n years, by age
EU-SILC LT 2009-2012, women aged 15 to 55, 3-year moving average Weighted average of 23 European countries
Figure 4: Proportion of women followed up for 4 years, by age and
number of children
EU-SILC LT 2009-2012, women aged 15 to 55, 3-year moving average Weighted average of 23 European countries
0% 10% 20% 30% 40% 50% 60% 70% 80% 16 18 20 22 24 26 28 30 32 34 36 38 40 42 44 46 48 50 52 54 1 year 2 years 3 years 4 years
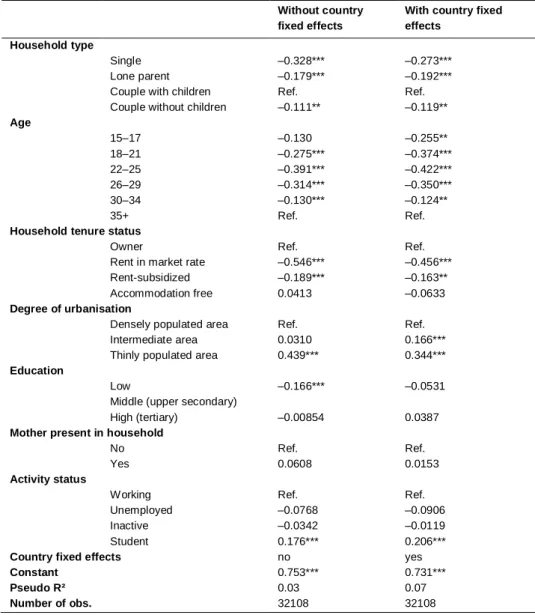
We now further differentiate by a number of individual and household characteristics. Table 5 shows estimations of women’s probability of being followed up for four years, without and with country-fixed effects (logit regression with robust standard errors). Characteristics are observed in the first observed year, i.e., 2009.
The regression confirms that demographic characteristics linked to fertility are highly related to attrition once socioeconomic characteristics and other side effects are controlled for. Childless women aged 20‒30 (who are thus likely to have a first child) have the highest dropout rates.
Table 1 shows that couples with children have the highest follow-up probability, followed by couples without children. Lone mothers and, above all, single women (we observe here childless women who are not living with their partner) have a lower follow-up probability. Age has a convex impact, with the 22‒25 age group having the lowest follow-up probability.
Those households that own the house or apartment they live in are better followed-up than those who rent. Women living in rural areas appear to be easier to follow followed-up than those living in urban areas. All these characteristics are likely to be proxies for women’s probability of staying in the same place of residence during the survey period.
When it comes to activity status, we do not find significant differences between employed, inactive, and unemployed women. The only status that is followed up significantly better in comparison to the other statuses is students, most probably because a significant proportion of students are still registered at their parents’ home and the parents continue to answer the survey for them. However, the mother being present in the household of the woman is not significant once age, activity status, etc. are controlled for. Finally, once controlled for age and all other potential side effects including country-fixed effects, we find no significant differences between education groups in the probability of being followed up for four years.
Country-by-country regressions are presented in Table A-1 in the Appendix, available as additional material from the website. Apart from the fact that coefficients might not be significant due to low sample size, Table A-1 confirms that in general, in most European countries, the follow-up rate in EU-SILC does not depend on socioeconomic characteristics such as education or labor market status. Table A-1 also shows clearly that women in their twenties are harder to follow than women aged 30+ in almost all countries. Couples with children have the highest follow-up rates, in particular compared to childless women who are not living with a partner.
Table 1: Estimated coefficients for women being followed-up for four years, EU (23) (logit regression with robust standard errors)
* p<0.05, **p<0.01, *** p<0.001
EU-SILC LT 2009-2012, women aged 15 to 55.
Without country fixed effects
With country fixed effects
Household type
Single ‒0.328*** ‒0.273***
Lone parent ‒0.179*** ‒0.192***
Couple with children Ref. Ref.
Couple without children ‒0.111** ‒0.119**
Age 15‒17 ‒0.130 ‒0.255** 18‒21 ‒0.275*** ‒0.374*** 22‒25 ‒0.391*** ‒0.422*** 26‒29 ‒0.314*** ‒0.350*** 30‒34 ‒0.130*** ‒0.124** 35+ Ref. Ref.
Household tenure status
Owner Ref. Ref.
Rent in market rate ‒0.546*** ‒0.456***
Rent-subsidized ‒0.189*** ‒0.163**
Accommodation free 0.0413 ‒0.0633
Degree of urbanisation
Densely populated area Ref. Ref.
Intermediate area 0.0310 0.166***
Thinly populated area 0.439*** 0.344***
Education
Low ‒0.166*** ‒0.0531
Middle (upper secondary)
High (tertiary) ‒0.00854 0.0387
Mother present in household
No Ref. Ref.
Yes 0.0608 0.0153
Activity status
Working Ref. Ref.
Unemployed ‒0.0768 ‒0.0906
Inactive ‒0.0342 ‒0.0119
Student 0.176*** 0.206***
Country fixed effects no yes
Constant 0.753*** 0.731***
Pseudo R² 0.03 0.07
Besides age and household type, tenure status and degree of urbanization are significantly correlated with women’s probability of being followed up for 4 years. Home owners are easier to follow up than those who rent in the private sector, and those who live in rural areas are easier to follow up than those who live in urban areas. Exceptions here are small countries, for which the coefficient is most likely to be insignificant due to small sample size and/or because the country is a register country.
The coefficients of age, household type, tenure status, and urbanity suggest that residential mobility causes attrition in EU-SILC. The fact that single women in their mid-20s are particularly affected by attrition suggests that follow-up rates are particularly low for those who leave the (parental) household. This is in line with Burricand and Lorgnet (2014), who find that in the French SRCV individuals leaving a household are most affected by attrition.7
Our finding that socioeconomic characteristics do not play a major role in dropout observation risks suggests that attrition is not a general problem for obtaining consistent estimates when analyzing socioeconomic determinants of childbirth. However, the finding that single women around age 25 are most affected by attrition is rather problematic. This group is not only likely to have a first child but it is also possible that for these women attrition is caused by the fact that they are likely to have a first child. They might leave the parental household because they are pregnant, because they are about to give birth, or because they are planning to start a family in the near future. The closer the two events ‘leaving the parental household’ and ‘starting own family with children,’ the more problematic attrition is for demographic analysis (for example, in countries with long cohabitation and/or rather traditional countries).
In general, residential mobility and childbirth appear to be closely related events, not only for but particularly for first childbirth. Fertility-linked attrition leads to a downward bias in aggregate measures of periodic fertility. This is rather problematic for demographic analysis when the objective is to benefit from the richness of EU-SILC in terms of socioeconomic variables and country coverage, and to calculate, for example, TFR by socioeconomic group. As attrition is not much linked to socioeconomic characteristics, the differences in TFR between socioeconomic groups will not necessarily be biased, but the fertility levels will be generally underestimated.
7Burricand and Lorgnet (2014) also find some significant differences in attrition between socioeconomic
groups, but their analysis is based on a longer follow-up period (2004‒2010) for the French data, while we only model the probability of being followed-up for four years, which corresponds to the length of the follow-period that is available for most countries in the international EU-SILC-sample.
5. Applying a retrospective approach
Our TFR measure presented in Figure 1 is based on a cross-sectional database, using individual cross-sectional weights. The fact that we identify a downward bias in total fertility rates suggests that the weighting process in the cross-sectional database is not efficient enough to compensate for the underrepresentation of childbirths/newborn children.
Following our argument that the downward bias in TFR in the cross-sectional database is linked to attrition, children should appear in the survey sometime after their birth. Once parents have moved and are settled with their children they potentially re-enter the survey in a nationally representative probability sample.
Under these circumstances, measures of periodic fertility will be underestimated in EU-SILC for most recent childbirths, but should be less biased for childbirths that occurred slightly longer ago.
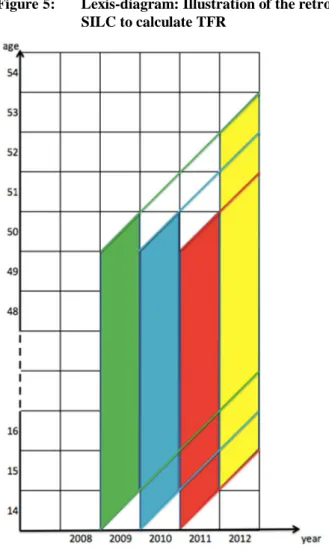
To test this hypothesis, we calculate total fertility rates of certain years by using different waves of the cross-sectional EU-SILC database. The total fertility rate of a certain year is the sum of age-specific fertility rates of this year, while we observe childbirths of all birth orders. The cross-sectional database is used because of its larger sample size. Figure 5 illustrates the logic of our retrospective approach with a Lexis-diagram.
For example, we use the cross-sectional wave of 2012 to calculate total fertility rates for 2011, 2010, 2009, and 2008. For the TFR of 2011 we consider all children whose reported year of birth is 2011 by women aged 16 to 50 years old in 2012 (ages calculated by deducting the year of their birth from the survey year). For the TFR of 2010 we consider all children whose reported year of birth is 2010 by women aged 17 to 51 years old in 2012, and so on. We do not use the cross-sectional wave of 2012 to calculate the total fertility rates of 2012, as interviews for the 2012 wave took place throughout 2012: children born after the interview were therefore observed earliest in the interview of the following year.
Figure 5: Lexis-diagram: Illustration of the retrospective approach in EU-SILC to calculate TFR
Source: Creation by the authors.
Figure 6 presents the total fertility rates for the years 2008‒2011, obtained with the cross-sectional databases of 2009‒2012. To facilitate readability without losing representativeness, for the waves concerned we group together all 30 countries for which cross-sectional samples are available. However, the latter analysis contains measures for each country.
Figure 6: Total fertility rates for the years 2008‒2011, obtained with the cross-sectional databases of 2009‒2012 (EU 30)
EU-SILC CS 2009, 2010, 2011, 2012.
Figure 6 shows that when using the 2012 wave, for example (light-green line), the calculated total fertility rate is the lowest in 2011 and TFR measures are higher in earlier years. For all waves, we observe that the more recent the year, the lower the TFR.
Given the fact that for all years the unbiased weighted TFR measure for this group of countries is higher than 1.55, Figure 11 shows that the downward bias becomes smaller the longer the time delay between the year of childbirth and the interview. The event “childbirth” is thus under-represented in EU-SILC, and children enter the survey during their first years.
Thus, to limit the downward bias in periodic fertility measures, it seems reasonable to observe childbirth in a retrospective way; i.e., to allow for a certain time delay between the childbirth year and the survey year.
Figure 7 illustrates that applying a retrospective approach limits the downward bias in TFR to a significant extent in all countries. The EU-SILC measures of total fertility rates presented in Figure 12 allow for a time delay of more than one year between the time of the survey and the birth event. We use the cross-sectional database of 2012 to observe births in the years 2008, 2009, and 2010. Grouping together three
1,30 1,35 1,40 1,45 1,50 1,55 1,60 2008 2009 2010 2011 TF R Year SILC CS 2012 SILC CS 2011 SILC CS 2010 SILC CS2009
years obtains a sufficiently large sample size for each country, which also serves for the latter analysis, decomposing TFR by age and birth order. To further reduce random variations we aggregate age-specific fertility rates in five-year age groups. With this procedure we observe a minimum of 30 births for each age group and birth order.
We compare these TFR measures to the unbiased measures of total fertility rates for the year 2009, which are calculated by using age-specific fertility rates from the Human Fertility Database. We also use the HFD measures for decomposition analysis by age and birth order, which is presented later in this article. Data on age-specific fertility rates by birth order is only available for 16 countries in the HFD. To ensure comparability, the HFD measures are also aggregated in five-year age groups.
Figure 7 illustrates that with the retrospective approach, the EU-SILC measures of TFR are not significantly different from the HFD for 14 out of 16 countries. In some countries, EU-SILC measures of TFR are even higher than HFD measures, but the difference is not significant. Children seem to be systematically underrepresented (in EU-SILC) in Bulgaria and Slovakia only.
Figure 7: Comparison of EU-SILC retrospective measure and HFD measure of
total fertility rates
HFD 2009.
EU-SILC CS 2012, TFR average for years 2008, 2009, and 2010.
We now use the same EU-SILC and HFD measures as in Figure 7 to calculate the measurement bias in TFR by birth order, as illustrated in Figure 8.
Figure 8: Measurement bias in TFR by birth order (EU-SILC retrospective measure vs. HFD measure)
HFD 2009.
EU-SILC CS 2012, TFR average for years 2008, 2009, and 2010.
In most countries the remaining measurement bias is caused by children of birth order 1. The fact that total fertility rates are below two children per woman in most countries certainly contributes to the importance of birth order 1 for the measurement bias in TFR. However, the measurement biases are very heterogeneous in European countries and do not seem to be directly correlated with fertility levels.
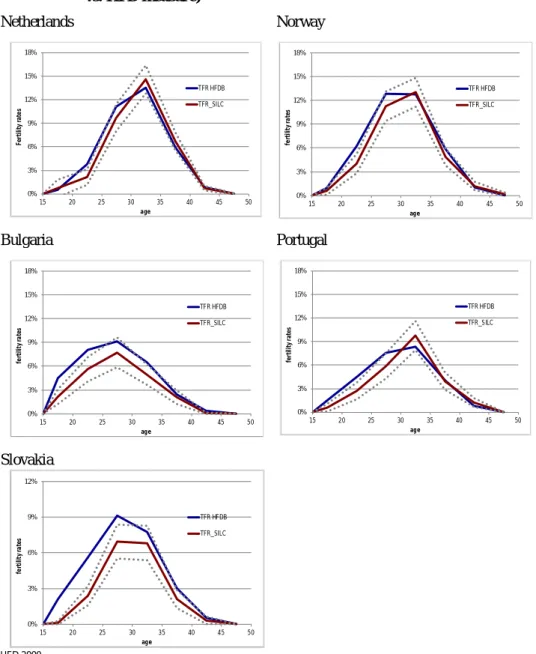
For those five countries with the highest remaining downward bias in total fertility rates (Bulgaria, Netherlands, Norway, Portugal, and Slovakia), we now analyze which ages are particularly affected. Figure 9 compares EU-SILC and HFD measures of the age-specific fertility rates, and shows that childbirth is significantly underestimated for ages 20 to 30 but not for higher ages.
-50% -40% -30% -20% -10% 0% 10% 20% 30% 40% BG LT NL NO PT SK SE EE HU CZ AT FI IS DE SL CH Re la ti ve di ff er en ce EU -S IL C vs H FD B birth order 3+ birth order 2 birth order 1
Figure 9: Age-specific fertility rates by age (EU-SILC retrospective measure vs. HFD measure) Netherlands Norway Bulgaria Portugal Slovakia HFD 2009.
EU-SILC CS 2012, TFR average for years 2008, 2009, and 2010. Fertility rates aggregated in five-year age groups (15‒19, 20‒24, 25‒29, etc.); group-averages presented at the mean age of each age group (17.5, 22.5, 27.5, etc.)
0% 3% 6% 9% 12% 15% 18% 15 20 25 30 35 40 45 50 Fe rt ili ty ra te s age TFR HFDB TFR_SILC 0% 3% 6% 9% 12% 15% 18% 15 20 25 30 35 40 45 50 fe rt ili ty ra te s age TFR HFDB TFR_SILC 0% 3% 6% 9% 12% 15% 18% 15 20 25 30 35 40 45 50 fe rt ili ty ra te s age TFR HFDB TFR_SILC 0% 3% 6% 9% 12% 15% 18% 15 20 25 30 35 40 45 50 fe rt ili ty ra te s age TFR HFDB TFR_SILC 0% 3% 6% 9% 12% 15 20 25 30 35 40 45 50 fe rt ili ty ra te s age TFR HFDB TFR_SILC
Finally, we combine the information on age and birth order. Figure 10 illustrates, exemplarily for Norway, the measurement bias in childbirths by age and rank (figures for the other 15 countries available on request).
Figure 10: Measurement bias in childbirths by age and birth order, Norway
Birth order 1 Birth order 2
Birth order 3 and more TFR measurement bias by age and birth order
HFD 2009.
EU-SILC CS 2012, TFR average for years 2008, 2009, and 2010.
Fertility rates aggregated in five-year age groups (15‒19, 20‒24, 25‒29, etc.); group averages presented at the mean age of each age group (17.5, 22.5, 27.5, etc.)
Apart from Norway, we find that the rate of childbirths of birth order 1 is significantly underestimated for women aged 20 to 25/30 in Bulgaria, the Netherlands, Portugal, and Slovakia, but not in the other 11 countries.
0% 3% 6% 9% 15 20 25 30 35 40 45 50 fe rt ili ty ra te s age TFR HFDB TFR_SILC 0% 3% 6% 9% 15 20 25 30 35 40 45 50 fe rt ili ty ra te s age TFR HFDB TFR_SILC 0% 3% 6% 15 20 25 30 35 40 45 50 fe rt ili ty ra te s age TFR HFDB TFR_SILC
For children of birth order 2 we find significant differences for women aged 20 to 25/30 in Bulgaria, Norway, Portugal, and Slovakia, but not for the other countries. With this retrospective approach, childbirths of birth order 2 are very clearly observable in EU-SILC for the majority of European countries, independent of woman’s age. The blue and red lines are almost identical for most countries.
For children of birth order 3 there are no longer significant differences for any countries and any ages. Note, however, that from birth order 3 on, in many countries the confidence intervals become very large. Nevertheless, almost parallel red and blue lines can be found in the high-fertility countries like Norway, Sweden, Finland, and Iceland, as well as in the Czech Republic, Austria, and Slovenia. Unfortunately, the HFD does not provide data by birth order for France.
Note that these results were obtained by measuring fertility in EU-SILC with a retrospective approach, which limits the bias caused by attrition. Despite this approach, childbirths of birth order 1 and, to a smaller extent, also of birth order 2 are missing in some countries for women aged 20 to 30. This suggests that besides attrition there is a selection bias in these countries; i.e., not only childless women but also women aged 20 to 30 with young children are generally underrepresented in the sample in Norway, the Netherlands, Portugal, Bulgaria, and Slovakia, and cross-sectional weights do not sufficiently compensate for this fact.
6. Differentiation by rotational groups
In the cross-sectional database, around a quarter of individuals are observed for the first time, around a quarter for the second time, around a quarter for the third time, and around a quarter for the fourth time (as illustrated in the schematic in the introduction). The cross-sectional dataset is thus composed of individuals/households of four different rotation groups. Following the logic that childbirth causes attrition, total fertility rates should be lower for those rotation groups in the cross-sectional SEU-ILC sample that contain individuals who have been observed for more than one wave.
To test this hypothesis, we calculate total fertility rates (retrospectively for the period 2008 to 2010, as in the previous section) based on the cross-section database of 2012, and differentiated by rotation group. We take into account individual cross-sectional weights. Due to attrition, the proportion of women who had just entered the survey (in 2012) is somewhat higher than the proportion of women who had been in the survey since 2009, 2010, and 2011. The Austrian cross-sectional sample for 2012, for example, contains 29% of women who entered the survey in 2012, 25% who entered in 2011, 24% who entered in 2010, and 22% who entered in 2009.
Figure 11 illustrates the relative difference in TFR for women who had just entered in 2012 and women observed since 2009, for each country. In the majority of countries, total fertility rates are higher for women who had just entered in 2012 than for women who had entered in 2009. This strongly indicates that childbirth causes attrition. Those women who entered the sample in 2009, and did not drop out until 2012, could have been followed up over the whole period of four years because they did not give birth to a child during that period and thus did not move. The group of women that has just entered the database is therefore more randomly selected than the other groups, as this group is not yet affected by selective attrition – which is why total fertility rates are higher for this group.
Figure 11: Relative difference in TFR for women who had just entered in 2012 and women observed since 2009, for each country
EU-SILC CS 2012, TFR 2008‒2010.
7. Conclusion
The European Union Statistics on Income and Living Condition (EU-SILC) are increasingly used not only in economic but also in demographic analysis. Researchers benefit from the large country coverage and the availability of several harmonized socioeconomic measures. These variables are observed on an individual basis, and household members can be merged. The fact that women’s and their partners’ characteristics can be observed simultaneously represents a major advantage in comparison to other more demographic surveys such as the GGS. However, as a non-demographic survey, birth events risk being underreported in EU-SILC.
0% 10% 20% 30% 40% 50% 60% 70% 80% 90% AT BE BG CZ EE FI FR HU IS IT LT LV NL PL PT
This paper sheds light on the quality of periodic fertility measures in EU-SILC. We find that attrition in the longitudinal database is linked to fertility behavior. Childbirth and residential mobility are correlated events. Consequently, individuals who are likely to have children have a higher probability of not being followed up. This particularly concerns childless women in their twenties. However, follow-up probabilities do not differ significantly between socioeconomic groups in EU-SILC. Thus, attrition is not a general problem in obtaining consistent estimates when analyzing socioeconomic determinants and consequences of childbirth. Yet childbirths, and in particular first childbirths of women under 30, are underrepresented in EU-SILC. Longitudinal weights reduce the downward bias caused by attrition, as EU-SILC provides longitudinal weights such that the longitudinal population represents the sectional population. However, childbirths are also underrepresented in the cross-sectional sample, as the annual cross-cross-sectional data are produced from the longitudinal panel (integrated design). This leads to a downward bias in aggregate measures of periodic fertility. Differences in TFR between socioeconomic groups will not necessarily be biased, but the fertility levels will be generally underestimated. Due to fertility-linked attrition, total fertility rates are higher for those individuals who have just entered the sample in comparison to those who have been observed for consecutive waves.
Thus, one solution for obtaining less-biased measures is to calculate total fertility rates by only observing those individuals who have just entered the survey.8 However, limiting the analysis to one particular rotation group significantly reduces sample size. This is rather problematic for certain analyses of demographic interest, such as calculating TFRs differentiated by socioeconomic characteristics, by country.
In order to maintain a sufficiently large sample size, we therefore suggest applying a retrospective approach when calculating total fertility rates with EU-SILC. Childbirth should not be observed for the calendar year previous to the cross-sectional wave, but with a more important time lag. Applying a retrospective approach limits the downward bias in TFR to a great extent. We find that with a three-year lag, total fertility rates are no longer significantly biased downwards in most European countries. In some countries, however, a downward bias persists despite the retrospective approach, which points to sample selection problems, which, besides attrition, distort measures of periodic fertility.
8 EU-SILC makes it possible to distinguish between rotation groups in the cross-sectional sample. Attention
has to be paid, however, as the rotation groups are numbered differently in the various countries (i.e., the numbers of the rotation groups do not identify the same entry years in all countries, as EU-SILC did not start in all countries in the same year).
Overall, our results suggest that for the majority of European countries, EU-SILC can be used for modeling fertility behavior when respecting the precautionary measures mentioned in this article. EU-SILC is a unique database which has several advantages: it covers a large set of countries and a relatively long time period, it includes not only cross-sectional but also longitudinal data, and, most importantly, it provides comparable socioeconomic information for all adult household members. EU-SILC thus has a strong potential for enriching not only economic but also demographic analyses.
In order to improve the quality of measures of periodic fertility behavior, and to allow EU-SILC users to infer information about national populations, a possible direction for future research is to derive weights that can be used to correct estimates of fertility.
8. Acknowledgments
The data used in this study are from the European Commission, Eurostat, the European Union Statistics on Income and Living Conditions (EU-SILC), the Human Fertility Database (HFD), and the World Bank World Development Indicators (WB WDI). The providers have no responsibility for the results and conclusions of the authors.
References
Burricand, C. and Lorgnet, J.P. (2014). L’attrition dans l’enquête SRCV: Déterminants et effets sur la mesure des variables monétaires. Economie et statistique 469(1): 19‒35.doi:10.3406/estat.2014.10422.
D’Albis, H., Gobbi, P., and Greulich, A. (forthcoming). Having a second child and access to childcare: Evidence from European countries. Journal of Demographic
Economics.
D’Albis, H., Greulich, A., and Ponthière, G. (2015). Avoir un enfant plus tard: Enjeux sociodémographiques du report des naissances. Paris: Rue d’Ulm (Collection du CEPREMAP n° 39).
De Santis, G., Drefahl, S., and Vignoli, D. (2014). Un indice synthétique de fécondité enrichi à partir des données de panel. Population 69(3): 463‒476.
doi:10.3917/popu.1403.0463.
Desplanques, G. (1993). Mesurer les disparités de fécondité à l’aide du seul recensement. Population 48(6): 2011‒2023. doi:10.2307/1534171.
Eurostat (2013). Description of target variables: Cross-sectional and longitudinal, 2012 operation (version May 2013). Luxembourg: European Commission, Eurostat Directorate F (EU-SILC 065 [2012 operation]).
Eurostat (2015). Being young in Europe today [electronic resource]. Luxembourg: Eurostat Statistics Explained. doi:10.2785/59267.
Grabill, W.H. and Cho, L.J. (1965). Methodology for the measurement of current fertility from population data on young children. Demography 2(1): 50‒73.
doi:10.2307/2060106.
Greulich, A. and Rendall, M. (2016). Multiple imputation for demographic hazard models with left-censored predictor variables. Demographic Research 35(38): 1135‒1148.doi:10.4054/DemRes.2016.35.38.
Greulich, A., Thévenon, O., and Guergoat-Larivière, M. (2016). Securing women’s employment: A fertility booster in European countries? Paris: Centre d’Economie de la Sorbonne (CES working paper 2016‒24). ftp://mse.univ-paris1.fr/pub/mse/CES2016/16024.pdf
Human Fertility Database [electronic resource]. Max Planck Institute for Demographic Research (Germany) and Vienna Institute of Demography (Austria). www.humanfertility.org (data accessed on 01/03/2015).
Iacovou, M., Kaminska, O., and Levy, H. (2012). Using EU-SILC data for cross-national analysis: Strengths, problems and recommendations. Colchester: Essex University (Institute for Social and Economic Research Working Paper Series No. 2012‒03).
Kiernan, K. (2002). Cohabitation in Western Europe: Trends, issues and implications. In: Booth, A. and Crouter, A.C. (eds.). Just living together: Implications of
cohabitation on families, children and social policy. Mahwah: Lawrence
Erlbaum: 3‒32.
Klesment, M., Puur, A., Rahnu, L., and Sakkeus, L. (2014). Varying association between education and second births in Europe: Comparative analysis based on the EU-SILC data. Demographic Research 31(27): 813‒860. doi:10.4054/Dem
Res.2014.31.27.
Macura, M. and Beets, G. (eds.) (2002). Dynamics of fertility and partnership in Europe: Insights and Lesson from Comparative Research (Vol. 1). New York: United Nations Economic Commission.
Matysiak, A., Sobotka, T., and Vignoli, D. (2016). The impact of the great recession on
fertility in Europe. Paper presented at PAA 2016 Annual Meeting, Washington,
31 March‒2 April.
Nitsche, N., Matysiak, A., van Bavel, J., and Vignoli, D. (2015). Partners’ educational pairings and fertility across Europe. Stockholm University: Families and Societies (Working Paper Series 38/2015).
Prioux, F. (2006). Vivre en couple, se marier, se séparer: Contrastes européens. Paris: INED (Population et Société 422).
Rendall, M., DeRose, A., Evans, A., Gray, E., Hanappi, D., Kreuter, F., Lappegard, T., Reeder, L., Rønsen, M., and Toulemon, L. (2014). Employment impacts on partnership and parenthood entry in different family-policy regimes. Paper presented at European Population Conference, Budapest, June 27.
Vergauwen, J., Wood, J., De Watcher, D., and Neels, K. (2015). Quality of demographic data in GGS Wave 1. Demographic Research 32(24): 723‒774.
Appendix
Figure A-1: Comparison of EU-SILC-derived TFR with unbiased TFR from the WB WDI
TFR: EU-SILC CS 2011 ‒ children born in 2010, against WB WDI 2010. HU ES PL PT DE IT AT LV LV CZ GR CH BG SI LU EE NL BE FI DK UK NO SE FR IS R² = 0.716 0.5 0.7 0.9 1.1 1.3 1.5 1.7 1.9 2.1 2.3 2.5 1 1.2 1.4 1.6 1.8 2 2.2 2.4 T F R (E U -S IL C ) TFR (WB WDI)
Figure A-2: Probabilities of first childbirth by age – comparison of cross-sectional and longitudinal samples in EU-SILC, without weights
All women aged 15 to 50 Partnered women aged 15 to 50
EU-SILC LT 2009‒2012, EU-SILC CS 2012, women aged 15 to 50. Average 23 European countries
Control for attrition in EU-SILC by longitudinal weighting
Longitudinal weights provided in EU-SILC are supposed to take into account the phenomenon of non-response. To identify how far these longitudinal weights control for attrition linked to fertility within the EU-SILC databases, we compare fertility measures obtained with the cross-sectional and the longitudinal databases, with and without the respective weights.
More precisely, we calculate age-specific fertility rates by birth order for women aged 15 to 50 in 2009. First, in the longitudinal database, we concentrate on women who are observed for the full period of four years, from 2009 to 2012, and we observe their childbirths during this period. Second, we use the cross-sectional database of 2012 to observe childbirths for the years 2009 to 2012. In each dataset we group together all countries that are available in the two datasets. We expect fertility to be lower in the longitudinal database, as here we selected only women who are observed for the entire four years, while the cross-sectional database contains four rotation groups.
Figure A-2 illustrates our findings for first childbirth.
Without taking into account the cross-sectional and longitudinal weights, we find that the phenomenon of first childbirth is underrepresented in the longitudinal database compared to the cross-sectional database, while the difference is significant for ages 20 to 30 (left panel). For second and third childbirths there is no significant difference between the two datasets (results are available on request). This again indicates that attrition is linked to first childbirth of young women. The right panel in Figure A-2
0 0,05 0,1 0,15 0,2 0,25 0,3 0,35 15 20 25 30 35 40 45 50 LT CS 0 0,1 0,2 0,3 0,4 0,5 0,6 20 25 30 35 40 45 50 LT CS
shows that once we focus on partnered women, the difference disappears. In the cross-sectional database we do not know if women were already partnered in 2009 (beginning of the observed period in the longitudinal database). In order to obtain the best comparability between the two datasets we select in both the longitudinal and the cross-sectional dataset women who were partnered in 2012. In line with the previous section, this suggests that being partnered is a good proxy for having founded one’s own household, which increases the chance of being followed up in EU-SILC, even when the household as a whole moves. It seems that women who do not live with their parents until shortly before or after first childbirth are particularly affected by attrition. A country-by-country analysis (available on request) shows that the difference in first childbirth for ages 20 to 30 between the cross-sectional and the longitudinal database is particularly pronounced in Mediterranean countries, where late cohabitation with parents is quite common, while the differences are not significant in the Nordic countries, France, and other Continental countries, even for young ages.
Finally, taking into account the cross-sectional and longitudinal weights leads to the fact that the differences between the two datasets are no longer significant for all ages (all women, not only the partnered ones), as Figure A-3 illustrates.
Figure A-3: Probabilities of first childbirth by age – comparison of cross-sectional and longitudinal samples in EU-SILC, with individual weights
EU-SILC LT 2009-2012, EU-SILC CS 2012, women aged 15 to 50. Average of 23 European countries
It seems thus that in EU-SILC, the cross-sectional database, which is less affected by attrition, serves to create longitudinal weights that reduce the fertility bias caused by attrition in the longitudinal database. However, attrition also affects the cross-sectional
0 0,05 0,1 0,15 0,2 0,25 0,3 15 20 25 30 35 40 45 50 LT CT
EU-SILC samples to a significant extent, as the annual cross-sectional data is produced from the longitudinal panel (integrated design: see section 2, Description of the database).
Table A-1: Probability of women being followed-up for four years, country-by-country
available as additional material from: