HAL Id: hal-00746569
https://hal.archives-ouvertes.fr/hal-00746569
Submitted on 31 Oct 2012HAL is a multi-disciplinary open access archive for the deposit and dissemination of sci-entific research documents, whether they are pub-lished or not. The documents may come from teaching and research institutions in France or abroad, or from public or private research centers.
L’archive ouverte pluridisciplinaire HAL, est destinée au dépôt et à la diffusion de documents scientifiques de niveau recherche, publiés ou non, émanant des établissements d’enseignement et de recherche français ou étrangers, des laboratoires publics ou privés.
Chlorophyll and turbidity concentrations deduced from
MODIS as an index of water quality of the Gulf of
Gabes in 2009
Rim Katlane, Cecile Dupouy, Fouad Zargouni
To cite this version:
Rim Katlane, Cecile Dupouy, Fouad Zargouni. Chlorophyll and turbidity concentrations deduced from MODIS as an index of water quality of the Gulf of Gabes in 2009. AUF. Télédétection 11, 1, CNRS & Campus Spatial Univ. Paris Diderot VII, pp.265-273, 2012, Télédétection. �hal-00746569�
CHLOROPHYLL AND TURBIDITY
CONCENTRATIONS AS AN INDEX OF
WATER QUALITY OF THE GULF OF GABES
FROM MODIS IN 2009
Rim Katlane
1*, Cécile Dupouy
2and Fouad Zargouni
11 Université de Tunis El Manar, Faculté des Sciences de Tunis, 11ES13 Géomatique, géologie structurale et appliquée, 2092, Tunis, Tunisie.
2 M.I.O., CNRS/IRD/AMU/USTV 7294, 235 (Mediterranean Institute of Oceanology), (Nouméa, New Caledonia)
E-mails: katlanerim@yahoo.fr*; cecile.dupouy@ird.fr; fouadzargouni@yahoo.fr
Soumis le 21 février 2011 ; accepté le 14 mars 2012 - © Revue Télédétection, 2012, vol. 11, n° 1, pp. 263-271 Abstract
Optical remote sensing was used to provide scientific information to support environmental management in the Gulf of Gabes located on the southeastern coast of Tunisia. This region is characterized by a shallow continental shelf with semi-diurnal tides. Since the early 1970s, industrial activity in this area may have contributed to the degradation of ecosystem biodiversity due to problems of eutrophication and the disappearance of benthic and planktonic species. Previous studies assessing the long term effects of anthropogenic and natural discharges on the Gulf of Gabes were based on regular seaborne measurements of total suspended matter, Secchi depth, turbidity, chlorophyll and tempera-ture. However, these are often costly and difficult to obtain.
The objective of this study is to carry out an optical remote sensing analysis with supporting in situ measurements of chlorophyll to monitor water quality and the impact of industrial discharges in the Gulf of Gabes. To start with, data provided both by the optical sensor and by our in situ sampling methods is described. Then, semi-empirical algorithms (OC3, OC5) are presented which are used to process Moderate Resolution Imaging Spectrometer MODIS data for retrieval of chlorophyll (CHL) and a validated algorithm for TU. A comparison was made between the derived esti-mates CHL and TU and the concurrent bio-optical in situ measurements at stations representing the coast and open ocean and produced significant correlations. The results obtained therefore confirm the high sensitivity and useful spatial coverage of MODIS data to provide a significant tool to accurately assess water quality parameters.
Keywords : MODIS; chlorophyll; turbidity; Gulf of Gabes.
EXTRACTION DE LA CONCENTRATION DE LA CHLOROPHYLLE ET DE LA TURBIDITÉ
COMME UN INDICE DE LA QUALITÉ DE L'EAU DANS LE GOLFE DE GABES DURANT
L'ANNÉE 2009 À PARTIR DES DONNÉES MODIS.
Résumé
Les activités industrielles et de service, les déchets anthropiques et naturels et la pêche intensive ont contribué à la dégra-dation de la biodiversité de l’écosystème du golfe de Gabès. Cette situation a entraîné des problèmes d’eutrophisation et de disparition de certaines espèces benthiques et planctoniques, avec perte du couvert végétal de l’ordre de 90 %, condui-sant à l'installation de biocénoses caractérisées par une faune et une flore de milieux envasés et dégradés. Deux campagnes de mesure en mer ont été effectuées pour mesurer la concentration de la chlorophylle, ainsi que la turbidité, la concentration de la matière en suspension, la transparence et la température de l’eau dans le golfe de Gabès. Les cam-pagnes menées en juillet et en octobre 2009, ont été réalisées respectivement sur 30 et 28 stations. Les premières sont réparties dans l'ensemble du golfe et les secondes concernent 3 sites avec 11 stations dans chacune des régions du port de Gannouch et de Skhira et 6 stations dans la région de Sfax Kerkennah. Les résultats de ces deux campagnes de mesure ont servi de base pour une première validation des données satellitaires Moderate Resolution Imaging Spectrometer MODIS AQUA. La chlorophylle a été cartographiée à partir de deux algorithmes publiés (OC3 et OC5). L’exploitation des don-nées satellitaires a permis de décrire la variabilité saisonnière et spatiale de la concentration de la chlorophylle et de la turbidité de la surface de l’eau. L’analyse et l’interprétation des cartes journalières et mensuelles de la concentration de la chlorophylle satellitaire, générées pour l’année 2009, montrent une cohérence par rapport aux données mesurées avec toutefois une forte surestimation des concentrations de la chlorophylle aux alentours des îles Kerkennah, Kneiss et Jerba pour OC3, une surestimation moindre par l’algorithme OC5 avec une corrélation de l'ordre de 80% qui montre donc des résultats beaucoup plus satisfaisants pour la bande littorale du golfe de Gabès.
264│Chlorophyll and turbidity concentrations
© Revue Télédétection, 2012, vol. 11, no 1
1. INTRODUCTION
Services and industrial activities, anthropic and natural discharges and intensive fishing activities have contributed to the degradation of the ecosystem biodiversity in the Gulf of Gabes (Ben Mustapha et al., 1999). Industrial activity which began in the seventies in the region of Gannouch notably deteriorated the environment. Studying primary produc-tion, temporal and spatial distribution of phytoplankton and water quality requires many costly seaborne measurements. Preliminary studies of Curan et al. (1987), Deschamps et al. (1987), Jaquet et al. (1999) and more recent research (Doxaran et al., 2002, Ouillon et al., 2008, Nechad et al., 2010 and Dupouy et al., 2010) have allowed to analyze coastal surface waters by means of satellite remote sensing and examined the empirical relationships between in situ reflectance and concentration of Total Suspended Matter (TSM), turbidity (TU), and chlorophyll (CHL). Many versions of algorithms have been developed depending firstly on the sensor type and secondly on the classification of waters proposed by Morel and Prieur (1977). In case 1 water, optical properties are dominated by CHL and associated degrada-tion products. In coastal waters, classified as case 2, suspended particulate sediments and yellow substances of terrestrial origin, which are not co-varying with CHL, lead to a greater number of errors in estimating chlorophyll concentration (Carder et al., 1991; Gohin et al., 2002).
TSM can be estimated via the optical properties of suspended particles assuming, either directly or indirectly, a constant relationship between particle mass and particulate scattering. It is well known that, in reality, the relationship between particle mass and optical properties varies as a function of particle size and composition (refractive index). A family of TSM retrieval algorithms was described by Nechad et al. (2010) based on inversion of a theoretical model giving reflectance at a single wavelength as an increasing function of TSM. Such algorithms for the red bands (600-700 nm) of the Moderate Resolution Imaging Spectrometer (MODIS), Sea-viewing Wide Field-of-view Sensor (SeaWiFS) and Medium-Spectral Resolution, Imaging Spectrometer (MERIS) were used on the Gulf of Gabes (Katlane et al., 2011). Chlorophyll is usually estimated from the ratio of blue to green water leaving radiance or from remote sensing reflec-tance Rrs using an empirical relationship and semi-analytical bio-optical models (Babin et al., 2003 and Gordon et al., 1988). Several versions of algorithms have been established to model CHL: OC2, OC3 and OC4 (O’Reilly et al., 2000; Maritorena et al., 2002) in order to find the best statistical relationship between in situ measurements and remote sens-ing reflectance (Log-Log regressions). The OC2 algorithm for the Coastal Zone Color Scanner (CZCS) uses the Blue/Green ratio Rrs(490)/Rrs(555). The OC4 algorithm (SeaWiFS) uses a single set of coefficients determined by the greatest ratio of Rrs(443)/Rrs(555), Rrs490)/Rrs(555) and Rrs(510)/Rrs(555) (O'Reilly et al., 2000). The OC3 algorithm (MODIS-A) uses the maximum ratio Rrs(443)/Rrs(551) and Rrs(488)/Rrs(551). Finally, the latest published version is OC5 (Gohin et al., 2002), which is a bio-optical empirical for MODIS, MERIS and SeaWifs data suited for case 2 French coastal waters. This algorithm tends to correct overestimation of chlorophyll in turbid waters by using a lookup table adapted to the French Northern Coastal waters based on thresholds of Rrs at 555 nm and 412 nm.
The objective of our study was to monitor water quality and the impact of industrial discharges on the chlorophyll surface concentration in the Gulf of Gabes with MODIS imagery. At first, our in situ sampling methods are described. Then, our 2009 data set provided from different sources, satellite, in situ optical sensors and laboratory analysis is presented. Chlorophyll and turbidity from MODIS data are retrieved by applying semi-empirical algorithms; infor-mation is then extracted, quality is controlled and data is validated. Then, CHL is mapped from both OC3 and OC5 algorithms for clear daily images from 2009 and data are extracted at station locations, while TU is mapped using a previously validated algorithm.
2. STUDY SITE
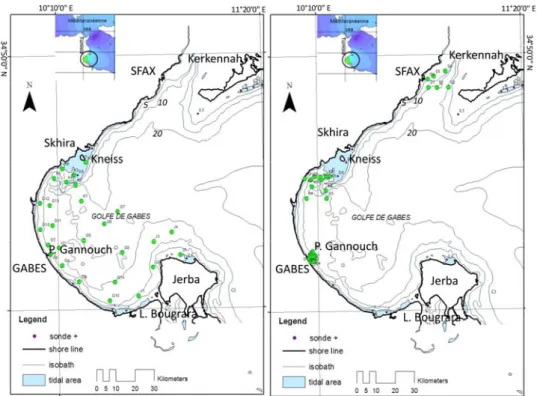
The Gulf of Gabes, part of the Pelagian Sea as described in Burollet et al. (1979), is located in southeastern Tunisia. It has a shallow continental shelf with a gentle slope extending 250 km offshore and ranging from 0.7 m up to 50 m in depth (figure 1). The hydrodynamics of this area are influenced by semi diurnal tides with maximum amplitude of 1.8 m in Gabes and a minimum of 0.3 m (Sammari et al., 2006). The climatology of the studied area is influenced by the temperate, humid and hot Mediterranean air coming from the east, and also by the subtropical, dry, hot and sandy Saharan air coming from the southwest (Sogreah, 2002).
Intensive fishing, as well as natural and anthropogenic wastes, has contributed to the degradation of ecosystem biodi-versity in the Gulf (Ben Mustafa et al., 1999). Industrial activities causing heavy environmental deterioration began in the region of Gannouch in the seventies. The study done by Bjaoui et al. (2004) showed that phosphogypsum pollution, which comes from the production of phosphoric acid, covers over 60 km² of the area. From multitemporal TU maps produced from MODIS for 2009, areas around the islands (Kerkenah, Kneiss and Jerba) and at the industrial port of Gannouch, we showed that these areas are characterized by high values of turbidity, which can extend towards the center of the Gulf over distances of 70 km (Katlane et al., 2011).
o
Figure 1 : Location of sampled stations, July 2009 on the left and October 2009 on the right. Green circles indicate the position of in
situ measurements. Station numbers are indicated. Localisation des stations de mesures : juillet 2009 à gauche et octobre 2009 à droite ; les cercles verts indiquent les positions des mesures in situ. Les noms des stations sont indiqués.
3. METHODOLOGY
3.1 MODIS AQUA data
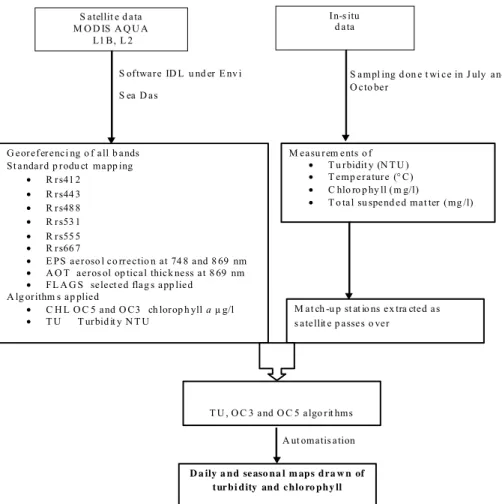
Satellite imagery from 2009 for the Gulf of Gabes from MODIS AQUA provided by the National Aeronautics and Space Administration (NASA), Ocean Biology Processing Group (OBPG) was used in this study. Level 2 (L2) satellite data products, available from http://oceancolor.gsfc.nasa.gov/ contain the geophysical value for each pixel, derived from Level-1B (L1B) radiance after radiometric calibration, atmospheric correction and bio-optical algorithms. Level 1 (L1B) calibrated radiance at 1Km resolution (MYDO21 km) was also downloaded from the Level 1 Atmosphere Ar-chive and Distribution System (LAADS; ladsweb.nascom.nasa.gov/data/). These L1B data were used to support the L2 data to subjectively check the quality of the atmospheric correction implemented by NASA. Geometric correction was done with SeaDas on L2 geophysical products. MODIS L1B and chlorophyll L2 data using SeaDas and IDL software were processed and validated with in situ data. The flow chart shows the approach for processing and interpreting the data to generate chlorophyll maps (figure 2).
Chlorophyll was mapped using OC3, the semi-analytical algorithm for MODIS adapted to case 1 waters (O'Reilly et al., 2000). The standard MODIS OC3 Chlorophyll algorithm uses the following formula:
[
CHL_a=10**(a0−a1*R+a2*R2+a3*R3−a4*R4)(1)
where R (Ratio) is the greatest log ratio of Rrs(443)/Rrs(555), Rrs(490)/Rrs(555), and Rrs(510)/Rrs(555), and a0=0.283; a1=-2.753; a2=1.457; a3=0.659 and a4=-1.403.
Indeed, as the resuspension of the bottom sediments due to tidal effects and the phosphosgypsium wastes 4700 m3/h (Sogreah, 2002), the waters in the shallow coastal regions were classified as case 2 according to the classification established by Gordon and Morel (1983). This conclusion was made from TU maps issued from the algorithm applied to MODIS channel 667nm (Katlane et al., 2011). Recall that values of TU in this paper was estimated using the bio-optical algorithm dedicated to coastal waters of Nechad et al. (2009) applied to MODIS remote sensing reflectance at band 667 nm (Rrs 667) and validated for the same area (Katlane et al., 2011). For this reason, chlorophyll was mapped using OC5 (Gohin et al., 2002) applied to L2 MODIS remote sensing reflectance at the 5 dedicated bands, and com-pared to OC3 to compare performance of both algorithms in case 2 waters of the Gulf.
266│Chlorophyll and turbidity concentrations
© Revue Télédétection, 2012, vol. 11, no 1
Figure 2 : Flow chart of the methodology adapted to map TU and CHL. Organigramme de la démarche suivie pour l’interprétation
des images niveau 2 MODIS, (L2) et la génération de cartes de la chlorophylle a et de la turbidité.
3.2 In situ data
In situ data were collected from the 5th to the 7th of July 2009, and on the 6th, 8th and 19th of October 2009, concurrently
with the satellite overpasses (Katlane et al., 2011). Station locations are shown in figure 1. These seaborne measure-ments consist of chlorophyll a (µg/l or mg.m-3) shown at Table 1. Concurrent TU (NTU), water transparency (m-1),
TSM (mg/l), and temperature (°C) results are provided for the same stations in Katlane et al. (2011).
Chlorophyll a was measured by the spectrophotometric method in the GREEN LAB laboratory (Tunisia). Full details of the method can be found in REVAMP protocols (Tilestone, 2002) .Turbidity, suspended matter, and water transparency using a Secchi disk were measured as in Katlane et al. (2011).
Table 1 : Summary of measurement ranges; CHL: Chlorophyll concentration (µg/l) (see locations in figure 1). Minimum and
maximum values for measurements taken in July and October 2009. Résultats des mesures de la chlorophylle dans le golfe de Gabès;
CHL : concentration en chlorophylle μg/l ; (voir stations figure 1). Minimum et maximum de mesures pour les deux dates juillet et octobre 2009.
Locations CHL (µg/l)
min July CHL (µg/l) max July min October CHL (µg/l) max October CHL (µg/l)
Port of Gannouch 0.7 1 -
Jerba 0.5 1.6 -
Kneiss 0.5 4.7 0.5 1.6
Lagune Bougrara 14 14 -
Sfax-Kerkennah 0.5 - 0.5 1.3
4. RESULTS AND DISCUSSION
The 2009 MODIS images were processed and only those without high sun glint, heavy cloud cover or atmospheric correction problems were kept for the validation study (59 scenes in 2009). The approach to product validation for CHL (2) was by “match-up”, comparing the data value for a satellite pixel with an in situ measurement from a location within that pixel and acquired almost simultaneously. MODIS CHL data were extracted around match-up stations using a 3x3
S atellit e d ata M O D IS A Q U A
L1 B, L 2
In-s itu d ata
S ampl ing d on e t wi ce in J uly and O cto ber
S oftware ID L u nd er E nv i S ea D as
G eoreferenci ng o f all b ands St andard p rodu ct mapp ing
• R rs41 2 • R rs44 3 • R rs48 8 • R rs53 1 • R rs55 5 • R rs66 7
• E PS aeroso l co rrectio n at 74 8 and 8 69 nm • A O T aeros ol op tical thick ness at 8 69 nm • FL A G S select ed flag s app lied A lg orithm s ap plied
• C H L O C 5 and O C3 ch lorop h yll a µ g/l • T U T urbid it y N T U
T U , O C 3 and O C 5 algo rit hms
M at ch -u p st at io ns ex tra cted as s atellit e p asses o ver
D a ily a n d se aso na l m ap s d r a w n of t ur b i d ity an d c hlo ro ph y ll
A ut omatis ation M easu rem ents o f
• T u rbidit y (N T U ) • T emp erature (° C) • C hlo ro p hy ll (m g/l)
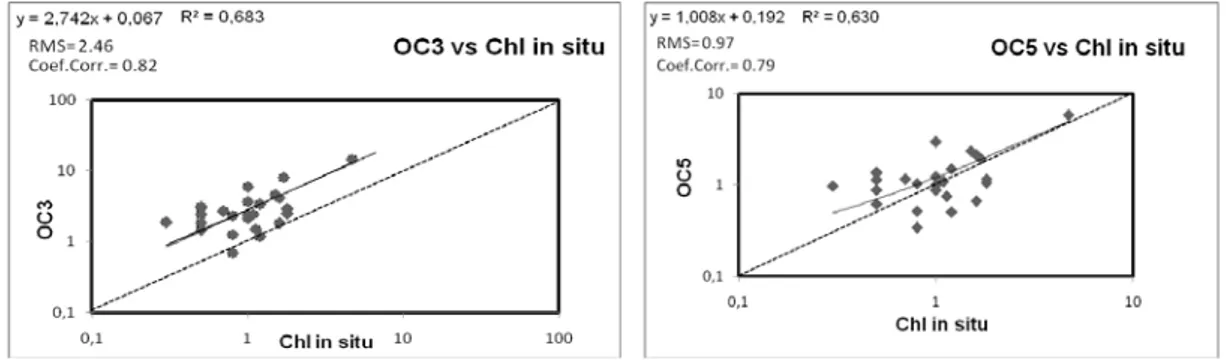
o box. In order to obtain relationships, only the pixels where in situ measurements were taken at the time of satellite overpass (+/-30 min) were considered, in order to avoid uncertainty from tidal effects (bottom sediment resuspension). The scatter plots between in situ measurements and MODIS CHL derived from OC5 or OC3 (figure 3) show similar correlations (68 and 62%, respectively). OC5 allows a better retrieval of chlorophyll concentrations (CHLMODIS_OC5= 1.11 CHLin-situ) whereas OC3 overestimated chlorophyll (CHLMODIS_OC3= 2.78 CHLin-situ). The value at the top of the regression corresponds to a Kneiss mid-water station and was left in the regression. Exam-ples of TU and CHL maps are given for the dates of July 5th, 2009 (figure 4) and October 8th, 2009 (figure 5). For CHL,
the MODIS ocean color Standard NASA OC3 algorithm is known to overestimate chlorophyll in coastal waters of the Mediterranean area (Jaquet et al., 1999 and Barale et al., 2008). This overestimation is not as high with OC5 as shown by the July 5th image (figure 4b), or by the October 8th image (figure 5b), compared with images obtained with OC3
(figure 4c, figure 5c). This is especially true around Kerkennah, Kneiss and Jerba islands and Bougrara lagoon where remaining high CHLOC5 values are probably linked to shallow water and bottom reflection (as an example the highest value at Kneiss).
Figure 3 : Scatter plot of MODIS-derived CHL (µg/l) versus seaborne CHL (µg/l). On the left, CHL MODIS modeled from OC3; on
the right, CHL MODIS modeled from OC5. Relation entre CHLMODIS et CHL in situ (µg/l) in situ. A gauche, calculée à partir
d’ OC3, à droite calculée à partir d’OC5.
The MODIS satellite images of CHL and TU show different distributions throughout the study area (figures 4 and 5). The TU maps derived for the 5th July and 8th October 2009 (figures 4a and 5a) as well as the other images processed in
2009 (Katlane et al., 2011) show a maximum value of about 10 NTU around the Gulf islands and 7 NTU in the region of Gannouch, confirming that the coming out of turbidity is from the industrial port, and spread over the Gulf (c). Apart these maximum, the highest TU concentrations are located around the islands (Kerkennah, Kneiss and Jerba) and also in the industrial port of Gannouch.
The distribution of the chlorophyll according to the CHL OC5 images (figure 4b and 5b) shows a maximum of 20 mg/m3 around Gulf islands and Bougrara lagune. However CHL OC5 chlorophyll in the southwest port of Gannouch is
about 3 mg/m3. This proves the performance of the OC5 algorithm applied, excepted around the Sfax region, and in the
areas surrounding the Kerkennah, Jerba and Kneiss islands when TU and CHL OC5 record the highest values, when compared to deeper neighboring regions, especially the center of the Gulf of Gabes (c). Such high values remaining after the OC5 algorithm application are mainly due to the shallowness of the water causing enhanced bottom reflection. The monthly distribution concentration of CHL for 2009 records its highest values in August, September and October, due to algal blooms during these months, as shown for the September 16th image around the Gulf islands and in the
southwest port of Gannouch (figure 6). In fact, according to data from the National Network for Monitoring of Phy-toplancton during the period of 1995-2005 (Fekki et al., 2008, Bel Hassen et al., 2008 and Bel Hassen et al., 2009), different phytoplancton classes are found in the coastal area especially in the lagoon of Bougrara (Djerba island southwestern Gulf of Gabes) than near the Port of Gannouch and than in the central part of the Gulf of Gabes. The in
situ observations show that the period from August to January, with peaks in September and January, seems to be
268│Chlorophyll © Revue Télédé Figure 4 : M OC5 and (c) C la chlorophy CH Figure 5 : M
with OC5 and
tion de la chlo et (c) Figure 6 : M (mg/m3) wit CHL pour l'im The MODIS coastal water overestimatio
and turbidity conce
étection, 2012, vo MODIS imagery CHL (mg/m3) w ylle CHL pour HL (mg/m3) calc MODIS imagery d (c) CHL (mg/ orophylle CHL CHL (mg/m3) c MODIS imagery th OC3. Black p mage du 16 sep calculée av OC3 algorith rs (Gitelson e on is not as hi entrations l. 11, no 1
y over the Gulf with OC3. Black
l'image du 05 j culée avec OC3
y over the Gulf /m3) with OC3.
pour l'image d calculée avec O
over the Gulf o points indicate t
ptembre 2009 à vec OC3. Les po
hm for chloro
et al., 1996). T
igh for OC5 (
of Gabes on Ju k points indicat
uillet 2009 à 13 3. Les points noi
f of Gabes on O . Black points in
du 08 octobre 20 OC3. Les points
of Gabes on Sep the location of i
13:00 UTC(a) oints noirs indiq
phyll a, based This overestim figure 7) beca uly 5th 2009 at 1 te the location o 3:00 UTC(a) Tu irs indiquent la October 8th 2009
ndicate the loca
009 à 13:00 UT noirs indiquen ptember 16th 20 industrial disch Turbidité (NTU iquent la localis d on the green mation is conf
ause this type
13:00 UTC (a) T of industrial dis urbidité (NTU), a localisation de 9 at 13:00 UTC ation of industri TC(a) Turbidité t la localisation 009 at 13:00 UT harges. Distribu U), (b) CHL(mg sation des point
n/blue Rrs rat firmed here in of algorithm Turbidity TU(N scharges. Distri (b) CHL(mg/m es points de déc (a) Turbidity T ial discharges. D é (NTU), (b) CH n des points de d TC (a) CHL (mg ution de la conc g/m3) calculée a ts de décharge i
tio, are known n many places is developed NTU), (b) CHL ibution de la co m3) calculée ave charge industri TU(NTU), (b) C Distribution de HL(mg/m3) calc décharge indus mg/m3) with OC5 centration de la avec OC5 et (c) industrielle. n to overestim s of the Gulf o for Case 2 wa (mg/m3) with oncentration de ec OC5 et (c) elle. CHL (mg/m3) e la concentra-ulée avec OC5 strielle. 5 and (b) CHL chlorophylle ) CHL (mg/m3) mate values in of Gabes. The aters and uses n e s
o not only the blue/green ratio but also the Rrs_412, which concerns CDOM and NAP absorptions, and Rrs_547, which reveals backscattering mainly due to suspended matter. Overestimation of chlorophyll values is mostly in the Gulf islands: Kerkennah, Kneiss and Jerba, and particulary around the Kneiss island, as this area is characterized by very shallow water, <1m, and an abundant benthic population. In these shallow waters, the performance of algorithms may be improved by selecting stations with a high TDT index, an index implying the knowledge of total chlorophyll (T), depth (D) and Turbidity (T) at each station (Dupouy et al., 2010). Also it would be interesting to detect specifically Trichodesmium blooms are they often dominate phytoplankton and as their optical signature is rather specific (Dupouy
et al., 2008).
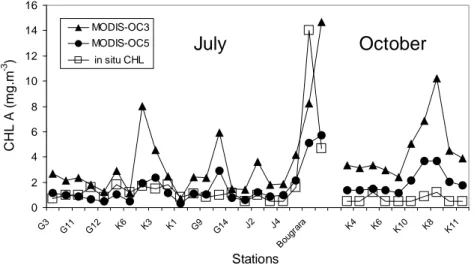
Figure 7 : Comparison of in situ CHLA data during sampling and of ocean color chlorophyll retrieved with the two algorithms
MODIS OC3 and MODIS OC5 as a finction of stations in July and October 2009 (station names as on maps Figure 1). Comparaison
des résultats issus des mesures in situ et des deux algorithmes appliqués OC3 et OC5 en fonction des localités lors des deux cam-pagne en mer juillet et octobre 2009 (noms des stations comme sur les cartes figure 1).
5. CONCLUSIONS
Ocean satellite images can offer rapid concurrent and synoptic observations for deriving seawater constituents and the impact of industrial discharges. In this study, MODIS satellite data and various bio-optical algorithms were used for retrieving chlorophyll and spatial distributions were generated.
In order to map CHL distribution in the Gulf of Gabes, OC3 and OC5 algorithms were applied. The standard MODIS OC3 with a linear function (CHLMODIS_OC3= 2.78 CHLin-situ) as expected overestimated chlorophyll. The second algorithms OC5 (CHLMODIS_OC5= 1.11 CHLin-situ) allows a better retrieval of chlorophyll concentrations.
The analysis of all images for 2009 (CHLOC5 maps) allowed to divide the Gulf of Gabes into 3 different areas. At the center of the study area (C), TU and CHL derived from MODIS and in situ measurements show a good correlation. The second area was around the Port of Gannouch near the point of discharge (and where various effects from surface waste were observed from airborne imagery). The third area, is located around the Gulf islands where high CHLOC5 were recorded. These overestimates with an algorithm dedicated to coastal waters are possibly due to the tide, irregular depth and bottom reflection.
CHL OC5 maps described a high variability of chlorophyll distribution over the year, with a maximum during the bloom season (September). This is in accordance with recent in situ phytoplankton analyses showing that first blooms develop at the center of the gulf (July), and later (August- September) at the north of Jerba island, with different phyto-plankton groups involved (Feki et al., 2008 and Bel Hassan et al., 2008, 2009).
This work showed that it is crucial to calibrate and adjust CHL algorithms to avoid overestimating ocean color data by satellite. Therefore, it will be necessary to measure water leaving reflectance and associated TU and CHL measure-ments, especially in coastal areas and around the Gulf islands. The next step will be to correct the imagery from bathymetric effects and to analyze the inter-annual variability from the MODIS satellite series, by using this future optical data set.
Acknowledgments
This study was funded by the Unit of Structure and Geologic Model of the University of Sciences of Tunisia. The authors would like to acknowledge the NASA ocean colors product distribution teams at The Goddard Space Flight Center GSFC for the distribution of MODIS products. We would also like to thank Jérome Lefèvre for the
MODIS-0 2 4 6 8 10 12 14 16 G3 G11 G12 K6 K3 K1 G9 G14 J2 J4 Boug rara K4 K6 K10 K8 K11 Stations CHL A ( m g .m -3 ) MODIS-OC3 MODIS-OC5 in situ CHL
July
October
270│Chlorophyll and turbidity concentrations
© Revue Télédétection, 2012, vol. 11, no 1
Data basis, Marc Despinoy at the Center IRD of Nouméa, New Caledonia, and Guillaume Wattelez for their help within the framework of the IRD/French “Validation HYperspectral SATellite data” project, Programme National de Télédé-tection Spatiale, The remote sensing team of MUMM are thanked for the help provided with the processing IDL of MODIS imagery.
References
Babin, M., Stramski, D., Ferrari, G.M., Claustre, H., Bricaud, A. and Obolenski, G. (2003) Variations in the light absorption coeffi-cients of phytoplankton, non-algal particles, and dissolved organic matter in coastal waters around Europe, J. Geophys. Res., vol. 108, 10.1029/2001JC000882.
Barale, V., Jaquet, J.M. and Ndiaye, M. (2008) Algal Blooms in the Mediterranean Sea: a Retrospective Analysis Comparing the CZCS and SeaWiFS Historical Records, Remote Sensing of Environment, vol. 112, pp. 3300–3313.
Ben Mustapha, K., Hattour, A., Mhetli, M., El Abed, A. and Tritar, B. (1999) Bionomie des étages Infra et Circalittoral du golfe de Gabes, Bull. Inst. Natn. Scienc. Tech. Mer., vol. 26, no. 2, pp. 5-48.
Bjaoui, B., Rais, S. and Koutitonsky, V. (2004) Modélisation de la dispersion du phosphogypse dans le golfe de Gabès, Bull. Inst. Natn. Scienc. Tech. Mer (Tunisie), vol. 31, pp. 103-109.
Bel Hassen, M., Drira, Z., Hamza, A., Ayadi, H., Akrout, F. and Issaoui, H. (2008) Summer phytoplankton pigments and community composition related to water mass properties in the Gulf of Gabes. Estuarine, Coastal and Shelf Science, vol. 77, pp. 645–656. Bel Hassen, M, Drira, Z., Hamza, A., Ayadi, H., Akrout, F. Messaoudi, S., Issaoui, H., Aleya, L. and Bouaïn, A.(2009)
Phytoplank-ton dynamics related to water mass properties in the Gulf of Gabes: Ecological implications Journal of Marine Systems, vol. 75, pp. 216–226.
Burollet, P. F., Clairefond, P. and Winnock, E. (1979) La mer Pélagienne (étude sédimentologique et écologique du plateau tunisien et du golfe de Gabes, Géol. méditerranéenne, Ann. Univ. Provence, vol. 6, no. 1, pp. 1-345.
Curran, P.J., Hansom, J.D., Plummer, S.E. and Pedley, I. (1987) Multispectral remote sensing of near shore suspended sediments: a pilot study, International Journal of Remote Sensing, vol. 8, no. 1, pp. 103−112 .
Carder, K. L., Hawes, D. K., Baker, K. A., Smith, R. C., Steward, R. G. and Mitchell, B. G. (1991) Reflectance model for quantifying chlorophyll a in the presence of productivity degradation products, Journal of Geophysical Research, vol. 96, pp. 20599–20611. Deschamps, P. Y. and Viollier, M. (1987) Algorithms for ocean colour from space and application to CZCS data. Advances Space
Research, vol. 7, no. 2, pp. 11-19 .
Doxaran, D., Froidefond, J. M. , Lavender, S.J. and Castaing, P. (2002) Spectral signature of highly turbid waters. Application with SPOT data to quantify suspended particulate matter, Remote Sensing of Environnement, vol. 81, pp. 149-161.
Dupouy, C., Neveux, J., Dirberg, G., Röttgers, R., Tenório,M. M. B., and S. Ouillon, 2008. Bio-optical properties of the marine cyanobacteria Trichodesmium spp., Journal of Applied Remote Sensing, vol. 2, pp. 1-17. doi:10.1117/1.2839036.
Dupouy, C., Neveux, J.,Ouillon, S., Frouin, R., Murakami, H., Hochard, S. and Dirberg, G. (2010) Inherent optical properties and satellite retrieval of chlorophyll concentration in the lagoon and open ocean waters of New Caledonia, Marine Pollution Bul-letin, vol. 61, pp. 503-518.
Feki W., Hamza A., Bel Hassen M. et Rebai A. (2008) Les efflorescences phytoplanctoniques dans le golfe de Gabès (Tunisie) au cours de dix ans de surveillance (1995-2005) Bull. Inst. Natn. Scien. Tech. Mer de Salammbô, vol. 35, pp. 105-116.
Gohin, F., Druon, J.-N. and Lampert, L. (2002) A five channel chlorophyll algorithm applied to SeaWifs data processed by SeaDas in coastal waters, International journal of remote sensing, vol. 23, pp. 1639-1661.
Gordon, H.R., Brown, O.B., Evans, R.H., Brown, J.W., Smith, R.C. Baker, K.S. and Clark, D.K. (1988) A semi-analytic radiance model of ocean color, J. Geophys. Res., vol. 93, no. 9, pp. 10909–10924.
Gordon H. et Morel A. (1983) Remote Assessment of Ocean Color for Interpretation of Satellite Visible Imagery: A Review. Lecture Notes on Coastal and Estuarine Studies, vol. 4, Springer Verlag, New York.
Gitelson, A., Karnieli, N., Goldman, Y., Yacobi, Z. and Mayo, M. (1996) Chlorophyll estimation in the Southeastern Mediterranean using CZCS images: adaptation of an algorithm and its validation, J. Mar. Sys., vol. 9, pp. 283-290.
Jaquet, J. M. Tassan, S. Barale, V. and Sarbaji, M. (1999) Bathymetric and bottom effects on CZCS chlorophyll-like pigment estimation: data from the Kerkennah shelf (Tunisia), International Journal of Remote Sensing, vol. 20, no.7, pp. 1343−1362.
Katlane, R., Nechad, B., Ruddick, K.J. and Zargouni, F. (2011) Optical remote sensing of turbidity and total suspended matter in the Gulf of Gabes, Arab J Geosci., DOI 10.1007/s12517-011-0438-9.
Maritorena, S., Siegel, D.A. and Peterson, A.R. (2002) Optimization of a semi-analytical ocean color model for global-scale applica-tions, Appl. Opt., vol. 41, pp. 2705–2714.
Morel, A. and Prieur, L. (1977) Analysis of variations in ocean color, Limnol. Oceanogr., vol. 22, no. 4, pp. 709-722.
Nechad, B. , Ruddick, K.G. and Neukermans, G. (2009) Calibration and validation of a generic multisensor algorithm for mapping of turbidity in coastal waters in Remote Sensing of the Ocean, Sea Ice, and Large Water Regions, Proc. SPIE, 7473.
Nechad, B. Ruddick, K.G. and Park, Y. (2010) Calibration and validation of a generic multisensor algorithm for mapping of total suspended matter in turbid waters, Remote Sensing of Environment, vol. 114, pp. 854–866.
O’Reilly, J.E. and (21 authors) (2000) Ocean color chlorophyll a algorithms for SeaWiFS, OC2, and OC4: SeaWiFS Postlaunch Technical Report Series, vol.11. SeaWiFS postlaunch calibration and validation analyses" version 4. In S. B. Hooker, & E. R. Firestone (Eds.), part 3 Greenbelt, MD: NASA Goddard Space Flight Center, pp. 9–23.
o
O’Reilly, J.E., Maritorena, S., Mitchell, B.G., Siegel, D.A., Carder, K.L., Garver, S.A., Kahru, M. and McClain, C. (1998) Ocean color chlorophyll algorithms for SeaWiFS, J. Geophys. Res., vol.103, pp. 24937–24953.
Ouillon, S., Douillet, P., Petrenko, A., Neveux, J.,Dupouy, C. Froidefond, J.M., Andréfouët, S. and Muñoz-Caravaca, A. (2008) Optical algorithms at satellite wavelengths for Total Suspended Matter in tropical coastal waters, Sensors, vol. 8, pp. 4165-4185 . Sammari, C., Koutitonsky, V.G. and Moussa, M. (2006) Sea level variability and tidal resonance in the Gulf of Gabes, Tunisia,
Continental Shelf Research, vol. 26, pp. 338–350.
Sogreah, (2002) Protection des ressources marines et côtières du Golfe de Gabes, Sogreah, Tunisie phase préparatoire du projet GEF/WB TF 022968, Rapport de phase 1: Diagnostic, pp. 229 (French bibliography).
Tilstone, G. (2002) Moore, REVAMP Regional Validation of MERIS Chlorophyll products in North Sea coastal waters, eds 2002, Protocols document.