HAL Id: insu-02289697
https://hal-insu.archives-ouvertes.fr/insu-02289697
Submitted on 16 Nov 2019
HAL is a multi-disciplinary open access
archive for the deposit and dissemination of
sci-entific research documents, whether they are
pub-lished or not. The documents may come from
teaching and research institutions in France or
abroad, or from public or private research centers.
L’archive ouverte pluridisciplinaire HAL, est
destinée au dépôt et à la diffusion de documents
scientifiques de niveau recherche, publiés ou non,
émanant des établissements d’enseignement et de
recherche français ou étrangers, des laboratoires
publics ou privés.
Sugar, Gravel, Fish, and Flowers: Mesoscale cloud
patterns in the Tradewinds
Bjorn Stevens, Sandrine Bony, Hélène Brogniez, Laureline Hentgen, Cathy
Hohenegger, Christoph Kiemle, Tristan l’Ecuyer, Ann Kristin Naumann,
Hauke Schulz, Pier Siebesma, et al.
To cite this version:
Bjorn Stevens, Sandrine Bony, Hélène Brogniez, Laureline Hentgen, Cathy Hohenegger, et al.. Sugar,
Gravel, Fish, and Flowers: Mesoscale cloud patterns in the Tradewinds. Quarterly Journal of the
Royal Meteorological Society, Wiley, 2020, 146 (726), pp.141-152. �10.1002/qj.3662�. �insu-02289697�
Sugar, Gravel, Fish, and Flowers:
Mesoscale cloud patterns in the Tradewinds
Bjorn Stevens,
a∗Sandrine Bony
b, H´el`ene Brogniez
c, Laureline Hentgen
d, Cathy Hohenegger
a,
Christoph Kiemle
e, Tristan S. L’Ecuyer
f, Ann Kristin Naumann
a, Hauke Schulz
a, Pier A. Siebesma
g,
Jessica Vial
b, Dave M. Winker
h, and Paquita Zuidema
iaMax Planck Institute for Meteorology, Hamburg, Germany bSorbonne Universit´e, LMD/IPSL, CNRS, Paris, France
cLATMOS/IPSL, UVSQ L’Universit´e Paris-Saclay, Sorbonne Universit´e, CNRS, Guyancourt, France dInstitute for Atmospheric and Climate Science, ETH Zurich, 8092 Z¨urich, Switzerland
eDeutsches Zentrum f¨ur Luft- und Raumfahrt, Institute of Atmospheric Physics, Oberpfaffenhofen, Germany fUniversity of Wisconsin-Madison, Madison, Wisconsin
gDelft University of Technology, Delft, The Netherlands hNASA/Langley Research Center, Hampton, VA, USA
iRosenstiel School of Marine and Atmospheric Science, University of Miami, Miami, FL 33149, USA
∗Correspondence to: Max-Planck-Institut f¨ur Meteorologie, Bundesstraße. 53, 20146 Hamburg, Germany
An activity designed to characterise patterns of mesoscale (20 km to 2000 km)
organisation of shallow clouds in the downstream trades is described. Patterns of
mesoscale organisation observed from space were subjectively defined and learned by
twelve trained scientists. The ability of individuals to communicate, learn and replicate
the classification was evaluated. Nine-hundred satellite images spanning the area from
48
◦W to 58
◦W 10
◦N to 20
◦N for the Boreal winter months (Dec-Feb) over ten years
(2007/2008 to 2016/2017) were classified. Each scene was independently labeled by six
scientists as being dominated by one of six patterns (one of which was ’no-pattern’).
Four patterns of mesoscale organisation could be labelled in a reproducible manner,
and were labelled Sugar, Gravel, Fish, and Flowers. Sugar consists of small, low clouds
of low reflectivity, Gravel clouds form along apparent gust fronts, Fish are skeletal
network (often fishbone-like) of clouds, while Flowers are circular clumped features
defined more by their stratiform cloud elements. Both Fish and Flowers are surrounded
by large areas of clear air. These four named-patterns were identified 40 % of the time,
with the most common pattern being Gravel. Sugar was identified the least and suggests
that unorganised and very shallow convection is unlikely to dominate large areas of
the downstream Tradewinds. Some of the patterns show signs of seasonal and
inter-annual variability, and some degree of scale selectivity. Comparison of typical patterns
with radar imagery suggests that even this subjective and qualitative visual inspection
of imagery appears to capture several important physical differences between shallow
cloud regimes, such as precipitation and radiative effects.
Key Words: Shallow Convection, Mesoscale Organisation, Cloud Feedbacks, Trade Clouds
1. Introduction A German proverb reads:
Wenn Sch¨afchenwolken am Himmel steh’n, kann man ohne Schirm spazieren geh’n.
Loosely, and lyrically, it translates as “when cute woolly clouds make the weather, no need to walk with your umbrella.” It demonstrates how particular cloud forms have long been taken as indicative of weather and its pending changes.
Ground-based observers have historically classified individual cloud types – Sch¨afchenwolken in the above proverb – to help anticipate the weather. With the advent of the telegraph, systematic surface-based observations of clouds could be communicated over great distances, thereby giving a sense of the synoptic situation. This idea motivated the first “Wolken-Atlas” or cloud atlas, developed around Abercromby and Hildebrandsson’s ten basic cloud types. The Atlas was published in Hamburg in 1890, and served as a template for a standardised activity
This article is protected by copyright. All rights reserved.
Accepted
Article
This article has been accepted for publication and undergone full peer review but has not
been through the copyediting, typesetting, pagination and proofreading process, which
may lead to differences between this version and the Version of Record. Please cite this
article as doi: 10.1002/
qj.3662
implemented through an international accord adopted in Paris in 1896 (Hilderbrandsson and Teisserenc de Bort 1910), later celebrated as ”the international year of the cloud” (Stephens 2003). This Paris accord, and subsequent coordination by the World Meteorological Organisation (WMO), has helped establish cloud classification as a basic element of more than a century of systematic human weather observations. These days, instruments are replacing human cloud observers and climate change – not changing weather – motivates efforts to read order into clouds.
Modern satellite-derived cloud classification schemes empha-sise radiative properties derived from a field of clouds, rather than the impression left by an individual cloud. A famous example is the International Satellite Cloud Climatology Project (Rossow and Schiffer 1999). In this scheme, fields of clouds are classified by their net effect on solar and infrared radiation, which are respec-tively indicative of their average thickness, and their average height of their tops. But even such properties-driven classifications of fields of clouds are guided by, and interpreted in terms of basic cloud types which are not too different from the ten types defined by Abercromby and Hildebrandsson nearly 150 years ago.
Satellite imagery shows that the form of clouds is not just expressed in an individual cloud, but often through the very different spatial patterns built up from individually quite similar clouds, or in some cases regular sequences of changing cloud forms. Examples of the former encompass familiar patterns, e.g., elongated wind parallel cloud streets, networks of open/closed cells, or even crosswind bands (Agee 1987; Atkinson and Zhang 1996; Kristovich et al. 2002; Stevens et al. 2005; Wood and Hartmann 2006). Examples of the latter include the progressive changes associated with large-scale mid-latitude frontal features. Many of these patterns are clear and unambiguous, lending themselves well to objective identification techniques, and have motivated research over decades to understand the parameters that order them (e.g., Muhlbauer et al. 2014; Painemal et al. 2010). But other patterns are less clear, so much so that whether or not one can rightfully identify regularity in cloud-patterning is a question onto itself.
To answer this question, the present authors∗ formed a study group to explore whether they could identify common patterns in the satellite presentation of shallow convection in the trades. A motivation for this activity was an appreciation of the important role the organisation of deep convection plays in regulating radiative heat-loss to space (Tobin et al. 2012), and hence an emerging curiosity as to whether similar processes were occurring in shallow convection. A further motivation was to help prepare for a forthcoming field programme (Bony et al. 2017): if patterns of organisation exist for shallow convection, then their appearance might influence how one organises the measurement campaign. These general motivations gave rise to more specific questions. First, do different people recognise common patterns in satellite images of clouds in the trades? And if so, can these patterns be described, classified and communicated to train other individuals to identify them? Secondly, if humans can consistently identify patterns of cloudiness, can objective measures of these patterns be discerned, and/or can machines be taught to recognise such patterns as well? Ultimately this exercise aims to answer the question as to whether information about differences in patterns of shallow convection in the Tradewinds can be used to advance understanding of cloud controlling processes and their role in climate. This manuscript addresses the first question and sets the foundation for ongoing work, and future manuscripts, on the subsequent questions.
∗With the exception of H Schulz, who joined the project later.
2. Getting started – the Classification Procedure
Interest in the mesoscale organisation of clouds focused on the downstream North Atlantic Trades. We chose a region windward of Barbados (i.e., east of 13◦N,59◦W), during the months of Boreal winter. The region and season were of interest because they are characterised by regimes of ‘small’ clouds associated with ‘big’ questions. Questions like: what sets Earth’s equilibrium climate sensitivity? and how sensitive are clouds to aerosol perturbations? (Vial et al. 2013; Brient et al. 2015; Albrecht 1989; Seifert et al. 2015). It is for these same reasons that the region has become a focal point for long-term ground-based observations through the Barbados Cloud Observatory (Stevens et al. 2016) as well as more elaborate past (Stevens et al. 2019) and planned (Bony et al. 2017) field studies windward of this observatory. The emphasis on the mesoscale – to be precise, on what Orlanski (1975) calls the meso-β(20km to200km) and to a lesser extent the meso-α (200km to2000km) scale – is because patterns of organisation on these scales are often not a part of the discourse on the ‘big’ questions.
The idea to investigate patterns of mesoscale organisation in the context of these activities was made possible by NASA’s Worldview†. The ability to easily browse very high-resolution images made it conceivable to look for patterns in the pictures. With this in mind a subgroup, consisting of a few of the authors, spent part of a morning independently browsing the Worldview visible images from MODIS near and upwind (roughly East-North-East) of Barbados. The idea being to see if a dominant spatial pattern could be identified among images, and if so how often it occurred. The images spanned10◦ in latitude and
20◦ in longitude. After spending time individually looking for patterns, the members of the subgroup met together to discuss their individual impressions with one another. The discussion quickly led to the conclusion that different people often identified the recurrence of similar patterns. After some further discussion the subgroup concluded that when recurrent patterns could be identified, they took on one of at least four patterns. These we gave the names of Sugar, Gravel, Fish, and Flowers. A fifth pattern, Bands, was also identified by the subgroup. It was associated with large-scale bands of completely overcast sky. An example is given in the appendix (Fig. 10). But because it ended up being infrequently and inconsistently classified by the broader group, our analysis focuses only on the four robustly identifiable patterns: Sugar, Gravel, Fish, and Flowers.
2.1. Definitions
A concise description of the four patterns that we felt confident in our ability to classify is as follows:
Sugar: Dusting of very fine scale clouds with small vertical extension and little evidence of self-organisation (by cold-pools or gust fronts).
Gravel: Cloud fields patterned along meso-β(20km to100km) lines or arcs defining cells with intermediate granularity, and brighter cloud elements (as compared to Sugar), but with little evidence of accompanying stratiform cloud veils. Fish: Meso-αscale (200km to2000km) skeletal networks (often fishbone-like) of clouds separated from each other, or from other cloud forms, by well defined cloud free areas and sometimes accompanied by a stratiform cloud shield. Flowers: Irregularly shaped meso-β scale (20km to200km)
stratiform cloud features, often with higher reflectivity †https://worldview.earthdata.nasa.gov
This article is protected by copyright. All rights reserved.
Accepted
Figure 1. Sugar: MODIS-Aqua scenes from Worldview. The images cover the area from60◦W to48◦W and10◦N to20◦N. For these images the scenes have been extended to the west to include Barbados, coloured in artificial green, on the far left. For a sense of scale Barbados fits in a rectangle of east-west dimension of25km and north-south dimension of30km. Depending on the quality of the reproduction, some features distinguishing these from other patterns may be difficult to discern from printed (rather than electronic) renditions of this manuscript. From left to right the images correspond to 31 December 2014, 5 December 2015, and 20 January 2016.
Figure 2. Gravel: MODIS-Aqua scenes as in Fig. 1. From left to right the images correspond to 2 December 2009, 14 January 2009 and 12 December 2015.
cores, and appearing in quasi-regular spaced bunches (hence the plural) with individual features well separated from one another by regions devoid of clouds.
These are illustrated by images (Fig. 1-4) from scenes that, through the broader classification activity described below (§2.2), were unanimously identified with a particular pattern.‡
Sugar was so named because when it occurred the clouds looked like a sprinkling of powder sugar. In Fig. 1 this is exemplified by the cloud patterns the upper-left quadrant (partly masked by the gap in satellite coverage) of the left (31 Dec 2014) panel, and in the right half of the right (20 Jan 2016) panel. The granulation in the reflectivity field of Sugar is quite fine, with relatively little clumping, other than what one might expect to occur randomly. Hence the clouds were not too reflective (or bright) which was interpreted as them lacking vertical extent. Another notable feature of Sugar was the absence of large-scale areas completely devoid of clouds. Ideally Sugar had no organisation, but often what we would call Sugar might be patterned by the large-scale flow into streets or even feather-like forms.
Gravel differed from Sugar through a larger granularity of the patterns defined by the clouds as well as a greater brightness contrast (Fig. 2). More notably, Gravel clouds organised along lines or arcs thought to be associated with gust-fronts accompanying cold pools (i.e., precipitation sourced density currents Zuidema et al. 2012). New cells often could be seen to form at the points where gust-fronts collided, with brighter, presumably deeper, clouds demarcating these regions. In some cases Gravel exhibited structures reminiscent of open mesoscale cellular convection, for instance in the lower third of the image ‡For print, rather than electronic, versions of images some features may be difficult to discern.
from 14 Jan 2009 (central panel, Fig. 2). Gravel and Sugar are identified with some degree of preconception: Gravel with cold pools (Zuidema et al. 2012); Sugar with non-precipitating shallow convection. Past modelling (e.g., Siebesma et al. 2003) and observational campaigns (BOMEX Nitta and Esbensen 1974) studies have helped establish Sugar as the canonical Tradewind cloud in the mind of many researchers.
Fish also appears to be built up from open-cells or convective cells organised around apparent gust-fronts in ways that outline a skeletal structure similar to that of a fish. But compared to Gravel the clouds are yet brighter, and encapsulated in a larger
meso-αscale envelope (200km to2000km), often with some amount of associated stratiform cloud cover. In Fig. 3 one such structure stretches across the 12◦ of longitude on the bottom of the left panel; another stretches across the full image of the right panel, from the north-west to the south-east corner. This meso-αscale patterning of the cell-complexes is brought into relief by the degree to which the areas between the ’Fish’ is devoid of clouds – in marked contrast to Gravel.
Flowers were the most surprising and most distinct pattern of organisation. They are comprised of meso-β scale patches of stratiform clouds, often with evidence of central clusters embedded and supporting the stratiform cloud patches (Fig. 4). The scale of an individual Flower (or stratiform patch) in the pattern ‘Flowers’ varies from a few tens to a few hundred of kilometres. Our classification focused on situations where they appeared in bunches, i.e., with a quasi-regular distribution wherein individual Flowers were separated from one another by similarly scaled regions devoid of clouds.
2.2. Assigning labels
Based on these perceived patterns the subgroup developed a labelling protocol which was used to train the rest of the group
This article is protected by copyright. All rights reserved.
Accepted
Figure 3. Fish: MODIS-Aqua scenes as in Fig. 1. From left to right the images correspond to 30 January 2009, 16 January 2009 and 1 February 2013.
Figure 4. Flowers: MODIS-Aqua scenes as in Fig. 1. From left to right the images correspond to 7 January 2010, 14 February 2010 and 9 February 2017.
of twelve labellers. Here we define labelling as the act of an individual, a labeller, attaching a label to an image. Classification is what emerges out of the labelling activity, for instance as a result of independent labellers attaching the same label to an image. Because of the way the images were set up it was only possible to label an image as a whole, and having a large (20◦× 10◦) domain increased the chances that different patterns of shallow-cloud organisation would appear in different parts of the domain. This is already evident, for instance in Fig. 2b, where in the western portion of the image, near and north of Barbados, clouds have a more Sugar-like texture, or in Fig. 1a where a Fish is visible in the bottom right quadrant. In the group classification that followed, it was therefore decided to work with smaller10◦× 10◦images. For these the south-western corner of the domain was placed at
58◦W and10◦N, upwind of Barbados. In adjusting the size of the scene we may have inadvertently made it less likely for Bands to be identified.
The five perceived patterns (including ‘Bands’) were presented to the full group of twelve labellers (the authors) by the subgroup. Each pattern was described and presented in the form of a few examples, similar to those shown in Figs 1- 4. Then, together, the group scrolled through a season (December, January, February; DJF) of Worldview images. As if learning how to play a card game with an open hand, individuals were asked in turn to label an image and when the other participants did not agree, reasons for differences were discussed. After the training each person was asked to label five years of images, for the specified study region, during the months of December, January and February, within a period of ten seasons starting in 2007/2008 and concluding in 2016/2017. These years were chosen as they were the only ones available on Worldview at the time of the labelling activity. Each season ran from 1 December until 28 February, thus excluding Feb 29 in 2008, 2012 and 2016, and totalling ten seasons (900 days). Each person assigned labels to five seasons of images, so that each image was independently assigned a label by six different people. The classification was performed only on daytime MODIS-Aqua
images (corresponding to roughly 1330 local time at the centre of the image) using the ’Corrected reflectance’ product, which corresponds to the MODIS Level 1B data (a combination of data at different wavelengths, derived from sensors having a250m or
500m resolution), corrected for gross atmospheric effects. When either of Sugar, Gravel, Fish, or Flowers covered half or more of the image, the image was classified as such.
3. Results 3.1. Label Statistics N 3 4 5 6 Actual 0.58 0.37 0.20 0.08 Random(p = 1/6) 0.37 0.052 0.004 0.00013 Random(p = 1/4) 0.68 0.15 0.019 0.00098
Table 1. Fraction of 815 ’classifiable’ images for which k or more labellers were in agreement, and the probability p, of this happening if labels were randomly assigned with equal likelihood. Two limiting cases are considered: when a classifier randomly assigns one of six (p = 1/6) or one of four (p = 1/4) possible labels.
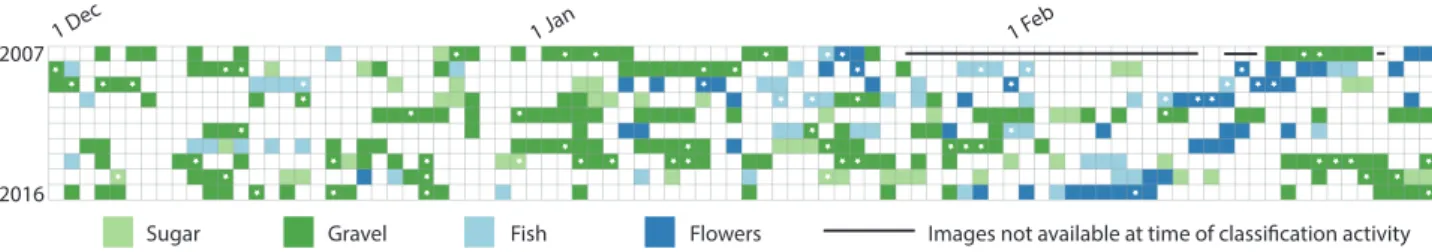
Of the 900 images, 815 were classified by at least one person as being dominated by one of the four patterns: Sugar, Gravel, Fish, or Flowers. Thus we consider these 815 days as classifiable days. Of the 85 images that were not classified by any person, many of these were the result of conditions overcast by high clouds, or simply missing images. For instance, at the time the labels were assigned, images were not available for the period between 25 Jan through 13 Feb 2008, nor for the 15-17 and 25 Feb 2008, a total of 24 days.
Given the probabilitypthat a particular label will be assigned, then the probability that this label will be assigned exactlyktimes
This article is protected by copyright. All rights reserved.
Accepted
2007
2016
1 Dec 1 Jan 1 Feb
Sugar Gravel Fish Flowers Images not available at time of classification activity
Figure 5. Color coded identification of Sugar, Gravel, Fish, or Flowers based on the agreement of four or more labels. Days with a white star are unanimously (6/6) labeled. inntrials is, Pr(k; n, p) = n k ! pk(1 − p)n−k (1)
From this it follows that the probability for one of the four (Sugar, Gravel, Fish, Flowers) labels to appearkor more times givenn
assignments is 4 n X i=k Pr(i; n, p). (2)
In our case,n = 6denotes the number of labelers. Table 1 shows how often images were labeled identically bykor more people, and compares this to the fraction of images one would expect to be classified consistently from Eq. (2) for given a values ofp.The actual frequency of agreement greatly exceeds what is expected from randomly guessing one of the six labels (p = 1/6). Because the Band pattern was identified rarely, and further assuming that there was a bias toward choosing some labels (i.e., tendency to choose one of the four named labels as opposed to ’No Pattern’), then a more stringent measure of chance agreement would be to assume that any given pattern is chosen with a probability of
p = 1/4.Even for this scenario, patterns were robustly classified,
with four (the smallest number denoting a majority) labellers agreeing nearly three times as often as would be expected by chance.
All patterns were not equally likely to dominate the10◦× 10◦
classification area (see Fig. 5, and Table 2). The Gravel label was assigned to images three times more often than the other labels. It dominated even more if unanimity was required for a pattern to qualify as classified. Surprisingly, Sugar, which was interpreted as shallow convective clouds, with little signature of self-organisation, occurred the least (Fig. 5). If we consider the two labels ‘No Pattern’ and Sugar as the labels corresponding to an absence of internal organisation, then for more than a third of the scenes (35%) a 10◦× 10◦ scene was classified (four or more labels in agreement) as being dominated by some form of mesoscale self-organisation, i.e., Gravel, Flowers or Fish.
N Sugar Gravel Fish Flowers
4 0.056 0.226 0.063 0.060
6 0.005 0.059 0.010 0.013
Table 2. Fraction of all classifiable (815) images where N or more labels were the same. The sum of the fractions in each row corresponds to the associated values of 0.4 and 0.08 in Table 1.
3.2. Pattern Variability
Considerable inter-annual variability was apparent among the patterns. This is illustrated, for instance, by the variability in Flowers among years in Fig. 5. To better quantify this variability we consider a classified image as one where four-or-more out
of six people agreed on its label. The number of classifications, and their breakdown by year and category is presented in Fig. 6. Gravel dominates most seasons, but Gravel days varied considerably, from only five days in 2009 to 34 in 2014. In 2016 no Sugar was identified, in 2011 no Fish was found, and in both 2011 and 2014 Flowers failed to bloom. And though Gravel dominated most years, it did not dominate all years. In 2009, for instance, Flowers were the dominant pattern with almost twice as many scenes (9) identified as were for Gravel, whereas in 2014 Sugar, with 14 classifications, was the most dominant pattern.
Because not everyone labeled images from every year, if individual labellers were biased this could bias the degree of inter-annual variation of the classification. In Table 3 the statistics for each person (labeller) involved in the classification are presented, along with the years they labeled. Despite considerable differences among individuals and the fact that they classified different years, Gravel was the most classified type for each individual, and for nine of the twelve, Flowers was the least frequent. There is the temptation to see a professional bias: P. Zuidema, who has written extensively about marine cold pools (Zuidema et al. 2012), was relatively more successful in identifying Gravel, while P. Siebesma who re-introduced BOMEX to the community (Siebesma et al. 2003), in the form of their randomly distributed non-precipitating Cumulus Humilis, appeared to have willed away the precipitation, often seeing Sugar where others saw Gravel. On the other hand, S. Bony, who first brought Flowers to our attention, did not seem predisposed to see a disproportionate number of bouquets. These differences among labellers could be partly responsible for the apparent inter-annual variability in classifications. Then again, real inter-inter-annual variability would also lead to apparent differences among the labellers. Which explanation is correct is difficult to establish from the available data.
Classifier Sugar Gravel Fish Flowers Years
S. Bony 37 184 34 28 1010100101 H. Brogniez 58 143 34 55 1110000011 T. L’Ecuyer 82 121 45 33 1100101010 L. Hentgen 25 137 80 33 0010111001 C. Hohenegger 48 108 71 48 0111000101 C. Kiemle 43 109 89 33 1111000100 AK. Naumann 27 183 27 24 0000111101 P. Siebesma 67 75 72 53 0101010011 J. Vial 63 90 39 25 1010011010 D. Winker 78 108 71 32 0101101010 B. Stevens 60 147 49 36 1001010110 P. Zuidema 31 209 47 36 0001111100
Table 3. Number of labels assigned by each classifier. The years in which a person labelled images are also indicated, using a binary identifier corresponding to years 2007 to 2016 (left to right), so for instance P. Zuidema classified images for years 2010, 2011, 2012, 2013 and 2014. As each person classified five years, the maximum number of scenes that each person could label was 450.
For most of the patterns there is not a strong signature of intra-seasonal variability. Flowers are the exception that proves the rule.
This article is protected by copyright. All rights reserved.
Accepted
Of the forty-nine scenes classified as Flowers (by virtue of the agreement of at least two thirds, four or more, of the labellers) only one of these occurred in December, and that near the end of the month on 21 December 2015 (Fig. 5). Moreover, Flowers was twice as likely to be identified in February as compared to January. This concentration is also consistent with the sense that Flowers were persistent: when they formed they stayed. Only in six instances were Flowers separated from other Flowers or from Fish – the most closely related of the other patterns – by more than two days. And in one twelve day period starting at the end of January 2017 (i.e., in the 2016 season), Flowers were identified on eight out of twelve days, whereas in mid February 2011 (in the 2010 Season) Flowers were identified on four consecutive days. This suggests that the patterning, particularly that which leads to Flowers, is more influenced by the large-scale synoptic situations, than the random internal dynamics of cloud-scale circulations – as the latter would be expected to have less day-to-day coherence.
2007 2008 2009 2010 2011 2012 2013 2014 2015 2016 0 25 50
Sugar Gravel Fish Flower
Figure 6. Annual identifications of Sugar, Gravel, Fish, or Flowers based on the agreement of four or more labels.
3.3. Pattern Similarity
Sugar Gravel
Fish Flower
Figure 7. Similarity among patterns as measured by the likelihood of a discordant label, for the subset of images with only one different label. The arrow points from the classified pattern to the discordant pattern, and its width indicates the frequency with which the discordant pattern arose. Only the two most likely choices for the discordant label are shown, i.e., if the sixth labeller disagreed with the other five people who labeled an image as Gravel, then this person was most likely to have chosen Sugar, less likely to indicate Fish and not at all likely to have chosen Flowers.
Ideally one would like to know to what extent one pattern is clearly distinguishable from another. Looking at the patterns in Figs. 1-4, and the pattern succession in Fig. 5, suggests that some quantitative measure of the similarity between one pattern and another may differ depending on which patterns one compares.
At a glance, Flowers appears more closely related to Fish than Sugar, and Gravel more closely related to Sugar than Flowers. To further address this question, we investigated all instances when an image was given the same label by all but one individual – as in this case the label that is in disagreement is unambiguous. Sixty-two instances were identified when a scene was given five Gravel labels. Of these, in more than half the instances (33) the sixth label was Sugar. On only eight occasions was the sixth label a Fish, and not once was it a Flowers. The rest of the time ‘No Pattern’ was assigned. Likewise, of the nineteen instances where five Flowers labels were assigned, the sixth label was Fish on seven instances, Gravel on three instances, and ‘No Pattern’ on ten instances. There seemed to be no tendency of people finding Sugar among Flowers. Conversely, and consistently, of the eighteen instances when a scene was given five Sugar labels, on only one occasion was the sixth label Flowers. The connectivity, or similarity among patterns is summarised by Fig. 7, which shows how likely a discordant label, for an image where five labels agree, is to be another label. Hence this analysis fails to refute the hypothesis that Sugar and Gravel are in some-sense closer (or more similar) to one another than Flowers and Sugar.
4. Discussion 4.1. Structure
Riehl, a pioneer in studies of tropical meteorology, pointed out long ago that there are many different types of clouds in the Trades. Fig. 8 reproduces an illustration from his book (Riehl 1954), which identifies these different forms. The schematic gives the impression that Tradewind clouds consisted mostly of different forms of cumulus clouds, which differed principally in their vertical extent. The figure gives no hint of the spatial patterning of the clouds, and how this might be related to cloud vertical extent. Precipitation is hardly shown, and even when it does occur it doesn’t even reach the surface. There is no sign of cold-pools or gust-fronts, nor that stratiform layers can sometimes develop at the top of shallow clouds. The articulation of this spatial patterning needed to wait for the advent of spatial overviews made possible by high-flying aircraft, and later satellites and radars. But even so these ideas have been slow to develop. The idea that cold-pools played an important role in the organisation of clouds in the Tradewinds really only coming into focus as a result of the relatively recent, Rain in Cumulus Over the Ocean Field, field study (RICO Rauber et al. 2007).
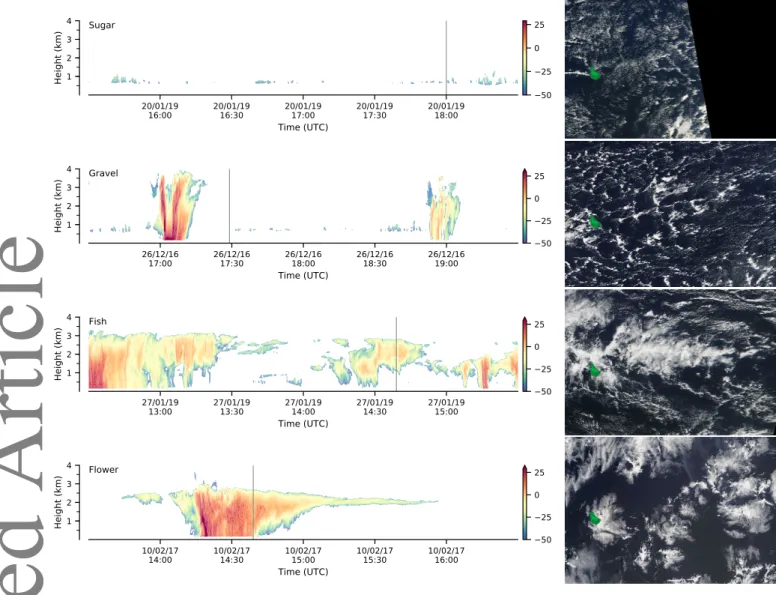
The importance of precipitation, the way in which cloud deepen, and the nature of the stratiform cloud layers classified as Sugar, Gravel, Fish and Flowers can be evaluated by examining radar time-height cross sections associated with these patterns. For this purpose we use measurements from a high-sensitivity (Ka band) cloud radar at the Barbados Cloud Observatory. Satellite images (MODIS) were used to identify times representative of the different patterns and a radar cross-section for that time is provided to accompany the image (Fig. 9). As anticipated, Sugar is constituted of clouds of little vertical development, mostly Cumulus Humilis, but also the odd Chimney cloud (even if one is not apparent on this radar cross section). Gravel has substantially more vertical development – but how much depends on the day. It, or at least clouds associated with gust-fronts and cold pools, are also clearly associated with precipitation. Fish also precipitate, but are additionally associated with more organisation, and often deeper (with tops from3km to4km) clouds, and may be variants on what ? call Actinoform clouds. Flowers in contrast is composed of Cumulus, some of which precipitates, not unlike Gravel, but with a stratiform veil. Similar clouds were frequently observed during NARVAL1 and during the Cloud System Evolution in the Trades (CSET) field study (Albrecht et al. 2019), and may be the
This article is protected by copyright. All rights reserved.
Accepted
Figure 8. Different cloud-types in the trades, taken from Riehl (1954)
down-stream evolution of closed cell convection as observed in regions of stratocumulus. The stratiform layers are often quite thin, but have a strong signature on the satellite images, and contribute considerably to the variability in cloudiness in the region (Nuijens et al. 2014).
The radar imagery, combined with the frequency with which Gravel, Fish and Flowers are identified in the satellite imagery suggests that precipitation is common in the trades, and is closely associated with the emergence of organisation. The precipitation associated with the organised patterns (Fig. 9), also appears more substantial than what is identified with the Cumulus Congestus in Riehl’s figure. Although Riehl does not provide a vertical scale for his figure, a cloud base at700meter implies that his Cumulus Congestus have tops near the freezing level, at 4.5km. The strongly precipitating clouds in Fig. 9 top out somewhat lower, between 3km to4km, whereby airborne measurements suggest that precipitation begins to become evident already when cloud tops reach1.5km (Stevens et al. 2019), and becomes frequent as clouds begin to penetrate above 2km. Together it appears that precipitation and mesoscale organisation of cloud fields in the Tradewinds is common, and to understand either might require understanding both.
4.2. Scale Sensitivity
Our experience, both in initially identifying the pattern prototypes, and through the course of the classification activity, was that there is some scale dependence to the frequency with which a pattern emerges and can be identified. At the very beginning the initial study group first attempted to classify areas even larger than
20◦× 10◦but quickly reduced the area to20◦× 10◦, and then, in the final iteration, to 10◦× 10◦. This progressive refinement is indicative of a scale dependence in the patterns, or in being able to recognise a dominant pattern over a fixed area.
The images in Figs 1-4 illustrate some of these issues. Each image was chosen from days where there was unanimity among those labelling the image. They hint at some of the challenges in the classification. For instance, if one looks closely Sugar can be found in every image, but often Sugar is confined to rather small areas of a few tens of kilometres. The relative scarcity of Sugar classifications may be indicative that very shallow convection, with no evidence of self-organisation is unlikely to dominate a large area, at least in conditions characteristic of the study area and time-period. Even when a scene is classified as Sugar, within the10◦× 10◦study area other patterns are almost always evident: Fish like structures are apparent in both the middle and left panels of Fig. 1 and on the lower left corner of the right panel of Fig. 1 some labellers might identify Flowers.
Based on this experience, and with an eye to some of the other questions raised in the introduction, we believe that the ability to identify patterns in larger images, by drawing bounding boxes (or polygons) of an arbitrary size around clearly-defined patterns, would facilitate a more consistent and robust pattern detection. Such a procedure, which was not possible in the framework of the labelling platform we used, would have the added benefit
of identifying whether different patterns occurred on different scales. Does, as we hypothesise, Sugar occur more frequently, but rarely on scales which allows it to dominate a 10◦× 10◦
area? Furthermore, by allowing multiple labels for one image, an association among patterns might be detectable. For instance does Sugar have an affinity for Gravel rather than Fish or Flowers, as the analysis above suggested?
Based on these insights a platform has been developed to allow both a more flexible and rapid labelling, thereby facilitating crowd sourced labelling activities. The design of this platform, the results from the classification and the ability of machines to learn the classes are reported in a separate manuscript.§
5. Summary and Conclusions
Twelve trained atmospheric scientists (a subset of the authors), all with a background and interest in oceanic shallow convection, gathered to explore to what extent patterns of mesoscale variability could be visually (subjectively) identified in satellite imagery of clouds in the winter trades of the North Atlantic. This region of the atmosphere, unlike over areas where stratocumulus predominates, or where cold air flows from land over warmer water, is less strongly associated with mesoscale variability in the cloud field – even if different forms of organisation had been noted in past field studies (e.g., Rauber et al. 2007). Visual inspection of one season of satellite imagery did, however, suggest that clouds exhibit different modes of organisation. These were given names: Sugar, Gravel, Fish, and Flowers, to give a more evocative sense of what were believed to be the characteristic features of each patterns.
Despite common characteristics, there was a degree of randomness to the patterns, that did not encourage the use of objective classification techniques. Instead a subjective procedure was developed whereby the patterns were described, and other scientists (labellers) were trained to identify and label these patterns. This procedure involved determining whether a particular pattern dominated a 10◦× 10◦ area upwind of the Barbados Cloud Observatory (48◦W to58◦W,10◦N to20◦N) in the season where the trade winds predominate (1 Dec through 28 Feb). Nine-hundred days of satellite imagery (encompassing the 2007/2008 to 2016/2017 northern hemisphere winter seasons) were classified, each image being classified by six different individuals. The aim of the study was to evaluate to what extent meso-scale patterns of shallow cumulus could be defined, communicated, learned, and eventually identified by other scientists. Given an ability to identify patterns of mesoscale variability, it raised the question as to what extent these patterns exhibited inter-annual or intra-seasonal variability, whether or not individual patterns had an affinity for one another, and to what extent patterns persisted from day to day.
We found that four distinct cloud patterns emerge, which we name Sugar, Gravel, Fish, or Flowers, and characterise as follows: §
Rasp, S., Schulz, H., Bony, S. and Stevens, B. 2019: Combining crowd-sourcing and deep learning to understand meso-scale organisation of shallow convection arXiv:1906.01906
This article is protected by copyright. All rights reserved.
Accepted
Figure 9. Radar presentation of Sugar, Gravel, Fish, and Flowers. Radar cross sections each span3h which for typical wind speeds of7m s−1corresponds to a spatial scale of about75km and contoured is the radar reflectivity (dBZ). Precipitation is indicated by a reflectivity signature extending to the surface. Each MODIS image is over the same geographic region, with Barbados in the left quartile below the centerline, in green. The grey vertical line in the time-series indicates the time of the satellite overpass.
Sugar: Dusting of very fine scale clouds with small vertical extension and little evidence of self-organisation (by cold-pools or gust fronts).
Gravel: Cloud fields patterned along meso-β(20km to100km) lines or arcs defining cells with intermediate granularity, and brighter cloud elements (as compared to Sugar), but with little evidence of accompanying stratiform cloud veils. Fish: Meso-αscale (200km to2000km) skeletal networks (often fishbone-like) of clouds separated from each other, or from other cloud forms, by well defined cloud free areas and sometimes accompanied by a stratiform cloud shield. Flowers: Irregularly shaped meso-β scale (20km to200km)
stratiform cloud features, often with higher reflectivity cores, and appearing in quasi-regular spaced bunches (hence the plural) with individual features well separated from one another by regions devoid of clouds.
From these we find that:
• A majority (4 of 6) of the labelers agreed on one of these four labels with a probability (p = 0.4) much larger than would be expected by randomly assigning six (p = .052), or even just four (p = 0.015), labels.
• Recognisable patterns – to the extent one associates this with the emergence of one of the four patterns – is very common in the downwind trades. Almost all of the images (more than 90%) exhibited features sufficient for at least one person to say that a particular pattern dominated the image.
• The pattern found most likely to dominate the 10◦× 10◦ study area was Gravel. Surprisingly Sugar, which our preconception most strongly associated with the downstream trades, and which is the one pattern with little signature of self-organisation, dominated the study area the least.
• Unorganised, very shallow convection (associated with Cumulus Humilis) appears frequently, but not over very large10◦× 10◦ (lon-lat) areas, as manifest in the lack of Sugar labels.
• Flowers evinced the most seasonality, appearing mostly in February, and often persisting for days.
• Differences in patterns are associated with differences in the structure of the cloud field as also visualised by its radar presentation, with Fish being most associated with deeper clouds and precipitation.
Based on these findings we conjecture that the relative scarcity of Sugar is related to a tendency of different patterns to predominate on different spatial scales, and that a labelling
This article is protected by copyright. All rights reserved.
Accepted
protocol that allowed Sugar to be identified over subregions would find more Sugar, but over smaller regions.
These findings also encouraged and guided a variety of follow-up activities. One has been designed to see if the different patterns can be measured by objective methods and if the patterns distinguish themselves in terms of their radiative effects, or the environment in which they form. Another aims to generate a great many more labels, and allow the labelling of smaller subdomains, which would then provide the basis for asking to what extent machines could learn the labels assigned by humans. Based on this it is hoped that the factors influencing the emergence of the different patterns can be identified. Finally this might help us to understand factors influencing cloudiness in the Tradewinds, and how they might change as the climate warms.
Acknowledgements
This paper arises from the activity of an International Space Science Institute (ISSI) International Team researching “The Role of Shallow Circulations in Organising Convection and Cloudiness in the Tropics”. The authors thank the ISSI for their support of this team. Additional support was provided by the European Research Council (ERC) project EUREC4A (Grant Agreement 694768) of the European Union’s Horizon 2020 Research and Innovation Programme and by the Max Planck Society. We acknowledge the use of imagery from the NASA Worldview application (https://worldview.earthdata.nasa.gov), part of the NASA Earth Observing System Data and Information System (EOSDIS). The authors thank the editors, A. Ross and D. Bouniol, and two anonymous reviewers for their constructive input.
References
Agee EM. 1987. Mesoscale cellular convection over the oceans. Dynamics of Atmospheres and Oceans10(4): 317–341.
Albrecht B, Ghate V, Mohrmann J, Wood R, Zuidema P, Bretherton C, Schwartz C, Eloranta E, Glienke S, Donaher S, Sarkar M, McGibbon J, Nugent AD, Shaw RA, Fugal J, Minnis P, Paliknoda R, Lussier L, Jensen J, Vivekanandan J, Ellis S, Tsai P, Rilling R, Haggerty J, Campos T, Stell M, Reeves M, Beaton S, Allison J, Stossmeister G, Hall S, Schmidt S. 2019. Cloud System Evolution in the Trades (CSET): Following the Evolution of Boundary Layer Cloud Systems with the NSF–NCAR GV. Bull. Amer. Meteor. Soc.100(1): 93–121.
Albrecht BA. 1989. Aerosols, cloud microphysics, and fractional cloudiness. Science 245, 1227-1230245: 1227–1230.
Atkinson BW, Zhang JW. 1996. Mesoscale shallow convection in the atmosphere. Rev. Geophys. 34(4): 403–431.
Bony S, Stevens B, Ament F, Bigorre S, Chazette P, Crewell S, Delano¨e J, Emanuel K, Farrell D, Flamant C, Gross S, Hirsch L, Karstensen J, Mayer B, Nuijens L, Ruppert JH, Sandu I, Siebesma P, Speich S, Szczap F, Totems J, Vogel R, Wendisch M, Wirth M. 2017. EUREC4A: A field campaign to Elucidate the Couplings between Clouds, Convection and Circulation. Surv Geophys36(1): 73–40.
Brient F, Schneider T, Tan Z, Bony S, Qu X, Hall A. 2015. Shallowness of tropical low clouds as a predictor of climate models’ response to warming. Climate Dynamics47(1-2): 433–449.
Hilderbrandsson HH, Teisserenc de Bort L. 1910. International Cloud Atlas. Technical report, International Meteorological Committee, Paris. Kristovich DAR, Young GS, Hjelmfelt MR, Foster RC. 2002. Rolls Streets,
Waves and More. Bulletin of the American Meteorological Society 83(7): 997–1001.
Muhlbauer A, McCoy IL, Wood R. 2014. Climatology of stratocumulus cloud morphologies: microphysical properties and radiative effects. Atmos. Chem. Phys.14(13): 6695–6716.
Nitta T, Esbensen S. 1974. Heat and moisture budget analyses using BOMEX data. Mon Weather Rev 102(1): 17–28.
Nuijens L, Serikov I, Hirsch L, Lonitz K, Stevens B. 2014. The distribution and variability of low-level cloud in the North Atlantic trades. Q.J.R. Meteorol. Soc.140(684): 2364–2374.
Orlanski I. 1975. A rational subdivision of scales for atmospheric processes. Bulletin of the American Meteorological Society56: 527–530.
Painemal D, Garreaud R, Rutllant J, Zuidema P. 2010. Southeast Pacific Stratocumulus: High-Frequency Variability and Mesoscale Structures over San F´elix Island. J. Of Appl. Meteorol. 49(3): 463–477.
Rauber RM, Stevens B, Ochs III HT, Knight C. 2007. Rain in shallow cumulus over the ocean–The RICO campaign, B. Am. Meteorol. Soc., 88, 191 2, doi: 10.1175.
Riehl H. 1954. Tropical meterology. McGraw Hill: New York.
Rossow W, Schiffer R. 1999. Advances in understanding clouds from ISCCP. Multiple values selected80(11): 2261–2287.
Seifert A, Heus T, Pincus R, Stevens B. 2015. Large-eddy simulation of the transient and near-equilibrium behavior of precipitating shallow convection. Nature7(4): 1918–1937.
Siebesma AP, Bretherton CS, Brown A, Chlond A, Cuxart J, Duynkerke PG, Jiang H, Khairoutdinov M, Lewellen D, Moeng CH, S´anchez E, Stevens B, Stevens DE. 2003. A Large Eddy Simulation Intercomparison Study of Shallow Cumulus Convection. J. Atmos. Sci 60(1): 1201–1219.
Stephens G. 2003. The Useful Pursuit of Shadows The study of clouds has profoundly influenced science and human culture and stands poised to lead climate science forward again. American scientist 91(5): 442–449. Stevens B, Ament F, Bony S, Crewell S, Ewald F, Gross S, Hansen A, Hirsch
L, Jacob M, K¨olling T, Konow H, Mayer B, Wendisch M, Wirth M, Wolf K, Bakan S, Bauer-Pfundstein M, Brueck M, Delano¨e J, Ehrlich A, Farrell D, Forde M, G¨odde F, Grob H, Hagen M, J¨akel E, Jansen F, Klepp C, Klingebiel M, Mech M, Peters G, Rapp M, Wing AA, Zinner T. 2019. A high-altitude long-range aircraft configured as a cloud observatory–the NARVAL expeditions. Bulletin of the American Meteorological Society 0(0): null.
Stevens B, Farrell D, Hirsch L, Jansen F, Nuijens L, Serikov I, Br¨ugmann B, Forde M, Linn´e H, Lonitz K, Prospero JM. 2016. The Barbados Cloud Observatory: anchoring investigations of clouds and circulation on the edge of the ITCZ. Bull. Amer. Meteorol. Soc 97(5): 787–801.
Stevens B, Vali G, Comstock K, Wood R, Van Zanten MC, Austin P, Bretherton CS, Lenschow DH. 2005. Pockets of Open Cells and Drizzle in Marine Stratocumulus. Bull. Amer. Meteorol. Soc 86(1): 51–57. Tobin I, Bony S, Roca R. 2012. Observational Evidence for Relationships
between the Degree of Aggregation of Deep Convection, Water Vapor, Surface Fluxes, and Radiation. Journal of Climate 25(20): 6885–6904. Vial J, Dufresne JL, Bony S. 2013. On the interpretation of inter-model
spread in CMIP5 climate sensitivity estimates. Climate Dynamics 41(11-12): 3339–3362.
Wood R, Hartmann DL. 2006. Spatial Variability of Liquid Water Path in Marine Low Cloud: The Importance of Mesoscale Cellular Convection . Journal of Climate19(9): 1748–1764.
Zuidema P, Li Z, Hill RJ, Bariteau L, Rilling B, Fairall C, Brewer WA, Albrecht B, Hare J. 2012. On Trade Wind Cumulus Cold Pools. J. Atmos. Sci69(1): 258–280.
A. Supplementary imagery. A.1. Bands
’Bands’ are elongated stripes hundreds of kilometres across with nearly solid cloud coverage within the Band. An example of a Band is given in Fig. 10. In this figure there is a sense that a Fish may be leering behind the band, or that Fish arise from the break-up of such Banded features.
A.2. Gravel
Of the different patterns, Gravel varied the most in terms of their radar presentation. Scenes characterised as gravel at the BCO always involved precipitating clouds, but the depth and intensity of the precipitation varied considerably. The image in Fig. 9 presents one extreme, with individual cloud elements not differing too greatly from those associated with Fish. In Fig. 11 another example is presented, more characteristic of the other extreme, whereby gravel is associated with clouds that are less vertically developed, albeit deeper than Sugar clouds, and precipitating.
This article is protected by copyright. All rights reserved.
Accepted
Figure 10. Band: MODIS-Aqua scene as in Fig. 1 but for 1 Jan 2010. 26/12/16 05:00 26/12/1605:30 26/12/1606:00 26/12/1606:30 26/12/1607:00 26/12/1607:30 26/12/1608:00 Time (UTC) 1 2 3 4 Height (km) Gravel 50 25 0 25
Figure 11. Gravel: Barbados Cloud Observatory K-band radar time-height section showing gravel clouds for situations with less vertical development of the clouds. Such scenes are more similar to the Gravel as seen in the upper left quadrant of Fig. 9
This article is protected by copyright. All rights reserved.