HAL Id: hal-02323649
https://hal.archives-ouvertes.fr/hal-02323649
Submitted on 4 Dec 2020
HAL is a multi-disciplinary open access
archive for the deposit and dissemination of
sci-entific research documents, whether they are
pub-lished or not. The documents may come from
teaching and research institutions in France or
abroad, or from public or private research centers.
L’archive ouverte pluridisciplinaire HAL, est
destinée au dépôt et à la diffusion de documents
scientifiques de niveau recherche, publiés ou non,
émanant des établissements d’enseignement et de
recherche français ou étrangers, des laboratoires
publics ou privés.
Distributed under a Creative Commons Attribution - NonCommercial - NoDerivatives| 4.0
International License
Amazonia is the primary source of Neotropical
biodiversity
Alexandre Antonelli, Alexander Zizka, Fernanda Antunes Carvalho, Ruud
Scharn, Christine Bacon, Daniele Silvestro, Fabien Condamine
To cite this version:
Alexandre Antonelli, Alexander Zizka, Fernanda Antunes Carvalho, Ruud Scharn, Christine Bacon,
et al.. Amazonia is the primary source of Neotropical biodiversity. Proceedings of the National
Academy of Sciences of the United States of America , National Academy of Sciences, 2018, 115 (23),
pp.6034-6039. �10.1073/pnas.1713819115�. �hal-02323649�
Amazonia is the primary source of
Neotropical biodiversity
Alexandre Antonellia,b,c,d,1,2, Alexander Zizkaa,b,1, Fernanda Antunes Carvalhob,e,1, Ruud Scharna,b,f, Christine D. Bacona,b, Daniele Silvestroa,b,g, and Fabien L. Condamineb,h
aGothenburg Global Biodiversity Centre, SE-405 30 Gothenburg, Sweden;bDepartment of Biological and Environmental Sciences, University of
Gothenburg, SE-405 30 Gothenburg, Sweden;cGothenburg Botanical Garden, SE-41319 Gothenburg, Sweden;dDepartment of Organismic and Evolutionary
Biology, Harvard University, Cambridge, MA 02138;eDepartment of Botany and Zoology, Federal University of Rio Grande do Norte, Natal, RN 59078-970,
Brazil;fDepartment of Earth Sciences, University of Gothenburg, SE-405 30 Gothenburg, Sweden;gDepartment of Computational Biology, University of
Lausanne, 1015 Lausanne, Switzerland; andhCNRS, ISEM, University of Montpellier, 34095 Montpellier, France
Edited by Scott V. Edwards, Harvard University, Cambridge, MA, and approved April 13, 2018 (received for review August 4, 2017)
The American tropics (the Neotropics) are the most species-rich realm on Earth, and for centuries, scientists have attempted to understand the origins and evolution of their biodiversity. It is now clear that different regions and taxonomic groups have responded differently to geological and climatic changes. However, we still lack a basic understanding of how Neotropical biodiversity was assembled over evolutionary timescales. Here we infer the timing and origin of the living biota in all major Neotropical regions by performing a cross-taxonomic biogeographic analysis based on 4,450 species from six major clades across the tree of life (angiosperms, birds, ferns, frogs, mammals, and squamates), and integrate>1.3 million species occur-rences with large-scale phylogenies. We report an unprecedented level of biotic interchange among all Neotropical regions, totaling 4,525 dispersal events. About half of these events involved transi-tions between major environmental types, with a predominant di-rectionality from forested to open biomes. For all taxonomic groups surveyed here, Amazonia is the primary source of Neotropical diver-sity, providing>2,800 lineages to other regions. Most of these dis-persal events were to Mesoamerica (∼1,500 lineages), followed by dispersals into open regions of northern South America and the Cerrado and Chaco biomes. Biotic interchange has taken place for>60 million years and generally increased toward the present. The total amount of time lineages spend in a region appears to be the strongest predictor of migration events. These results demon-strate the complex origin of tropical ecosystems and the key role of biotic interchange for the assembly of regional biotas.
biogeography
|
biome shift|
evolution|
Neotropics|
phylogeneticsT
he Neotropical realm, spanning from Mexico to southern South America and including the West Indies (1), is one of the most species-rich regions on Earth (2, 3). This vast region comprises many different biomes and habitats such as seasonally dry forests, arid zones, high-elevation grasslands, young and old mountain systems, and extensive rainforests, such as the Atlantic Forests and Amazonia (4). Because each region and biome possesses its own species diversity and communities, it is crucial to investigate the diversification history and biotic connections of each constituent region to understand how Neotropical bio-diversity was assembled (5, 6).Consensus is emerging that Neotropical diversification results from a complex interaction of biotic and abiotic processes (2, 5), which are now being teased apart by novel analytical approaches (7). Abiotic events of biological significance include the hydrologic and topographic changes brought about by mountain uplift (4), but also by several events of global and regional climatic changes (8, 9). Biotic triggers of speciation include species interactions (10, 11) and soil adaptations (12), as well as the evolution of other organism-specific traits. Neotropical diversification has been ex-tensive in some regions, such as Amazonia, where speciation in rainforest environments has taken place since at least the Paleocene (∼58 Mya, Ma; ref. 13). Other environments, such as the high-elevation grasslands in the northern Andes, have a more recent,
but still remarkable, diversification history in the last few million years (14, 15).
What remains less clear, however, is the role of biotic inter-change in the standing diversity of Neotropical regions. In addition to differences in speciation and extinction rates, regional diversity is determined by the immigration of species from other regions over time. In some cases, immigrant lineages may constitute a substantial proportion of the local diversity, such as in Ecuadorian Amazonia, where ca. 20% of all tree species arrived by dispersal from other regions (16). Within the limits of a single region, dis-persal events have been high in several plant genera (17, 18). In contrast, dispersal events (including successful establishment) across environmentally disparate regions are considered rare on a global scale (19).
Current evidence from the analysis of dated molecular phy-logenies has shown that some Neotropical regions might be more permeable than others. South American savannas, for instance, have been colonized multiple times independently by ancestors from other regions (20, 21). Alternatively, intrinsic differences among taxonomic groups (such as dispersal ability) may allow some lineages, but not others, to colonize new regions. Although some taxa tend to maintain their ecological requirements over time, staying in their region of origin or dispersing to distant regions with the same environmental conditions (i.e., niche conservatism,
Significance
Amazonia is not only the world’s most diverse rainforest but is also the region in tropical America that has contributed most to its total biodiversity. We show this by estimating and comparing the evolutionary history of a large number of animal and plant species. We find that there has been extensive interchange of evolutionary lineages among different regions and biomes, over the course of tens of millions of years. Amazonia stands out as the primary source of diversity, which can be mainly explained by the total amount of time Amazonian lineages have occupied the region. The exceedingly rich and heterogeneous diversity of the American tropics could only be achieved by high rates of dispersal events across the continent.
Author contributions: A.A., A.Z., F.A.C., R.S., C.D.B., D.S., and F.L.C. designed research; A.A., A.Z., F.A.C., R.S., D.S., and F.L.C. performed research; A.Z., R.S., and D.S. contributed new reagents/analytic tools; A.A., A.Z., F.A.C., R.S., D.S., and F.L.C. analyzed data; and A.A., A.Z., and C.D.B. wrote the paper.
The authors declare no conflict of interest. This article is a PNAS Direct Submission.
This open access article is distributed underCreative Commons Attribution-NonCommercial-NoDerivatives License 4.0 (CC BY-NC-ND).
See Commentary on page 5829.
1A.A., A.Z., and F.A.C. contributed equally to this work.
2To whom correspondence should be addressed. Email: [email protected].
This article contains supporting information online atwww.pnas.org/lookup/suppl/doi:10. 1073/pnas.1713819115/-/DCSupplemental.
refs. 19 and 22), others show frequent regional and ecological shifts (21, 23, 24). For the great majority of Neotropical regions and taxonomic groups, however, our knowledge of their biotic inter-changes and dispersal histories remains surprisingly poor, with few exceptions (e.g., refs. 25 and 26). In particular, we lack an un-derstanding of which regions served as primary sources and sinks of biodiversity, defined here as providers and receivers of lineages, respectively, rather than implying habitat quality as in population biology (27).
Understanding the dynamics of biotic interchange is chal-lenging, as several abiotic and biotic factors are likely to be in-volved (28). Based on the Theory of Island Biogeography (29), there should be a positive relationship between the number of dispersal events and the area of a region, and a negative re-lationship with geographic isolation. Similarly, the more shared perimeter (adjacency) two regions have, the more interchange should also be expected (28). However, many Neotropical re-gions and biomes have changed considerably through time (9), making it crucial to also consider historical changes in a region’s area and connectivity. In general, the more combined time lineages spend in a region (expressed as total branch lengths in a phylogeny), the more opportunities they should have to diversify and emigrate (30, 31). Regions with high diversity could be more difficult to enter than species-poor regions, because of competitive exclusion and niche filling (32, 33), or show the opposite pattern, based on empirical evidence from invasive species (34, 35). To date, none of these variables has been assessed as a general predictor of biotic interchange in the Neotropics.
Here we assess the evolutionary assembly of Neotropical biotas through a cross-taxonomic biogeographic analysis. Fossils can be useful for inferring biogeographic history (36), but the Neotropical fossil record is too scarce for most periods, regions, and taxonomic groups to allow robust estimates (37). We therefore take advan-tage of recently published, well-sampled molecular phylogenies, which hold a large but unrealized potential in revealing the evo-lution of tropical biotas (17, 38). We integrate these phylogenies with large species occurrence datasets, spatial information on Neotropical regions and biomes, and their evolution and con-nectivity through time. We address the following questions: was the amount of biotic interchange similar among Neotropical re-gions, or have particular regions contributed substantially more or less than others? How often were dispersal events associated with shifts between major biome types? To what extent was the di-rection of interchange determined by taxonomic group? Did biotic interchange among regions occur evenly through time, or were there periods of more frequent dispersal events? Which general descriptors of a region and its biota predict the amount of biotic interchange with other regions?
Results
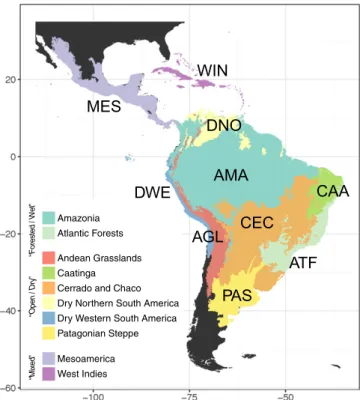
Data Compilation and Analyses.Our vetted dataset encompassed 1,331,323 georeferenced records representing 68,329 species, derived from the integration of densely sampled molecular phylogenetic trees with a large dataset of species distributions (SI Appendix, Figs. S1 and S2, Table S1, and Supporting Methods). Our analytical pipeline identified 214 predominantly Neotropical clades including 4,450 species. These comprised 104 clades of flowering plants or angiosperms (2,114 spp; representing 46.7% of the total number of species in the utilized phylogenies), four clades of ferns (53 spp; 1.16%), 54 of birds (1,237 spp; 27.5%), 11 of frogs (155 spp; 4.13%), 13 of mammals (359 spp; 8.23%), and 28 of squamates, which comprised lizards, snakes, and worm lizards or amphisbaenians (532 spp; 12.24%). All species in all phylogenies were coded as present or absent in 10 Neotropical regions (Fig. 1): two predominantly forested/wet regions (Amazonia and Atlantic Forests), six predominantly open/dry regions, at least seasonally (Andean Grasslands, Caatinga, Cerrado and Chaco, Dry Northern South America, Dry Western South America, and Patagonian Steppe), and two regions comprising a mixture of these two major biome types (Mesoamerica and West Indies;SI Appendix, Figs. S3–S8 and Table S2).
Direction of Interchange.Our biogeographic analyses show that all regions have served as both sources and sinks of lineages (Fig. 2, Tables 1 and 2, andSI Appendix, Figs. S9 and S10 and Tables S4–
S6). We identified a total of 4,525 dispersal events across the Neotropics, estimated under an unconstrained biogeographic model (assuming equal connectivity among regions through time), and 5,818 dispersal events inferred under a time-constrained model (reflecting the hypothesized history of existence and connectivity among regions). We focus our results and discussion on the unconstrained model, as it incurs the fewest assumptions, but we report all results in Tables 1 and 2 and theSI Appendix.
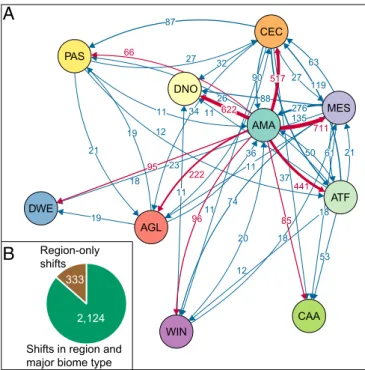
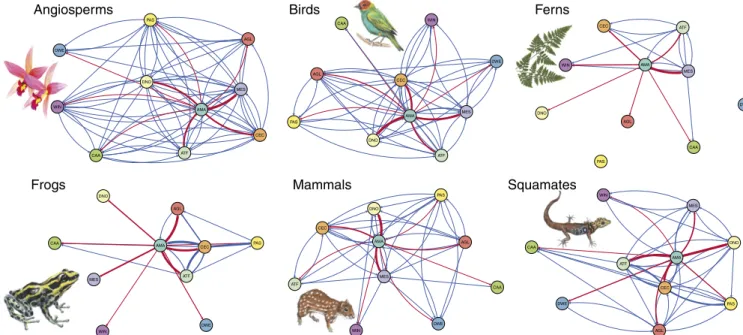
Amazonia was the most important source of diversity, providing 2,855 lineages (63% of all dispersal events) to other Neotropical regions. This was about 4.6 times as many as the second most important source region, Mesoamerica (615), followed by Cerrado and Chaco (455). In contrast, Mesoamerica was the most impor-tant sink, receiving the highest number of lineages (788; 17%), but it was closely followed by Dry Northern South America (771) and Cerrado and Chaco (766). Amazonia also served as a sink of di-versity, but only moderately so, and ranked fifth among all regions. An evaluation of the number of dispersal events out of Amazonia (Fig. 2 andSI Appendix, Tables S4–S6) revealed that about a quarter of all events were into Mesoamerica (711), closely followed by two open/dry regions: Dry Northern South America (622) and Cerrado and Chaco (517). The West Indies and the other three open/dry regions (Dry Western South America, Caatinga, Patagonian Steppe) all received fewer than 100 dispersal events each. When considering each taxonomic group separately, Amazonia remained the primary source of lineages to other Neotropical regions (Fig. 3 andSI Appendix, Tables S4–S6). The second main source varied among Mesoamerica (angiosperms and birds), Cerrado and Chaco (frogs, mammals, and squamates), and Atlantic Forests (ferns).
Atlantic Forests Amazonia
Patagonian Steppe Andean Grasslands
Dry Western South America Caatinga
Cerrado and Chaco Dry Northern South America
Mesoamerica West Indies “Forested / Wet” “Open / Dry” “Mixed”
AMA
MES
ATF
CAA
DNO
WIN
CEC
PAS
AGL
D
WE
Fig. 1. Neotropical regions used in the biogeographic analyses, grouped by
major biome type and plotted together with the abbreviations used for subsequent analyses. These regions are derived from the classification of terrestrial biomes and ecoregions by Olson et al. (48), but adapted to dif-ferentiate disjunct biomes and to simplify the complexity in Mesoamerica and the West Indies, which comprise both forested and open habitats.
Antonelli et al. PNAS | June 5, 2018 | vol. 115 | no. 23 | 6035
EVOLUTION
SEE
COM
A large number of dispersal events involved shifts between major biome types (forested/wet and open/dry), rather than dispersals to other regions but within the same major biome type (2,124 vs. 333 events, respectively; Fig. 1 andSI Appendix, Table S6). Of these, the vast majority (1,820) involved transitions from wet to dry biomes compared with shifts in the other direction (304). An almost equally large number of shifts involved mixed regions (containing both forested and open biomes) and are considered ambiguous (2,068 events).
Timing of Interchange.All regions and taxonomic groups showed fluctuations in the relative number of dispersal events through time (i.e., in proportion to the number of lineages at each time; Materials and Methods), rather than constant rates (Fig. 4 andSI
Appendix, Figs. S11–S13). We found a general increase in the
number of relative dispersal events toward the present, in partic-ular during the last 10 My.
Differences in Biogeographic Models.We found a general congru-ence in the main results obtained under the unconstrained and the time-stratified connectivity matrices between regions. Under both models (Fig. 2, Tables 1 and 2, andSI Appendix, Fig. S9), Amazonia remained the most important source of dispersal events, and Mesoamerica the most important sink. A general agreement was also found for individual clades (Fig. 3 andSI Appendix, Fig. S10), whereas the temporal pattern of dispersal events between
regions was affected by the prespecified constraints (SI Appendix, Figs. S11 and S12). We encountered differences for some pairs of regions, such as a marked asymmetry in dispersal events involving Mesoamerica under the constrained model compared with a stronger balance under the unconstrained model.
Predictors of Emigration and Immigration.The total branch length in a region was the strongest predictor for immigration and emigration (Fig. 5 and SI Appendix, Figs. S14–S19 and Tables
S7 and S8), followed by a region’s current area (positively
asso-ciated with emigration) and isolation (negatively assoasso-ciated with immigration). These were the only predictors identified as important (95% credible intervals do not contain 0) in the global model; that is, considering all regions and taxa simulta-neously. For three of the four clades with enough representation to be included in our models, we found less immigration into Amazonia than expected, and for angiosperms and birds, we found higher emigration than expected.
Discussion
The Reticulate Assembly of Neotropical Biodiversity. Our results reveal unprecedented levels of biotic interchange across all major Neotropical regions and over tens of millions of years. Clearly, the interchange of lineages has been a pivotal process for the assembly of regional biotas. The importance of Amazonia as the primary source of Neotropical lineages is strongly sup-ported across all analyses (e.g., Figs. 2 and 3).
The biotic interchange between Amazonia and Mesoamerica is remarkable, both for the high number of inferred dispersal events (711 across all lineages;SI Appendix, Tables S4–S6) and for the long period of interchange (Fig. 4 andSI Appendix, Figs. S11–S13). Once considered a continent in splendid isolation (39), these results reinforce the more recent idea that South America has instead had a long and continuous exchange of lineages with the North American continent (40). This interchange was not hindered by the relatively narrow water gaps between these con-tinents, which disappeared during the final stages of the emergence of the Isthmus of Panama (41).
Shifts Across Major Biome Types. We detected a relatively high (47%) proportion of dispersal events associated with shifts in broadly defined biome types; that is, between open/dry (some-times only seasonally) and more constantly forested/wet regions (Fig. 1B andSI Appendix, Table S6) compared with shifts across regions, but within the same biome type (7%). However, we expect that the majority of those shifts classified as ambiguous (46%) may also be region-only shifts (e.g., rainforest dwellers and mountain specialists), based on previous cross-regional studies (e.g., refs. 16–18). These results contrast with the view that biome shifts
11 11 11 11 11 12 12 18 18 18 19 19 20 21 21 23 26 27 27 32 34 36 37 50 53 61 63 66 74 85 87 88 90 95 96 119 135 222 276 441 517 622 711 AMA ATF CAA WIN CEC DNO DWE MES AGL PAS
Shifts in region and major biome type
Region-only shifts
A
B
333 2,124Fig. 2. (A) Biotic interchange among Neotropical regions estimated from
dated molecular phylogenies, comprising 4,450 species in six taxonomic groups (angiosperms, birds, ferns, frogs, mammals, squamates). Arrows indicate the direction and number of dispersal events, with line thickness proportional to the number of events. Only connections with more than 10 events are shown (seeSI Appendix, Tables S5 and S6for a full list). The position of the circles in the layout reflects the biotic connection among regions, as calculated by a force-directed placement algorithm implemented in the R package qgraph (56). Dispersal events out of Amazonia are highlighted in red. The color of the circles corresponds to those in Fig. 1. AGL, Andean Grasslands; AMA, Amazonia; ATF, Atlantic Forests; CAA, Caatinga; CEC, Cerrado and Chaco; DNO, Dry Northern South America; DWE, Dry Western South America; Mes, Mesoamerica; PAS, Patagonian Steppe; WIN, West Indies. (B) Number of nonambiguous dispersal events associated with shifts in major biome types compared with shifts to other regions within the same biome type. Shifts involving Mesoamerica and the West Indies are considered ambiguous
(n= 2,068;SI Appendix, Table S6).
Table 1. Regional sources of Neotropical biodiversity
Rank Region Unconstrained Stratified
1 Amazonia 2,855 3,674
2 Mesoamerica 615 28
3 Cerrado and Chaco 455 860
4 Atlantic Forests 296 303
5 Andean Grasslands 105 11
6 Patagonian Steppe 81 78
7 West Indies 65 249
8 Dry Northern South
America
31 396
9 Caatinga 12 85
10 Dry Western South
America
10 134
The ranked values correspond to dispersal events inferred from time-calibrated molecular phylogenies estimated under an unconstrained and a
time-stratified biogeographic model of region connectivity (SI Appendix,
over evolutionary time are rare events, as previously demonstrated for Southern Hemisphere plant lineages (19). Among the documented shifts in biome types, most events (86%;SI Appendix, Table S6) involved transitions from forested/wet regions into open/dry habitats, rather than in the opposite direction, confirming a previous study on Cerrado plants (21).
We recorded a high interchange of lineages between the rain-forests of lowland Amazonia and the Andean Grasslands, mostly located above 5,000 m above sea level (SI Appendix, Fig. S20). Although these shifts require substantial eco-physiological adap-tations, our results demonstrate that they have played a major role in the assembly of Neotropical alpine ecosystems. Cross-altitudinal dispersal events had been suggested for a few taxonomic groups previously (42–44), but were not considered common. Range shifts along elevation gradients appear to be an important evolutionary process, similar to what was recently documented for Borneo (45). The inference of a high number of shifts in major biome types could be partly masked by the large spatial scale required by our analyses. All regions and biomes comprise mosaics of different fine-scale habitats, which could have served as entrance pathways to colonizing lineages without requiring immediate adaptations. Further research is needed to assess to what extent dispersing lineages are preadapted to new environments, as opposed to developing new features in situ (28, 46).
It is notable that Amazonia provided more species to Mesoamerica, located on a landmass that has only been con-nected with South America for a short period of time and along a strait margin, rather than the surrounding dry regions in northern and central-east South America, with which Amazonia shares long borders and multiple transition zones. This result could primarily reflect dispersal events between the Chocó, included in Olson’s (47) definition of Amazonia adopted here, and Mesoamerica. A biogeographic analysis using a different expert-based region classification, in which we adopted a more restrictive delimitation of Amazonia, suggests that most interchange indeed involves Amazonia (SI Appendix, Fig. S21). Our results corroborate a recent analysis of plot data for rainforest woody plants, which showed a large number of shared species between Panama and eastern Ecuador and concluded that the abundance and environmental tolerance of species were strong predictors of their ability to occupy both regions (48).
Predictors of Interchange. As expected, both the area and total branch length of a region were strongly and positively correlated with emigration (Fig. 5). It is surprising, however, that in our dispersal model including all taxa we found no positive effect of isolation or length of the perimeter on emigration. We expected a higher number of dispersal events between regions that are adjacent and broadly connected, based on theoretical expecta-tions and empirical evidence (28).
The positive relationship between the total branch length and the number of immigration events in a region suggests that Neotropical regions are not yet saturated with species, as would have been predicted under a scenario of competitive exclusion and niche filling (32, 33). Instead, our results reflect patterns of recent invasions of nonnative plants, birds, and fishes, in which regions with the highest species richness are also those with most invasions (34, 35). The relation between species richness and
AMA ATF CAA WIN CEC DNO DWE MES AGL PAS Angiosperms AMA ATF CAA WIN CEC DNO DWE MES AGL PAS Birds AMA ATF CAA WIN CEC DNO DWE MES AGL PAS Ferns AMA ATF CAA WIN CEC DNO DWE MES AGL PAS Frogs AMA ATF CAA WIN CEC DNO DWE MES AGL PAS Mammals AMA ATF CAA WIN CEC DNO DWE MES AGL PAS Squamates
Fig. 3. Clade-specific lineage interchange among Neotropical regions, using the same color scheme and methodology as in Fig. 2. Fern image courtesy of
Pixabay/Geralt. Flower image courtesy of Pixabay/821292. Animal images courtesy of Malin Laggren.
Andean Grasslands Atlantic Forests
Mesoamerica Cerrado and Chaco
0 20 40 60 60 40 20 0 0.00 0.02 0.04 0.06 0.08 0.00 0.02 0.04 Age [Ma] Nor maliz ed relativ e n umber of dispersals Angiosperms Birds Ferns Frogs Mammals Squamates A B C D
Fig. 4. Taxon-specific interchange between Amazonia and (A) Mesoamerica,
(B) Cerrado and Chado, (C) Andean Grasslands, and (D) Atlantic Forests throughout the Cenozoic (older events are pruned from the figure but included in the total calculation of events). Dispersal rates are normalized in relation to the number of available lineages in each phylogeny. Age in millions of years ago (Ma).
Antonelli et al. PNAS | June 5, 2018 | vol. 115 | no. 23 | 6037
EVOLUTION
SEE
COM
resilience to invasions may depend on the spatial and temporal scale considered (33, 35), and ongoing invasions are likely also related to the higher human density seen in species-rich envi-ronments (34). In addition, the high number of immigrants will, by themselves, also lead to an increase in the total branch length of a region. We also note that branch length sums were strongly correlated to the total number of occurrences in a region, meaning we cannot exclude an undetected effect of sampling biases beyond our measure of phylogenetic sampling.
Comparison Among Organisms.There was a generally high level of congruence in the directionality of dispersal events across taxa (Fig. 3), despite their biological and ecological differences. For instance, all taxa showed a substantial interchange between Amazonia and Mesoamerica, the Atlantic Forests, the Cerrado and Chaco, and the Andean Grasslands. Interchange with the West Indies and the Dry Western South America was low for all groups. Concerning the timing of interchange with Amazonia (Fig. 4
and SI Appendix, Figs. S11–S13), we detected some level of
taxonomic congruence (e.g., angiosperms, birds, and mammals increasing in relative dispersal rates with the Cerrado and Chaco and with Dry Northern South America in the last 20 My), but in most cases the fluctuations appear stochastic over time and across taxonomic groups. This reinforces the idea that lineages have individual evolutionary histories and biogeographic origins, and that biotas are the result of repeated interchanges followed by in situ speciation (5).
Conclusions.Our study shows that Amazonia is the primary source of Neotropical biodiversity: not only did it generate enormous in situ diversity but it also provided lineages to all other Neotropical regions, across all studied taxonomic groups, and throughout the Cenozoic. Taken together, our results demonstrate that even very dissimilar regions, in terms of environmental variables and con-stituent biota, do not evolve in isolation, but are highly biologically interconnected over evolutionary timescales. Biotic interchange can be largely, but not fully, predicted by simple abiotic and biotic variables. The cross-taxonomic framework applied here could be
used to investigate the evolutionary history of many other regions and biotas, to better understand the history of life on Earth. Materials and Methods
A full description of the methodology used and known limitations of our data and methodology, such as those caused by incomplete sampling of species occurrences and molecular sequences in public databases (49, 50), are described inSI Appendix, Supporting Methods.
Data Compilation. We focused our analyses on the Neotropical realm as defined by Morrone (1). Within the Neotropics, we defined and delimited 10 regions, broadly corresponding to environmentally and biologically
dif-ferent terrestrial biomes proposed by Olson et al. (47) (Fig. 1 andSI Appendix,
Fig. S22). We reconstructed the biogeographic history of two groups of plants (angiosperms and ferns) and four groups of vertebrates (birds, frogs, mam-mals, and squamates). We downloaded occurrence records for all species from
the Global Biodiversity Information Facility (SI Appendix, Supporting Methods).
We used SpeciesGeoCoder v.1.8 (51) for automated cleaning of the occurrence records. We classified each species as present or absent in each Neotropical
region, using an occurrence filter of≥5% to recognize a species as present in a
region (selected to maximize inclusion while minimizing false-positives, after
testing for multiple thresholds between 0% and 50%;SI Appendix, Fig. S23).
We retrieved published large-scale time-calibrated phylogenies for all study
groups (see SI Appendix for references), from which we extracted
pre-dominantly Neotropical clades (≥85% of the species).
Analyses. We use the terms migration and dispersal interchangeably in a bio-geographic context, meaning establishment of evolutionary lineages in a new region rather than, for example, annual bird migrations. We do not attempt to differentiate between dispersal and vicariance, that is, the separation of pop-ulations by the formation of barriers, which has also contributed to shaping current diversity patterns in the Neotropics (52). We implemented the dispersal-extinction-cladogenesis model (53) in the R package BioGeoBEARS (54) to infer geographical range evolution of lineages. We developed two sets of analyses: one in which biotic connectivity among all regions was allowed at any point in time, and one in which we modeled connectivity based on paleogeographic
and geological evidence (SI Appendix, Table S3). We identified shifts between
regions in 5-My time bins. We computed the absolute number of dispersal events through time by extracting the areas and ages of all nodes from each phylogeny. The number of branches and total amount of branch lengths in any phylogeny of extant species increase with time, potentially increasing the number of dispersal events toward the present even under a constant dispersal rate (55). We therefore also calculated relative numbers of dispersal events by dividing absolute numbers by the total length of all branches within each time bin (37). We tested the dependence of the number of dispersal events esti-mated for each region on six predictor variables (Fig. 5; excluding one because of high correlation). We tested the covariance of the predictors using the Variance Inflation Factor and Pearson correlations. We fit two linear mixed-effects models with a random intercept, using taxon as random effect in a Bayesian framework. We excluded data from the two taxa with the fewest species sampled (ferns and frogs), as the number of dispersal events was zero for several regions in these clades, and assumed one shift for the remaining
Emigration events Immigration events
−0.5 0.0 0.5 1.0 1.5 −0.5 0.0 0.5 1.0 1.5
Area [log km^2] Branch length [log]
13 14 15 4 6 8 0.0 2.5 5.0 7.5 Emigration [log]
Branch length [log]
4 6 8 0 2 4 6 Immigration [log] Phylogenetic sampling Branch length Isolation Perimeter Area Abiotic Biotic Bias Predictor variables A B C D E
Fig. 5. Relationship between the number of dispersal events out of a region
(emigration) and into a region (immigration), and predictor variables. (A and B) Regression coefficients of a Bayesian multiple linear mixed effects model calcu-lated based on all regions and clades. (C–E) Partial fit of the number of dispersal events for area and cumulative branch length, calculated for all regions and clades except ferns and frogs. The fitted lines show the posterior mean predicted values from the same model, assuming average values for all other predictors, whereas the points show the raw data. Shaded lines show 95% credible intervals. Dispersal events into or out of Amazonia are shown in red.
Table 2. Sinks of Neotropical biodiversity
Rank Region Unconstrained Stratified
1 Mesoamerica 788 1,756
2 Dry Northern South
America
771 772
3 Cerrado and Chaco 766 806
4 Atlantic Forests 661 723 5 Amazonia 494 458 6 Andean Grasslands 298 509 7 Patagonian Steppe 210 224 8 West Indies 201 213 9 Caatinga 199 202
10 Dry Western South
America
137 155
The values correspond to dispersal events inferred from time-calibrated molecular phylogenies estimated under an unconstrained and a time-stratified
three cases with no observed shifts to enable logarithmic transformation. We log-transformed predictors and responses and used a gamma prior with shape 1 and scale 0.5 for the hyper parameters of the random intercepts per taxon. ACKNOWLEDGMENTS. We are very grateful for the constructive comments by three anonymous reviewers and the handling editor, which helped to substantially improve this manuscript. We also thank Søren Faurby, Allison Perrigo, Isabel Sanmartín, Carlos Jaramillo, Lucia Lohmann, James Albert, Mark Torchin, and Michael Donoghue for discussions and feedback at various stages of this project. Funding for this work was provided by the
Swedish Research Council (B0569601), the European Research Council
un-der the European Union’s Seventh Framework Programme (FP/2007-2013,
ERC Grant Agreement 331024), the Swedish Foundation for Strategic Re-search, the Faculty of Sciences at the University of Gothenburg, the David Rockefeller Center for Latin American Studies at Harvard University, the Wenner-Gren Foundations, and a Wallenberg Academy Fellowship (to A.A.); the Swedish Research Council (2015-04748 to D.S.); the Carl Tryggers
Stiftelse grant (CTS 12:24) and an“Investissements d’Avenir” grant
man-aged by Agence Nationale de la Recherche (CEBA, ref. ANR-10-LABX-25-01 to F.L.C.).
1. Morrone JJ (2014) Biogeographical regionalisation of the Neotropical region. Zootaxa 3782:1–110.
2. Antonelli A, Sanmartín I (2011) Why are there so many plant species in the Neo-tropics? Taxon 60:403–414.
3. Ulloa Ulloa C, et al. (2017) An integrated assessment of the vascular plant species of the Americas. Science 358:1614–1617.
4. Hoorn C, et al. (2010) Amazonia through time: Andean uplift, climate change, landscape evolution, and biodiversity. Science 330:927–931.
5. Hughes CE, Pennington RT, Antonelli A (2013) Neotropical plant evolution: Assem-bling the big picture. Bot J Linn Soc 171:1–18.
6. Rull V (2011) Neotropical biodiversity: Timing and potential drivers. Trends Ecol Evol 26:508–513.
7. Lagomarsino LP, Condamine FL, Antonelli A, Mulch A, Davis CC (2016) The abiotic and biotic drivers of rapid diversification in Andean bellflowers (Campanulaceae). New Phytol 210:1430–1442.
8. Cárdenas ML, et al. (2011) The response of vegetation on the Andean flank in western Amazonia to Pleistocene climate change. Science 331:1055–1058.
9. Jaramillo C, Cárdenas A (2013) Global warming and Neotropical rainforests: A his-torical perspective. Annu Rev Earth Planet Sci 41:741–766.
10. Fine PVA, Mesones I, Coley PD (2004) Herbivores promote habitat specialization by trees in Amazonian forests. Science 305:663–665.
11. Kursar TA, et al. (2009) The evolution of antiherbivore defenses and their contribu-tion to species coexistence in the tropical tree genus Inga. Proc Natl Acad Sci USA 106: 18073–18078.
12. Fine PVA, Daly DC, Villa Muñoz G, Mesones I, Cameron KM (2005) The contribution of edaphic heterogeneity to the evolution and diversity of Burseraceae trees in the western Amazon. Evolution 59:1464–1478.
13. Wing SL, et al. (2009) Late Paleocene fossils from the Cerrejon Formation, Colombia, are the earliest record of Neotropical rainforest. Proc Natl Acad Sci USA 106: 18627–18632.
14. Madriñán S, Cortés AJ, Richardson JE (2013) Páramo is the world’s fastest evolving and coolest biodiversity hotspot. Front Genet 4:192.
15. Hughes CE (2016) The tropical Andean plant diversity powerhouse. New Phytol 210: 1152–1154.
16. Pennington RT, Dick CW (2004) The role of immigrants in the assembly of the South American rainforest tree flora. Philos Trans R Soc Lond B Biol Sci 359:1611–1622. 17. Dexter KG, et al. (2017) Dispersal assembly of rain forest tree communities across the
Amazon basin. Proc Natl Acad Sci USA 114:2645–2650.
18. Zizka A, Steege Ht, Pessoa MdCR, Antonelli A (2018) Finding needles in the haystack: Where to look for rare species in the American tropics. Ecography 41:321–330. 19. Crisp MD, et al. (2009) Phylogenetic biome conservatism on a global scale. Nature 458:
754–756.
20. Souza-Neto AC, Cianciaruso MV, Collevatti RG (2016) Habitat shifts shaping the di-versity of a biodidi-versity hotspot through time: Insights from the phylogenetic struc-ture of Caesalpinioideae in the Brazilian Cerrado. J Biogeogr 43:340–350. 21. Simon MF, et al. (2009) Recent assembly of the Cerrado, a neotropical plant diversity
hotspot, by in situ evolution of adaptations to fire. Proc Natl Acad Sci USA 106: 20359–20364.
22. DRYFLOR; Banda-R K, et al. (2016) Plant diversity patterns in neotropical dry forests and their conservation implications. Science 353:1383–1387.
23. Losos JB, et al. (2003) Niche lability in the evolution of a Caribbean lizard community. Nature 424:542–545.
24. Trujillo-Arias N, et al. (2017) The niche and phylogeography of a passerine reveal the history of biological diversification between the Andean and the Atlantic forests. Mol Phylogenet Evol 112:107–121.
25. Becerra JX, Venable DL (2008) Sources and sinks of diversification and conservation priorities for the Mexican tropical dry forest. PLoS One 3:e3436.
26. Nieto-Blázquez ME, Antonelli A, Roncal J (2017) Historical Biogeography of endemic seed plant genera in the Caribbean: Did GAARlandia play a role? Ecol Evol 7: 10158–10174.
27. Dias PC (1996) Sources and sinks in population biology. Trends Ecol Evol 11:326–330. 28. Donoghue MJ, Edwards EJ (2014) Biome shifts and niche evolution in plants. Annu
Rev Ecol Syst 45:547–572.
29. MacArthur RH, Wilson EO (1967) The Theory of Island Biogeography (Princeton Univ Press, Princeton).
30. Fine PV, Ree RH (2006) Evidence for a time-integrated species-area effect on the latitudinal gradient in tree diversity. Am Nat 168:796–804.
31. Jetz W, Fine PV (2012) Global gradients in vertebrate diversity predicted by his-torical area-productivity dynamics and contemporary environment. PLoS Biol 10: e1001292.
32. Price TD, et al. (2014) Niche filling slows the diversification of Himalayan songbirds. Nature 509:222–225.
33. Kennedy TA, et al. (2002) Biodiversity as a barrier to ecological invasion. Nature 417: 636–638.
34. Stohlgren TJ, et al. (2006) Species richness and patterns of invasion in plants, birds, and fishes in the United States. Biol Invasions 8:427–447.
35. Stohlgren TJ, Barnett DT, Jarnevich CS, Flather C, Kartesz J (2008) The myth of plant species saturation. Ecol Lett 11:313–322.
36. Silvestro D, et al. (2016) Fossil biogeography: A new model to infer dispersal, ex-tinction and sampling from palaeontological data. Philos Trans R Soc Lond B Biol Sci 371:20150225.
37. Antonelli A, et al. (2015) An engine for global plant diversity: Highest evolutionary turnover and emigration in the American tropics. Front Genet 6:130.
38. Eiserhardt WL, Couvreur TLP, Baker WJ (2017) Plant phylogeny as a window on the evolution of hyperdiversity in the tropical rainforest biome. New Phytol 214: 1408–1422.
39. Simpson GG (1980) Splendid Isolation: The Curious History of South American Mammals (Yale Univ Press, New Haven, CT).
40. Bacon CD, et al. (2015) Biological evidence supports an early and complex emergence of the Isthmus of Panama. Proc Natl Acad Sci USA 112:6110–6115.
41. Montes C, et al. (2015) Middle Miocene closure of the Central American Seaway. Science 348:226–229.
42. Santos JC, et al. (2009) Amazonian amphibian diversity is primarily derived from late Miocene Andean lineages. PLoS Biol 7:e56.
43. Antonelli A, Nylander JAA, Persson C, Sanmartín I (2009) Tracing the impact of the Andean uplift on Neotropical plant evolution. Proc Natl Acad Sci USA 106:9749–9754. 44. Brumfield RT, Edwards SV (2007) Evolution into and out of the Andes: A Bayesian analysis of historical diversification in Thamnophilus antshrikes. Evolution 61: 346–367.
45. Merckx VS, et al. (2015) Evolution of endemism on a young tropical mountain. Nature 524:347–350.
46. Zanne AE, et al. (2014) Three keys to the radiation of angiosperms into freezing environments. Nature 506:89–92.
47. Olson DM, et al. (2001) Terrestrial ecoregions of the world: A new map of life on earth: A new global map of terrestrial ecoregions provides an innovative tool for conserving biodiversity. Bioscience 51:933–938.
48. Bemmels JB, et al. (March 12, 2018) Filter‐dispersal assembly of lowland Neotropical rainforests across the Andes. Ecography, 10.1111/ecog.03473.
49. Daru BH, et al. (2018) Widespread sampling biases in herbaria revealed from large-scale digitization. New Phytol 217:939–955.
50. Meyer C, Weigelt P, Kreft H (2016) Multidimensional biases, gaps and uncertainties in global plant occurrence information. Ecol Lett 19:992–1006.
51. Töpel M, et al. (2017) SpeciesGeoCoder: Fast categorization of species occurrences for analyses of biodiversity, biogeography, ecology and evolution. Syst Biol 66: 145–151.
52. Pennington RT, Dick CW (2010) Diversification of the Amazonian flora and its relation to key geological and environmental events: A molecular perspective. Amazonia, Landscape and Species Evolution (Blackwell, Oxford).
53. Ree RH, Moore BR, Webb CO, Donoghue MJ (2005) A likelihood framework for inferring the evolution of geographic range on phylogenetic trees. Evolution 59:2299–2311. 54. Matzke N (2013) Probabilistic historical biogeography: New models for founder-event
speciation, imperfect detection, and fossils allow improved accuracy and model-testing. Front Biogeogr 26:242–248.
55. Tripp EA, McDade LA (2014) A rich fossil record yields calibrated phylogeny for Acanthaceae (Lamiales) and evidence for marked biases in timing and directionality of intercontinental disjunctions. Syst Biol 63:660–684.
56. Epskamp S, Cramer AO, Waldorp LJ, Schmittmann VD, Borsboom D (2012) qgraph: Network visualizations of relationships in psychometric data. J Stat Softw 48:1–18.
Antonelli et al. PNAS | June 5, 2018 | vol. 115 | no. 23 | 6039
EVOLUTION
SEE
COM