MIT LIBRARIES 3
9080
01917
6632
'f
"'i;rmmimimmmmmi^
/(feiiifilifppli
piiiliSBii
HI'mJij/ii! I;'!!};;;;«if//;;/!'ii j,
-It
Digitized
by
the
Internet
Archive
in
2011
with
funding
from
Boston
Library
Consortium
IVIember
Libraries
DEWEY
Massachusetts
Institute
of
Technology
Department
of
Economics
Working
Paper
Series
THE
ANTEBELLUM
TARIFF
ON
COTTON
TEXTILES
REVISITED
Douglas
A.
Irwin
Peter
Temin
Working
Paper
00-19
September
2000
Room
E52-251
50
Memorial
Drive
Cambridge,
MA
02142
This
paper
can
be
downloaded
witiioutcharge from
the
Social
Science
Research Network Paper
Collection
at,; MASSACHJSETTSINSTITUTE
OFTECHNOLOGY
OCT
3 2000L.„„„._„„,
Massachusetts
Institute
of
Technology
Department
of
Economics
Working
Paper
Series
THE
ANTEBELLUM
TARIFF
ON
COTTON
TEXTILES
REVISITED
Douglas
A.
Irwin
Peter
Temin
Working
Paper
00-19
September
2000
Room
E52-251
50
Memorial
Drive
Cambridge,
MA
02142
This
paper
can
be
downloaded
without
charge from
the
Social
Science
Research Network Paper
Collection
atThe
Antebellum
Tariffon Cotton
Textiles RevisitedDouglas
A. IrwinDepartment
ofEconomics
6106
Rockefeller HallDartmouth
College Hanover,NH
03755
andNBER
PeterTemin
Department
ofEconomics
50Memorial
DriveMIT
Cambndge,
MA
02142
andNBER
July 20,2000
AbstractRecentresearch has suggestedthat the antebellum U.S. cotton textile industry
would
have beenwiped
outhad it not receivedtariffprotection.We
reaffirmTaussig'sjudgment
thatthe U.S. cottontextile industrywas
largelyindependentofthe tariffby
the 1830s.American
andBritishproducers specialized inquite different types oftextileproducts that
were
poorsubstitutes forone another.
The
Walker
tariffof 1846, forexample, reduced theduties on cotton textilesfrom
nearly
70
percentto 25percent and imports soared as aresult, buttherewas
little change indomestic production.
Using
datafrom 1826
to 1860,we
estimate the responsiveness ofdomesticproductionto fluctuations in import prices and concludethat the industrycould have survived
even ifthetariffhad been completelyeliminated.
Acknowledgments
:We
thankparticipants at theDAE
meeting oftheNBER
Summer
Institute for
-1-1. Introduction
America's industrializationin the earlynineteenth century
was
spearheadedby
theNew
England
cotton textile industry.The
industry received astrong initial impetusfrom
theJeffersonian
embargo
and thewar-time disruptionstocommerce
from
1807 to 1815. Afterthewar, the industrypressed forandreceivedhigh tariffs toblockimport competition and domestic
outputcontinuedto expand.
The
extenttowhich
theindustrydepended upon
thetariff, however, has been asource ofdebate. Taussig (1931, pp. 135-36)opined that"the tariffof
1816
may
beconsideredajudiciousapplication ofthe pnnciple of protection to
young
industries" inpartbecause domestic producersbecame
strongenough
to survive withouttariffs "almost certainlyby
1832."By
thistime,Taussig concluded, "the cotton manufacture
was
inthemain
independent ofprotection, andnotlikely to be
much
affected, favorably or unfavorably,by changes in duties."Bils (1984) and Harley (1992)recentlychallenged Taussig's view.
They
went beyond
Taussig's informedifinformal discussion
by
explicitlyconsideringthe costs ofproducing cottontextiles in
America
andBritain in the 1830s and 1840s. Bilsconcludedthat, even aftertwo
decades ofprotection, the domestic industry
"was
stillunable tostandon
itsown.
. . asof 1833,removing
protectionwould
have eliminatedthe vastmajority of valueadded
in the cottontextileindustry."
With
additional cost evidence, drawingprincipallyon
Montgomery
(1840), Harleyconcurred and conjectured thatremoval ofthe tariff
would
have shrunk domestic output to about10 percent ofdomestic
consumption
even as late as the 1850s.One
problem
withthe Bils andafter all dependson comparative and not absolute advantage, andprovide littleinformation on
the characteristics of
American
andBritishfabrics, akeyconsideration indetermining theimpactofthe tariff.'
This paper
examines what
previous researchershave largely ignored-
namely, thehistorical recordof
how
domestic production responded tochanges in the relative price ofimports. Rather thaninferringthe impact ofthetariff
from
cost data,we
allow time series dataon
prices, domesticproduction, andimports from 1826 to 1860 tospeak on the issueofthetariff's importance.
These
data allow us toestimate the sensitivityofdomestic outputto changesin the relative price of imports, whetherdue to changesin the prices ofgoods,the exchangerate,
or the tariff rate.
We
conclude thatthe findings ofBils and Harleyexaggerate the importance ofthe tariffafter 1830. Rather,
American
andBritish cotton textile producers specialized in quite differentvarieties of cotton goods, and domestic producers wereinsulated
from
foreigncompetitionby
thedifferent characteristics oftheirproducts.
The
relative unimportance ofthe tariffis demonstratedby
the reduction inthe cotton textileduties in1846 from
nearly70
percent to 25 percent.Imports soared
by
a factorofthree and increasedtheirshare oftheU.S. marketfrom
about 7percent to about 15 percent, but there
was no
declinein domestic output. This simpleexperimentsuggests thatU.S. cotton textile producers
were
not dependentupon
the tariffand thus supports Taussig's view that the industrywas
well establishedby
thistime.'
The
cost estimates inMontgomery
(1840) also were disputed at thetime. SeeJustitia(1841). If
we
followed the approach offocusing on productioncosts today,we
would
concludethat the United Slates
would
not import automobiles fromGermany
(such asMercedes
and
-3-2.
Background
For
most
ofthe earlynineteenth century, theU.S. tariffon imported cotton clothwas
acombmation
of an advalorem
rate and aminimum
valuation.The
tariffof 1816, forexample,generallyregardedas thefirst"protective" U.S.tariff, consisted ofa
20
percent ad valoremrateon importedtextiles along witha 25 centperyard
minimum
valuation. Thisscheme
severelyburdened textile importsthat
were
pricedunder25 cents per yard andthus shiftedthecomposition ofimports
toward
highergrade, higher priced products.The
minimum
valuationmay
not have been bindingon
British products, however, because goods worth less than 25 centsper yard were nottypical ofBritish products duringthistime (Stettler 1970, p. 212). Taussig
commented
onlythattheminimum
excluded coarsercloths; it also excludedAsian cloth whilenot affectingimports
from
Britain.This
was
a deliberatestrategyby
FrancisLowell.As
explainedby
hiscolleague,Nathan
Appleton, the
minimum
was
designed toprotectedthefledgling industryinNew
England
without antagonizing Southerncotton exporters toEngland. Cotton growers in the South
exported
raw
cottonto Britain,and
theywere opposed
toanytariffthatwould
restrictthe sales oftheirBritishcustomers to theUnited States.
They
worried both about lossofsales and aboutfurther losses dueto possible British retaliation. Lowell's tariffdesign
shows
thatthe sectionalconflictover thetariffthat
would loom
large atmid-centurywas
alreadypresent atthe startofNew
England
industrialization(Temin
2000).After 1816, however, the
minimum
valuationbecame
increasinglybinding asBritishexportpricesoftextiles fell steadily andasthe
minimum
valuationwas
graduallyraised in
-4-period.
The
minimum
valuation, forexample,was
raisedfrom
25 centsto30
centsin the tariffof 1824, andthe ad valorem tariff
was
increasedfrom 20
percent to25 percent. In 1828theminimum
valuationwas
raised againto 35 cents.By
the 1840s, the averageBntish export priceto the United States
was
around 13cents peryard, yet theminimum
valuation on printedclothwas
30cents peryard. Thisminimum
required that the 13 cent per yardimportwould
beassessedat
30
cents; applying the30percentdutyto that price implies a charge of9cents peryard,
amounting
to an ad valorem equivalent ofover60
percent."^The
most
important changeafter thisperiod
was
theWalker
tariffof 1846,which
completelyeliminated theminimum
valuation andcut the ad valoremtariffto 25 percent.
To
determine the effective ad valoremrateon
imports,the prices ofthe imported goodsmust
be ascertained.While
U.S. trade statistics duringthisperiodreport onlythetotal value ofcotton imports (with
some
category breakdown, by country), Britainpublished statistics on thevalue and
volume
ofits cottontextile exports to various markets, includingthe UnitedStates.These
data allow the unit value ofBritish textileexports to becalculated, a usefulsummary
statisticofthe averageexport priceto the United States
and
to othermarkets.-'Both
price series^
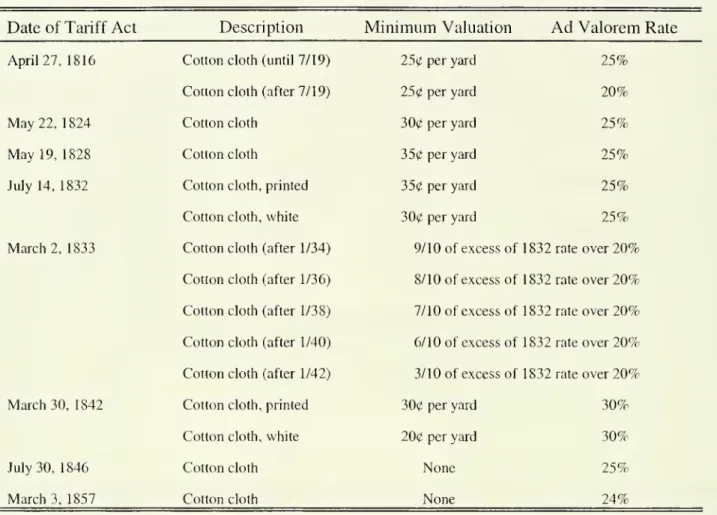
As
Table 1 indicates, theTariff of 1842 had aminimum
valuation of30
cents per yardofprinted cloth and
20
cents per yard ofwhite cloth. Accordingto U.S. import statistics, thevalue ofprinted, stained,or colored cottonmanufactures
from
Britain vastly exceededthat ofwhite or uncoloredcotton manufactures. See, forexample, U.S.
House
of Representatives,"Commerce
and Navigation,"House
ExecutiveDocument
No. 42, 13'^ Congress, 2"*^Session (Washington, D.C.:GPO,
1849),p. 150.^
The
sourcesforthe dataare GreatBritain,House
ofCommons
(1847-48),p. 325,
House
ofCommons
(1951), p. 261,House
ofCommons
(1856), p. 385, andHelm
(1869), p. 435.These
datawere
originally utilizedby Stettler(1970, pp. 137, 168, 216-217), butwe
foundtwo
apparent errors inhis series on theaverage prices ofBritish textileexports to the UnitedStates. First, he
seems
to havetaken the Bntish export quantityfrom
thecolumn
marked
"cottons" andshow
a steady decline duringthe 1815 to1860
period, butprices aresomewhat
higheron goodsdestinedfortheU.S. market, consistentwith the effectofthe
minimum
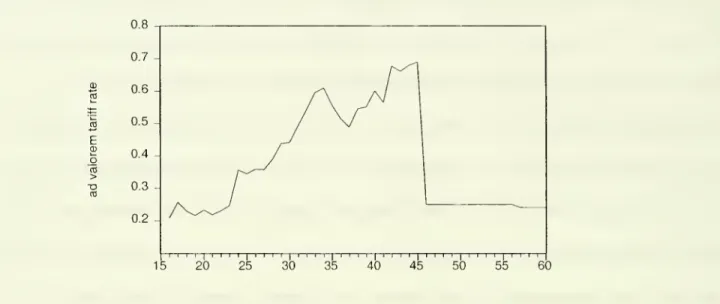
valuation in shiftingthecomposition of imports toward finer, highervalued goods. Figure 1 presentsourestimate ofthe
ad valorem equivalent importtariffon British textiles,
which
iscalculatedby
applying thetariffrates in Table 1 to the exportprice series.
As
theminimum
valuations rose and British exportpricesfell, the effectivetariffrose tonearly
70
percentby
the early 1840s.The
Walker
tariffof 1846 appearedto pull the rug outfrom
under domesticproducersby
eliminating the
minimum
valuation andapplying a simple 25 percent ad valorem tariff.As
Figure 1 strikingly demonstrates,the effectivetariff
plummeted from 69
percenttojust25 percent. Imports
from
Britain nearlytripled, soaringfrom
37 million yardsin 1846 to 105million yards in 1847, andthen falling back to 71 million yards in 1848 (Stettler 1970, p. 168).
Yet
what happened
to domestic production? According to theDavis andStettler(1966, p. 221)series on
New
England
textile output, presented inFigure 2, production stalledbrieflym
1847butthen
resumed
its growth. Despite the sharp tariffreduction, therewas no
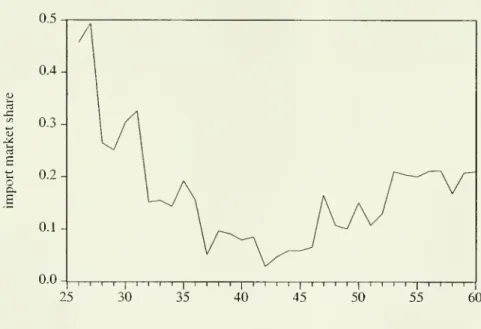
absolute decline inoutput. Figure 3
shows
that theimport market sharejumped
from roughly 5 percent in 1846 toabout 15 percent in 1847 andthen climbedto around
20
percentby
the mid-1850s.But
thisgrowth in imports occurred without a decline in domestic production.
The
uniformity ofthe growth inNew
England
textile outputinFigure 2 is striking.The
tariff
may
have affected the level ofAmerican
textileproduction to a slight extent, butit doesnotvalue ofall export categories (including cotton thread, twist, and yam).
While
the otherexportcategories are
much
less important than "cottons," it doesraise thecalculated averageprice andthusreduce the calculatedaveragetariff. Second, even usingthe
columns
that Stettlerselected,the unit value isnot
what
hereports itto bedue toan apparent arithmetic error forthe years prior
-6-seem
to have affectedits growth.As
Taussig (1931,p. 140) noted,"when
the actof 1846was
passed, the protectionistspredicted disaster; butdisaster
came
not, eitherforthe countryatlargeorforthecotton industry" asproduction steadily increased.
3. Estimatingthe
Impact
ofTariffChanges
To
explore further theimportance ofthetarifftothe domesticcotton industry,we
employ
a simplereduced-form model, based on
Grossman
(1986), to determinethe effectsofchanges inthe relative price ofimports on domesticoutput. In this model, the priceofdomestic goodsis
endogenous, as is thequantity produced,
and
this enables us toestimate the effectofthetariffon domestic production withoutassuming
that the domestic pricewas
unaffectedby
the tariff. Thisframework
enables us toexamine
thedatain amore
systematic way.On
the supply side,we
assume
that cotton textiles areproduced withraw
cotton (C),labor (L), andcapital (K).
The
production function takes thefollowingCobb-Douglas
form:(1)
Q
=
Ae'"C^'L^^K^\where
Q
is the quantityoftextileproduction,n
isthe rate ofHicksneutral technologicalprogress, and t representstime."*
Cotton is
assumed
to be atraded input andavailable to the industryat theexogenous
price Pc and laboris also
assumed
tobe supplied attheexogenous pricew.The
quantityofcotton usedand labor
employed
isfoundby
settingthe marginal value productofeach equal toits price:
"*
While
theCobb-Douglas
specification imposes certain restrictions onthe coefficients, the estimatedreducedform
ismore
general and doesnot implyany restrictions on the(2)
C
=
(a,pQ/pc),(3)
L
=
(a.pQ/w),where
p is the priceoftextileoutput, p^ is the priceofcotton, andw
is thewage. Capital is anon-traded factor
whose
supplygrows
attheexogenous
trend rate (including depreciation) of5percentperyear:
K
=
Ke^'On
thedemand
side, domestic textilessubstituteimperfectly with foreign-producedtextiles,
which
is perfectly elastic in supply and can be imported atexogenous
price p*.Domestic
textiles also substitute imperfectlywith the aggregate basket ofdomestic goods so thatdemand
ischaracterized as:(4)
Q
=
Be^"[Ep*(l-hT)/p]''[pVp]''-Y",where
\\i isthe rate of seculardemand
shift,E
is theexchange rate, p* is the (foreign)importpriceoftextiles, tisthe ad valorem tariffrate
on
importedtextiles,p^ is the price oftheaggregate basket ofdomestic goods,
and
Y
is real national income.The
domestic price and production oftextiles arebothendogenous
variables, anddomestic production isthe variable that
we
aremost
interestedin explaining. Therefore, solvingout for the reduced
form
equationand
taking logs (and suppressing time subscripts)we
have:(5) log
Q
=
tto H- a, log (Ep*(l-f-T)/pcw) -i-Ojlog (Pa/PcW)+
aj logY
+
041 -h s.Thus, domestic textile production is an increasing function ofthe tariff-inclusive importprice,
theprice of aggregate goods, and national income, and adecreasing function oftheprice of
cotton andthe
wages
paidin the textile industry.We
would
expecta^>
0, a2>
0, ttj>
0, whiletto and a^could beofeither sign. In thisequation, thedegree ofimport competitionis fully
-8-does notappearbecause import
volume
isendogenous
todevelopmentsin theUnited Statesandelsewhere.
The
domesticprice oftextiles also doesnot appearbecause it too is anendogenous
variablethat is represented
by
theexogenous
priceof cotton andwage
rate in the industry.This equationis estimatedusing annual data
from
1826 to 1860.The
quantity ofdomestictextile production (in yards)
comes
from
Davis and Stettler(1966, p. 221). This seriesis theaggregate output oftextiles in
New
England,butNew
England
accountedforover70
percent oftotalU.S. output aroundthis time
(Temin
2000, p. 122).New
England
alsocontainedvirtually all ofthe large-scalecotton production inthecountrythathas been thefocus of
historical attention.
The
U.S. import price ofBritish textiles istaken as theexportunit value, asdescribed above.
The
tariffrate is based onour calculation in Figure 1.We
ignoretransportationcosts,
which
as Harley (1992, p. 566) notedwould
add lessthan halfacent per yardto the landedcost ofBritish cloth; any changes intransportation costs are picked
up by
the time trend orarerelegatedtothe eiTortemi.
The
dollar-poundsterlingexchange
rateis thatofthe 60-daybills ofexchange
providedby
Lawrence
Officer(forpublication inthemillennial edition of HistoricalStatisticsofthe UnitedStates). U.S. laborcosts intextileproduction isthe average annual earnings perfull-time
worker from
Layer (1955, pp.46-47),which
is highlycorrelated with thelesscomplete
wage
series in Zevin (1971).The
aggregate price index istheconsumer
priceindex
from
David
andSolar (1977) andreal U.S.GNP
isfrom
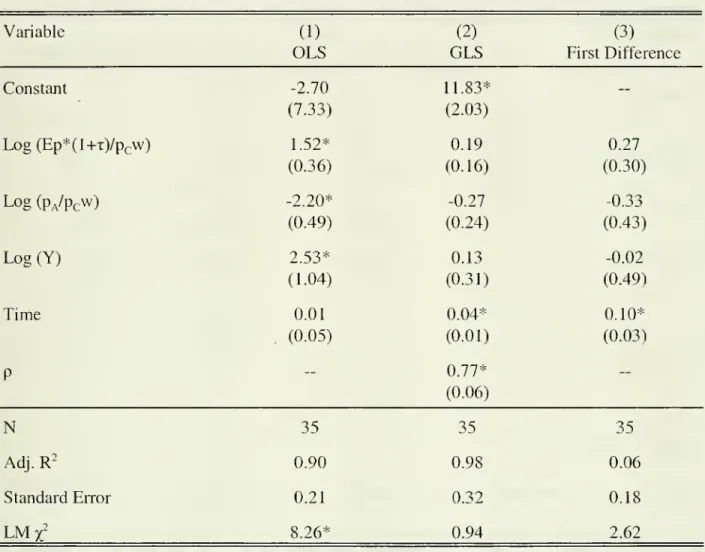
Berry (1988).Table 2 presentsthe estimationresults.
The
firstcolumn
focuses ontheOLS
results.The
coefficient a, is estimated tobe 1.52,
which
indicates that a ten percentreduction in the relativeprice ofimports
would
be expectedto reducedomestic outputby
about 15 percent. Thisis a very
-9-from 69
percentto 25 percentdue largelyto the elimination oftheminimum
valuations. Thiswould
beequivalent to a26percent decline in the priceofimported textiles, calculated as(1.25-1.69)/1.69=-0.264.
Such
a changein relative priceswould
implya40
percent declineindomestic output,
nowhere
nearwhat
was
actuallyobserved duringthisperiod. Inaddition, thecoefficient a2 carried the
wrong
sign andperversely impliesthat a decreasein the relative priceofother
consumer
goodswould
increase domestic textile output.The
coefficienton
the logofincome
plausiblyimplies thatdemand
isincome
elastic.However,
theLagrange
multipliertest statisticfor first-orderserial correlationissignificant. Serial correlation impliesthat
OLS
is notefficient, thatthe coefficientsmay
bebiased, and thetest statistics are invalid.
Column
(2)presents the generalleast squares(GLS)
estimates thatcorrect forserial correlation
by
allowing8,=
ps,.i+
e[.These
estimates are not unbiasedbut are consistent and asymptoticallymore
efficient thanOLS.
When
this is done, thecoefficient on the relative priceofimportsfalls to 0.19. It also is estimated
more
precisely,allowingus torule out thehypothesis thatthe coefficientis large. It isnotsignificantly different
from
zero (noeffect ofthetariff) andis significantlylowerthan one (proportional effect ofthetanff).
Column
(3) presents the results for afirst difference specification,which
eliminatemost
oftheserial correlation whilepreserving theOLS
standarderrors and test statistics. In this case,the coefficient
on
the relativeprice ofimportsis 0.27, similartotheGLS
estimate, andalsoinsignificandydifferent
from
zero. Ifwe
takean elasticityaround0.25 asbeing ourcentralestimate, thenthe
Walker
tariffwith its26
percentreduction in the relative price ofimports
-10-we
cannotrule outthat the effectis zero.This
modest
effectismore
consistentwith the observed growth indomestic output of 1percentin 1847.
What
accounts for thedifference between theestimatedandthe actual changeinoutput? In
column
(2), the key determinantofdomestic outputis simplythe timetrend,which
indicatesthat output
would
increase4 percenta year, on average, holding otherfactors fixed.Similarly, in
column
(3), the coefficient on time (here aconstant in thefirst differencespecification) indicates an 10 percent annual increasein domesticoutput. Regardless ofthe
relative price of imports, or even changes innational income, there
were
strongfactors pushingAmerican
outputhighereveryyear.^ Therefore, the effectofthe tariff-inducedchangeintherelative price
would
be almost completelyoffsetby
the trend increase in domestic production.What
would
bethe impact ofacompletetariffelimination? In thiscase the relative priceofimports
would
fall 41 percent.Given
an elasticity ofabout 0.25,thiswould
translate into a 10 percent decline in domestic output. This, insome
sense, is the worst case scenariofrom
thestandpoint ofdomestic producers.
While
importswould
surge as a result, and theimport marketshare
would
increase dramatically, the level ofdomestic outputwould
not fall substantially. Thisresult is alsoquite different
from
Harley,who
conjectured that free tradewould
have reduced domesticoutputby 90
percent, that itwould
have reduced the U.S. share ofthe marketto about10percent ofconsumption.
Do
we
actuallyobserve such largechanges in relativeprices?The
answer
is yes: inthe1840sthe relativeprice ofimports fell
by
nearly50
percent. Thus, such largechanges are partofthetime series datawith v^'hich theestimated response is calculated.
-11-An
alternative approach to solving outtheendogenous
variablesand estimatingareducedform
isto accountfor theendogenous
variablesby
two-stage leastsquares estimation. This approachwould
takeEp*(l+T)
asexogenous
but treatthe domestic price oftextiles (p) asendogenous
and use asinstruments such variables as the price of cotton andthedomesticwage
rate in the textileindustry.
The
domestic textile priceis that ofRussianbrown
sheeting, inNew
York, taken
from
Zevin (1971,p. 134); the results are essentiallyunchanged
ifwe
usethealternativecotton sheeting price series in theU.S.
Bureau
ofCensus
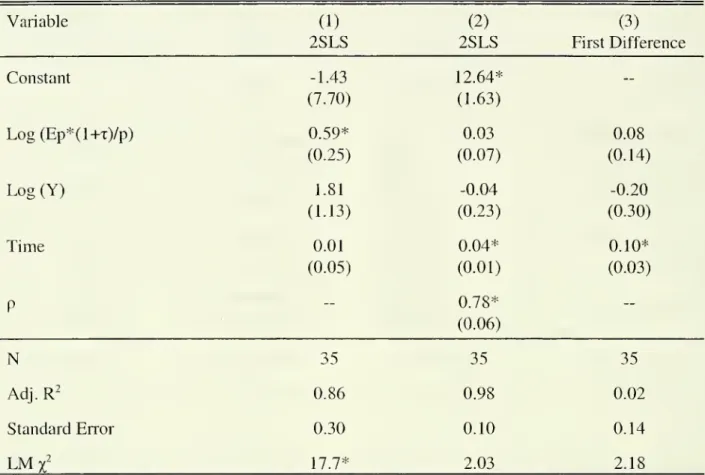
(1975, seriesE-128).Table 3 presents
some
econometric resultsfrom
this specification.The
first is a simple2SLS
regressionwhich
yields anelasticity ofdomestic output with respectto the relative price ofimports ofabout0.6. This implies thatthe
Walker
tariffof1846would
reduce domestic outputby
16 percent. Yet once again this specification is afflictedwith serial correlation.Column
(2)and
column
(3)present theinstrumentedGLS
and
first difference specifications that yieldanelasticity (againstatistically insignificantly different
from
zero) ofabout 0.05. Thiselasticityimpliesthatthe
Walker
tariffwould
reducedomestic outputby
just 1 percent,which
is verysmall, butperhaps accurate in lightofthe actual historical experience.
Due
to the smallness ofthe estimatedelasticity,we
cannot ruleout acase inwhich
changes in the relative price ofimports
would
haveno
effect on domesticproduction. In resultswe
do
notreport, however,we
find that changes in the relative priceofimports didhave a largeand statisticallysignificant effect
on
thevolume
of imports. (Theestimated elasticityis around2.5.) This impliesthatthetariff
was
quitesuccessful atreducing import volume, butthat asignificant increaseinimport
volume would
nothave detractedmuch
from
thedemand
for
-12-2 and3 (as
amounts
andas sharesofU. S. consumption).But
the growthofU. S. production,also
shown
inFigure 2, continuedunabated.As
the nextsectionpointsout,this isbecause theproduct
mix
ofdomestic andforeignproducerswas
quite different, implying thattherewere
limited opportunitiesto substitute theproducts foroneother in consumption.
4. Interpretingthe Results
The
results oftheprevioussection supportthe conclusion that atariffreductionreducedthe relative price of imports,and that this reduction, while stimulatinggreaterimports,had onlya
modest
effecton domestic production. That import competition had aminor
effecton domesticproduction is supported
by
our observation ofwhathappened
in 1846when
the cotton dutieswere
cut drastically, imports surged, and domestic outputremained high.There is
no
contradiction inthefinding that U.S. imports of cotton textiles aresensitive tothe relative price ofimports whereas domesticproduction isnot. This apparentparadox merely
suggests thatdomesticallyproducedtextiles and importedtextiles
were
different products thatwere
farfrom
perfect substitutes forone another. Britain specialized in finercotton goods whileAmerica
specialized in heavier, standardcloths.As
Zevin (1971,pp. 126-127)noted, "importsfrom
Britain and theproducts ofNew
England
mills tended to fall into quite distinctproductclassifications. . .
The
importswere
largelyginghams,woven
in intricatepatterns towhich
thepower looms had
yetbeen adopted.New
England
power looms were
supplyingplainweaves
—
sheeting, shirting, and,
somewhat
later, twills—
usuallymade
oflower countyams
than theBritish cloths." In fact,the
mean
countofyam
spun inEngland was
over50in theearly 1830s,
-13-counts spun in the
two
countries: over90
percent oftextileproduction in Lancashirewas above
20
count, whilemore
than 80 percentof outputinNew
York
was below 20
countat thistime(Temin
1988, p. 896).As
aresult, any growth inimports did not necessarilycome
atthe expenseofdomestic production.
Thisdoes not
mean
that theU.S. industrywas
completely unaffectedby
the surgeinimports
from
Britain as aresultofthe1846
tariffreduction.The
tariffaffected themix
of tradedgoods
atthemargin,forcingsome
domestic adjustments.Domestic
producers ofhigherquality,highercount goods wereforced to adapt tothe
new
competitionby
shifting theirproductmix
toward lower count, lowerquality goods. Stettler(1970, p. 224) reportedthattheratio of
low
count to high count yards producedby
his sample of firms rosefrom
2.07in 1843-44to 2.58 in1847-48.
He
notedthathigh countmillsincreasedtheiroutput rapidly in 1843-44 (afterthe tariffincrease in 1842) and
much
lessrapidlyin 1847-48 (afterthetariffreduction in 1846). But, forthe industry as a whole, theimports triggered only
minor
adjustmentsbecausemost
U.S. firmswere
notproducingfinergoods.^Fortheirpart, British producers did not shift
away
from
specializingin finerproductsandbegin producingcoarserproductsjustbecause the
American
marketopened
up. (The UnitedStates only took about 10 percent ofBritain's textileexportsduringthis period.) Britain
*" There
may
have beena slightlygreaterconcentration offiner
good
producersinPennsylvania,
which
would
have impliedsome
regional variation in theadjustmenttothelowertariff.
The
number
ofyardsperpound, an indicationofthe cloth quality,was
similarin all states in 1831, except forPennsylvania(Temin
1988, p. 895). Therewas
also a slightfall inPennsylvania's share of U.S. cotton manufactures between the
1840
and1850
censuses. ButScranton's account ofthe textileindustryin Philadelphiadoes not assign a large role to thetariff there.
One
prominent cotton mill closed attheend
ofthe 1840s, but itsowner
died, and itis hard
-14-apparently did attemptto export
some
plainer cloth,but the venture did notsucceed/The
priceof cotton textiles exportedtotherest ofthe world
was
about 5 centslowerthanthose exported tothe United Statesin the late 1830s, but
were
only about 2cents cheaperin the late 1840s. Thisindicates thatBritain
was
notexportingto othermarkets large quantities oflower count goodsthat
American
producers had specialized in. Therefore the scope for British producersto adjusttheirexport
mix
totheUnited Statesby
shiftingdown
tolower count goodswas
limited. Finally,although textile imports
from China
andIndiaroseafter the 1846 tariffreduction, theamounts
were
very small in comparison to importsfrom
Britain.Our
conclusion also isin accord with theprevioushistorical literature,which
was
skeptical ofthe tariffsimportance tothe industry.
Ware
(1931, p. 106)concluded that coarsegoods "neverreallyneeded protection, and since 1833 even high tariffadvocates had admitted
thattheycould stand alone, forordinary 'domestics' could be
made
sufficientlycheaplyin theUnitedStates to completesuccessfully with the producerof other countriesin foreign markets."
One
contemporary observed in 1850that "thebusiness of cotton manufactureswas by
thattimeso firmly established as tobe little affected by changesin legislationin regardtoduties on the
coarserfabrics requiredfordomestic consumption, to
which American
machineryhad
beenadapted" (quoted in
Copeland
1912, p. 15).This conclusion
had
been the consensus formany
decadesuntil the recentwork
ofBilsandHarley.
As
discussedin the introduction,using cost datato determine thecompetitive^
Stanwood
(1903,II, pp. 90-91)writes that "it is admitted thatthe
new
tariffcaused littleinjuryto cotton manufactures . . . large quantities ofplain cloth
were
importedin 1847, but thequality
was
sodistinctly inferiorto thatofthedomestic goods that the venture resulted in a loss.In fact,except for fine goods, laces,embroidery, and the like, the
American
manufacturerhad
the
-15-position ofthedomestic industrycan be problematic. Indeed, afterexamining the
Montgomery
costdatathat Harley relies on,Batchelder (1863,p. 91)
conceded
that costs appearedto be lowerin Britain than in
American
foreverything butmotor
power, yet still concluded that "it isquestionable whether
heavy
goods, such as drillmgand sheeting,which
make
up
averylargeproportion ofthe
consumption
ofthiscountry, can beproduced cheaperthan inthe UnitedStates."
5.
The
Tariff of1816
We
haveshown
that thetariffwas
not cntical to theAmerican
cotton industry in the1830s and 1840s. But Appleton claimedthattheTariffof 1816
was
a crucial factorin theindustry's earlierdevelopment.
What
canwe
say aboutthis earlierpenod?
We
cannot useeconometric techniques for the earlierperiod both becausethe data are very scantyand because
thevagaries of
war
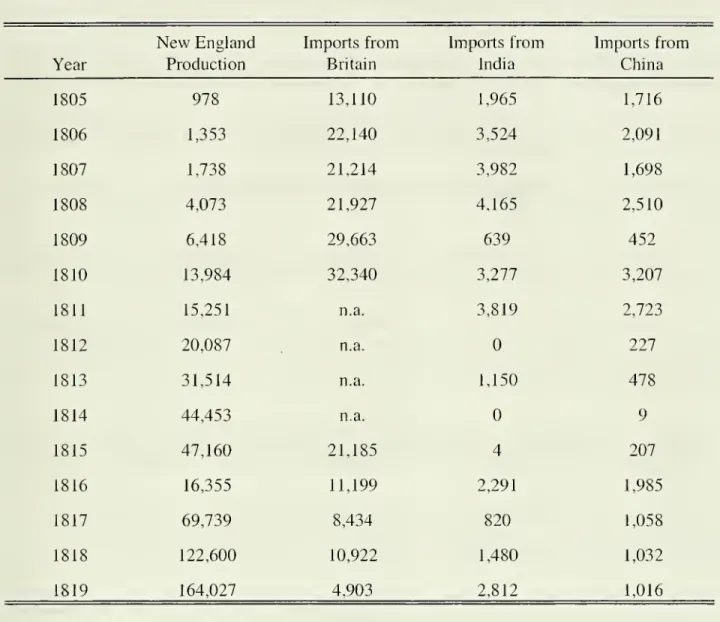
and peace introduceda lot of noise into any time series.Some
available dataareshown
inTable 4.We
obtainedthe value ofdomestic textileproduction
by
takingdomestic production inyardsfrom
Zevin (1971, p. 123) andmultiplying itby
the domestic price oftextiles inthe U.S.Bureau
oftheCensus
(1975, series E-128). Britishimports
were
recorded in variousparliamentaryreports. Imports from othercountries are harderto find.
They
were
taxed at an ad valorem rate, asshown
in Table 1, andthegovernment
lumped
all importssubject to a given tariffratetogether. In other words,there is
no
way
to distinguishcottontextile imports
from
Indiafrom
otherimportsfrom
Indiataxed atthesame
rate.American
imports from India and
Chma
were
probably notverydiverse, however, andit is likely that the
-16-cotton textiles, as Stettler(1970, p. 214) assumed.
The
data inTable4
record the totalimportsfrom
India andChina
subject to thetariffat therate paidby
cotton textileimports. Ifinaccurate,theyare overestimates ofthe cotton imports.
Itis apparent thatthe importswere verysubstantial
compared
to domestic production atthebeginning ofthecentury.
Most
ofthe cotton textilesconsumed
in theUnitedStates beforethe
Embargo
of 1808were
imported.Domestic
production outside the Waltham-style firmsinMassachusetts is omitted
from
Table4,butit cannot havebeen largeenough
to alter thisconclusion. This condition,in anycase,
was
short-hved.Domestic
productionbegan to riserapidly starting soon aftertheEmbargo
of1808was
instituted in
December
ofthat yearand continuingunderthe protection affordedby
wartimeconditions. Imports
from
India andChina
fellin 1809 andfollowing years, although they revivedbrieflyin 1810-11 as the
embargo
was
relaxed. In the yearsbefore hostilitiesbetween
BritainandtheUnitedStates, imports
from
Britain continuedunabated.They
presumably fell sharply duringtheWar
of 1812. In the protectedenvironment ofinternational hostilities, themodem
cottontextile mdustryof
New
England
grew by
an order ofmagnitudefrom
1809 to 1815.With
peace, however,came
disaster,as domestic productionfellby
two-thirdsin 1816.Although
most
historians talkofdrastic price falls as British importswere
sold atauction, thepriceof cotton cloth continuedits
downward
trendwithout anybreak.The
dramatic fallwas
inproduction.
The
New
England
cotton mills produced only about one-third asmany
yards offabric in 1816 as in 1815; production collapsedbackto the level of 1811 (Zevin 1971, p. 123).
It is nothard tosee FrancisLowell and the BostonAssociates anticipating disaster andruin.
-17-"thecombination ofthe post-war slump, the
dumping
ofBritish goods on theAmerican
marketafterthe peace,
and
thecollapse ofthe western currency sentnumbers
ofthe oldproducers tothewall. 'Halfthe spindles' in the vicinityofProvidence andFall River
were
said to be idle in1816."
The
banking andcurrency problems in the western United States cut sharplyinto thedomestic
demand
fortextiles andleftmany
manufacturerswith debtsfrom
unpaid shipments.The
import surgethat followedpeace in 1815 exacerbatedthe situation.The
value ofBritishcottonfabric exportedto theUnitedStates in 1815
was
over$20
million, almosthalf the value ofdomestic productionin thatyear.
We
have notbeen able to findrecords ofBritish cotton importsinthe yearsjust before 1815, but theimports fell
by
halffrom
1815 to1816
and stayed farbelow
the 1815 level.
The
importsshown
inTable 4from
IndiaandChina were
not largeenough
tohave causedthe dramatic contraction in domestic production, but theyclearly
show
theeffect ofpeace
by
rising sharply in 1816.The
dramatic (ifshort lived) decline in U.S. production suggeststhat domesticproducerswere
farmore
responsive toimports than theywere two
or three decades later, butthisis ahighlytentative conclusion.
Thorp
(1926, pp. 117-118) describedthe year 1815 asone
of"financialpanic" and 1816 as a "depression."
And
recordedprices did not collapsein 1815 or 1816 eventhough they
were
fallingsteadilyfrom
theirpeak on
an annual basis in 1814.Although
textileproducerscouldnotdo
anything about thegeneraleconomic
slump, theycouldtrytostop imports. Lowell appealed toCongressfortariffprotection, as recounted
by
Appleton.
He
got it, andcotton importsfrom
Asia fell, although they did not vanish asshown
inTable 4. Instead, they fellback
from
theirpeak
and did not share in the growth ofdemand
as the
-18-theirvaluein 1815.
Even
in 1847,when
the tariffwas
reduced sharply, imports were only abouthalf as large in value as theyhad been in 1815, although they didexceedthe 1815 yardagefor
onlythe thirdtime since 1815 (Great Britam 1847-48, p. 325).
As
shown
inTable 4, domesticproduction revived quicklyand
resumed
itsrapid expansion.We
draw
two
highlytentative conclusions from thesefragmentarydata. First, theAmerican
cotton industry probablywas
protectedby
theTariffof 1816.The
tariffextendedtheprotection afforded
by
embargo
andwar
toenable theindustryto grow. It ispossiblethattheindustrial growth achievedduring the years ofconflict withBritain could havebeen erased
by
free trade afterthe endofhostilities. SinceLowell
moved
with great dispatchto forestall thiseventualityand general
economic
conditionsimproved
thereafter, thiscounter-factual doesnothave afirmbase. There
was
onlyone yearinwhich
the industry facedforeign competitionwithout ahigh tariffafterits initial growth.^
Second, British imports
were
decreasedby
thetariffof 1816, despiteLowell's cunningdesign ofthe
minimum.
The
British appearto have specializedin higherqualityexportsto theUnited Statesat leastpartlyin response tothe
American
tariffstructure.The
differencein qualityofdomestically producedand imported cotton inthe 1830s and 1840s noted above
may
havebeen partly the result ofthe tariff. Ifso, therobust nature ofthe domestic industryinthe faceof
imports inthe 1830s and 1840s
may
have been partlythe result oftheTariffof 1816 in shapingthenature of
Anglo-American
trade incotton textiles.^ Indeed,
Ware
(1931, p. 72) argued that "Thereis also
no
question that domesticsheetings were actually in needof
no
protection, forbefore thepassage ofthe [1816] tarifftheWaltham company
was
enlarging its business in order to meet a rapidly growingdemand."
Zevin (1971, p. 128)concluded that "the tariffmade
no
significant contnbutionto the secular
-19-6.
Conclusions
This paperhas
produced two
strands ofevidencein support ofthefindingthatAmerican
textilemanufacturers were well established
by
the 1830s. First, there isthe actual response ofthe industrytothesharp tariffreduction of 1846. Imports surgedas aresult,butdomestic
production appears tohave been virtuallyunaffected. Second, usingtime series data,the
estimated effectofchanges inthe relative price ofimports on domestic production appearsto be
small.
Both
pieces ofevidence are consistentwith one anotherand
suggest, as historicalcontemporaries observed, that British
and
American
productswere
quite differentfrom
oneanother.
We
conclude that high tariffswere
notanessentialcomponent
ofthe survival andsuccess ofthe laterantebellum domestic cottontextile industry, although theearlycotton
-20-Figure 1:
Average
Ad
Valorem
U.S.Tariffon BritishTextileImports,1816-1860
0.8 0.7 0) 0.6 ra 0.5 E Q) O 0.4 CO > to 0.3 0.2
-21-Figure 2: Cotton Textiles:
New
England
Productionand U.K.
Imports,1825-1860
1000000 800000
V
600000 -oo
400000p
200000VS.Production U.K.Imports
Figure 3: ImportsofCottonTextiles
from
UnitedKingdom
as Share ofU.S. Market,1825-1860
-22-Table
1: U.S. Tariffon Imported Cotton Cloth
Date ofTariffAct Description
Minimum
ValuationAd
Valorem
RateApril27, 1816 Cottoncloth(until 7/19) 250 peryard
25%
Cottoncloth(after7/19) 250 peryard
20%
May
22, 1824 Cottoncloth 300 per yard25%
May
19, 1828 Cottoncloth 350 peryard25%
July 14, 1832 Cottoncloth,printed 350 per yard
25%
Cottoncloth, white 300per yard
25%
March 2, 1833 Cottoncloth (after 1/34) 9/10 of excess of1832rateover
20%
Cottoncloth (after 1/36) 8/10 of excess of1832rateover
20%
Cottoncloth (after 1/38) 7/10 of excess of1832rateover
20%
Cottoncloth (after 1/40) 6/10 of excess of1832rateover
20%
Cottoncloth (after 1/42) 3/10of excess of1832rateover
20%
March30. 1842 Cottoncloth, printed 300peryard
30%
Cottoncloth, white 200 peryard
30%
July 30. 1846 Cottoncloth None
25%
March3, 1857 Cottoncloth None
24%
-23-Table
2:Reduced-Form
Estimates ofDomestic
ClothProduction
Dependent
Variable:Log
ofDomestic
ProductionVariable (1) (2) (3)
OLS
GLS
First DifferenceConstant
Log
(Ep*(l-i-T)/pcW)Log
(Pa/Pcw)Log(Y)
Time
-2.70 11.83*—
(7.33) (2.03) 1.52* 0.19 0.27 (0.36) (0.16) (0.30) -2.20* -0.27 -0.33 (0.49) (0.24) (0.43) 2.53* 0.13 -0.02 (1.04) (0.31) (0.49) 0.01 0.04* 0.10* (0.05) (0.01) (0.03)—
0.77* (0.06)—
35 35 35 0.90 0.98 0.06 0.21 0.32 0.18 8.26* 0.94 2.62N
Adj.R2
StandardErrorNote: * indicates significance atthe 5 percentconfidence level. Standard errors have been
-24-Table
3: Instrumental-Variable Estimates ofDemand
forDomestic
ClothDependent
Variable:Log
ofDomestic
ProductionVanable
(1) (2) (3)2SLS
2SLS
FirstDifference ConstantLog(Ep*(l+x)/p)
Log
(Y)Time
-L43
12.64*—
(7.70) (1.63) 0.59* 0.03 0.08 (0.25) (0.07) (0.14)L81
-0.04 -0.20(LIB)
(0.23) (0.30) 0.01 0.04* 0.10* (0.05) (0.01) (0.03)—
0.78* (0.06)—
35 35 35 0.86 0.98 0.02 0.30 0.10 0.14 17.7* 2.03 2.18N
Adj.R^
StandardErrorLMr
Note: * indicates significance at the 5 percentconfidence level. Standarderrors have been
corrected forheteroskedasticity. Instruments include logofincome, log ofprice of
raw
cotton,
-25-Table
4: U.S. ClothProduction
and
Selected Imports, 1805 to1819
(thousands ofdollars)
New
England
Importsfrom
Importsfrom
Imports fromYear
Production Britain IndiaChina
1805
978
13,110 1,965 1,716 1806 1,353 22,140 3,524 2,091 1807 1,738 21,214 3,982 1,698 1808 4,073 21,927 4,165 2,5101809
6,418 29,663639
452
1810
13,984 32,340 3,277 3,207 1811 15,251 n.a. 3,819 2,723 1812 20,087 n.a.227
1813 31,514 n.a. 1,150478
1814
44,453 n.a. 9 1815 47,160 21,1854
2071816
16,355 11,199 2,291 1,985 1817 69,739 8,434820
1,058 1818 122,600 10,922 1,480 1,032 1819 164,027 4,903 2,812 1,016Sources:
New
England
production (in yards)from
Zevin (1971), p. 123, multiplied bythedomesticprice ofRussian
brown
sheetingfrom
U.S. Bureau oftheCensus
(1975), Series E-128.Imports
from
Britain:from
Stettler (1970), p. 108, andGreat Britain (1847-48). Other Importsfrom
U.S. Congress (1832-34), Vols. I,H.
-26-References
Batchelder, Samuel. Introduction andEarly Progress ofthe Cotton Manufacture ofthe United
States. Boston: Little
&
Brown,
1863.Berry,
Thomas
Senior. "Production andPopulation Since 1789, RevisedGNP
Seriesin ConstantDollars." BostwickPapers No. 6.
Richmond,
VA: The
Bostwick
Press, 1988.Bils, Mark. "TariffProtection and Production in theEarly U.S. Cotton Textile Industry."
Journal of
Economic
History44
(December
1984): 1033-1045.Copeland, Melvin T.
The
Cotton Manufacturing Industryofthe UnitedStates. Cambridge:Harvard UniversityPress, 1912.
David, Paul, and Peter Solar.
"A
BicentenaryContribution to theHistory ofthe CostofLivinginAmerica," in Research in
Economic
History. Greenwich,CT:
JAIPress, 1977.Davis, Lance, andH. Louis StettlerIH.
"The
New
England
CottonTextile Industry, 1825-1860: Trends and Fluctuations." Output,Employment,
andProductivity inthe United States after1800. Studies in
Income
and Wealth, Vol. 30.New
York: National Bureau ofEconomic
Research, 1966.Great Britain,
House
ofCommons.
AccountsofCottonWool
Imported, and ofCottonManufacture, and Cotton Twist,
Yam
orThread
ExportedinEach Year
1815 to 1847. SessionalPapers 1847-48, Vol 58.
GreatBritain,
House
ofCommons.
AccountsofCottonWool
Imported, and ofCotton Manufacture, and Cotton Twist,Yam
orThread
ExportedinEach
ofthe Three Years 1848, 1849. and 1850. Sessional Papers 1851,Vol
53.Great Britain,
House
ofCommons.
Retums
of Quantities and Declare Value Importedfrom
theExported tothe United States. Sessional Papers 1856,
Vol
55.Harley, C. Knick. "Intemational Competitiveness ofthe
Antebellum American
CottonTextileIndustry."
Joumal
ofEconomic
History52 (September 1992): 559-584.Helm,
Elijah."The
Cotton Trade oftheUnitedKingdom." Joumal
ofthe Royal StatisticalSociety 32
(December
1869): 428-437.Grossman,
Gene.M.
"Imports as aCause
ofInjury:The
Case
ofthe U.S. Steel Industry."Joumal
of IntemationalEconomics
29(May
1986): 201-223.
-27-Ameica
. Newburyport:Marss
and Brewster, 1841.Layer,Robert G. Earnings ofCottonMill Operatives, 1825-1914. Cambridge: Harvard
UniversityPress, 1955.
Montgomery, James
A.A
Practical Detail ofthe Cotton ManufactureoftheUnitedStates ofAmerica
.Glasgow:
J. Niven, 1840.Scranton, Philip. Proprietary Capitalism:
The
TextileManufacture at Philadelphia, 1800-1885 (Cambridge:Cambridge
UniversityPress, 1983).Stanwood,
Edward..American
Tariff Controversies in theNineteenth Century. 2 vols. Boston:Houghton,
Mifflin,&
Co., 1903.Stettler,
Henry
Louis, in.Growth
andFluctuations in theAnte-Bellum
TextileIndustry. Ph.D.Thesis,
Department
ofEconomics, Purdue
University, 1970.Taussig, Frank
W.
The
TariffHistory ofthe United States. 8*Edition.New
York: G. P.Putnam's
Sons, 1931.Temin,
Peter. "ProductQuality andVertical Integration in the EarlyCottonTextile Industry."Journal of
Economic
History48
(December
1988): 891-907.Temin,
Peter."The
Industrialization ofNew
England, 1830-80," inPeterTemin
(ed.). Engines ofEnterprise:
An
Economic
History ofNew
England
.Cambridge:
Harvard
UniversityPress, 2000.Thorp, WillardL. Business
Annals
.New
York: NationalBureau
ofEconomic
Research, 1926.U.S.
Bureau
ofthe Census. Historical Statistics ofthe UnitedStates,From
ColonialTimes
to1970. Washington, D.C.:
GPO,
1975.U.S. Congress.
American
State Papers:Commerce
and Navigation. Washington: Gales and Seaton, 1832-34.Ware,
CarolineF.The
EarlyNew
England
Cotton Manufacture. Boston:Houghton
Mifflin Co.,1931.
Zevin,RobertB.
"The
Growth
ofCotton Textile Production After 1815." In Robert Fogel andStanley
Engerman
(eds.).The
Reinterpretation of America'sPast.New
York: Harper&
Row,
Date
Due
MIT LIBRARIES