HAL Id: hal-00529063
https://hal.archives-ouvertes.fr/hal-00529063
Submitted on 24 Oct 2010HAL is a multi-disciplinary open access archive for the deposit and dissemination of sci-entific research documents, whether they are pub-lished or not. The documents may come from teaching and research institutions in France or abroad, or from public or private research centers.
L’archive ouverte pluridisciplinaire HAL, est destinée au dépôt et à la diffusion de documents scientifiques de niveau recherche, publiés ou non, émanant des établissements d’enseignement et de recherche français ou étrangers, des laboratoires publics ou privés.
CASE-STUDY IN KWAZULU-NATAL, SOUTH
AFRICA
Emmanuel Torquebiau, Mireille Dosso, Flavia Nakaggwa, Olivier Philippon
To cite this version:
Emmanuel Torquebiau, Mireille Dosso, Flavia Nakaggwa, Olivier Philippon. HOW DO FARMERS SHAPE THEIR LANDSCAPE: A CASE-STUDY IN KWAZULU-NATAL, SOUTH AFRICA. ISDA 2010, Jun 2010, Montpellier, France. 16 p. �hal-00529063�
ISDA 2010, Montpellier, June 28-30, 2010
1
HOW DO FARMERS SHAPE
THEIR LANDSCAPE:
A CASE-STUDY IN KWAZULU-NATAL, SOUTH AFRICA
Emmanuel TORQUEBIAU*, Mireille DOSSO**, Flavia NAKAGGWA**, Olivier
PHILIPPON**,
*CIRAD, UR 105, Pretoria, South Africa CIRAD, UR 105, F34398, Montpellier, France
Centre for Environmental Studies, University of Pretoria, 0002 Pretoria, South Africa emmanuel.torquebiau@cirad.fr
** Irc Institut des régions chaudes Montpellier SupAgro 1101, avenue Agropolis, BP 5098, 34093 Montpellier cedex
mireille.dosso@supagro.inra.fr; olivier.philippon@supagro.inra.fr; naiga333@yahoo.com
Résumé –Comment les agriculteurs façonnent leur paysage : une étude de cas au KwaZulu-Natal, Afrique du Sud.La zone d’étude est un ancien homeland qui présente aujourd’hui des paysages de type « écoagriculture », combinant des zones cultivées et des espaces naturels, protégés ou non. Ce type de paysage qui s’est progressivement constitué en conditions de pauvreté, présente à l’heure actuelle un grand intérêt, en particulier pour les populations qui l’ont créé: en raison des services écosystémiques qui lui sont liés, et en raison des revenus qu’ils pourraient leur procurer. En effet, l’analyse de l’évolution des modes de mise en valeur agricoles montre que l’agriculture n’a jamais été la seule source de revenus durant la période de l’apartheid ; le paysage actuel pourrait ainsi devenir une source de revenus complémentaires pour ses habitants, plutôt que de l’imaginer disparaître avec le développement de monocultures intensives. Ce futur devra se construire de manière collective, avec les autorités tribales et les autres acteurs du territoire.
Mots-clés : Afrique du sud, homelands, pratiques agricoles, paysage, écoagriculture
Abstract – The study area is a former homeland, where land had been historically set aside for african
communities and which happens to be today a well balanced ecoagriculture landscape combining farmed and wildlife areas, both protected and unprotected. This informal ecoagriculture landscape, developed under poverty conditions now represents a huge potential because it can support many ecosystem services and lead to the improvement of people’s livelihoods. The analysis of past and present farming practices shows that agriculture alone has never been the unique source of income. It thus appears of interest for the further development of the inhabitants to rely on these landscape mosaics for their livelihoods rather than transforming their land into large scale monocultures. This can be achieved provided collective decisions are taken that lead to a formal ecoagriculture landscape.
ISDA 2010, Montpellier, June 28-30, 2010
2
INTRODUCTION
People respond to their food, shelter and income needs by performing different activities that shape the landscape of which they are part. Agriculture, including rangelands, covers about 40% of the world’s terrestrial surface (Gordon et al. 2010) making it the human activity which affects the greatest proportion of the land surface. Agricultural land uses therefore influence the structure and function of many ecosystems.
It is now accepted that satisfying people’s livelihoods with agricultural production and protecting biodiversity need not be antagonistic visions (Robson 2007; Scherr and McNeely 2007). Ecoagriculture landscapes are places where people and nature meet in order to sustain rural livelihoods. Ecoagriculture intends to contribute to the on-going debate raised by the Millennium Ecosystem Assessment that ecosystem services can be provided by man-managed agroecosystems, and not only by natural ecosystems.
The present study was conducted against the above framework. Our main hypothesis has been that farming practices play an important role in shaping the landscape. The analysis of farming systems in this context is a type of ecosystem analysis that incorporates natural history (Patriquin 2001) and human history, presents landscape structure and makes a prediction into the future of both the farming systems and ecosystem services therein. This was implemented in the particular situation of a former South African homeland, where land had been historically set aside for African communities and which happens to be today a well balanced ecoagriculture landscape combining farmed and wildlife areas, both protected and unprotected. The area has also been recently classified as part of a biodiversity hotspot and belongs to a transfrontier conservation area where human activities and nature conservation can be combined. We specifically investigated how this situation can be turned into an advantage for thelocal residents who are small scale farmers often below the poverty line.
1. MATERIALS AND METHODS
1.1 Study area
The study was conducted in part of the Mathenjwa Tribal Authority (MTA), at the extreme North of the KwaZulu-Natal Province, South Africa (lat 26°48’S to 26°54’S; long 32°00’E to 32°09’E; Figure 1 and Figure 2). The area belongs to the savanna biome of South Africa (Mucina and Rutherford 2006), with an annual rainfall ranging from 500 mm in the Eastern lowlands (100 m asl) to 800 mm in the Western highlands (600 m asl). There is a markedly dry spell from June to August while the wettest months are the warm, summer months, from November to March. Dramatic year-to-year rainfall variations are common. Mean annual temperature varies from 22 (lowlands) to 20°C (highlands), with mean maxima and minima around 30 and 10°C respectively. Mean annual potential evaporation ranges from 1900 to 1800 mm along this same East West gradient. Areas with similar climate and vegetation in South Zimbabwe and West Mozambique have a potential evapotranspiration estimated at 1700 mm (Penman approach; Torrance 1972).The study area can be characterised as a dry area according to the UNCCD definition. Most soils are shallow lithosols developed on rhyolite bedrocks, and in the lowlands one finds deeper soils developed locally on basalts. The main vegetation type is a wooded savanna (open bushveld) with dominant Acacia and
Combretum trees in the low and medium altitude lands, becoming more open towards the
ridge plateaus. Closed canopies can be found in a number of remote areas while mixed forests thrive in deep valleys. Shallow soils are covered with thickets of xerophytic plants such as Aloe marlothii. The area is part of the Maputaland-Pondoland-Albany biodiversity hotspot and of the Lubombo Transfrontier Conservation Area between South Africa, Mozambique and Swaziland. It harbours many endemic plants and comprises of one of the most endangered vegetation types in South Africa, classified as vulnerable (conservation target: 24%; actually conserved: 4% to 10 % ; Mucina and Rutherford 2006). Farms are scattered in the landscape, with both near-by (including homegardens) and distant plots. Virtually all people grow maize, with other crops irregularly distributed. Livestock is present,
ISDA 2010, Montpellier, June 28-30, 2010
3
mostly grazed in distant lands or freely roaming. The resulting landscape is a beautiful blend of farmed and wild zones on a hilly terrain showing obvious potential for a long-term, balanced environmental management. Jozini municipality statistics give an average 5 people per household (but about 10% of households have more than 10 members) and a population of about 37,000 people for the entire MTA, giving a population density of about 67 people km-2. Gender proportions show an average 82 men for 100 women (across all ages). About 48% of households have an annual income of less than US$ 660 while 10% of the adult population is considered employed, 15% unemployed and 75% not economically active.
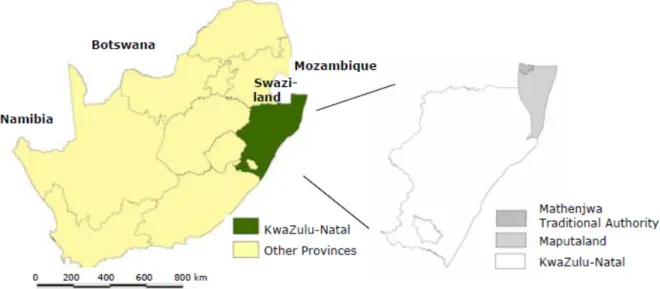
Figure1. Map of South Africa and its provinces showing KwaZulu-Natal, Maputaland and the
Mathenjwa Traditional Authority
Figure 2. Map of Mathenjwa Traditional Authority showing the limits (red) of the study area
and UG CCA boundary
A
B
AB:
transect W/E (Figure 3)ISDA 2010, Montpellier, June 28-30, 2010
4
The MTA land covers approximately 547 km2 out of which 19% is under the provincial nature
conservation service (Ezemvelo KwaZulu-Natal Wildlife Service) in the Ndumo Game Reserve and a further 6.4% under the “Usuthu Gorge Community Conservancy Area” (UGCCA). Another 8.2% are designated to become a “wilderness area” (pending community agreement), bringing the area under conservation to 33.6% and leaving 66.4% for human establishments. Since 2002, the MTA land is part of the Lubombo Transfrontier Conservation Area (Lubombo TFCA), under an agreement signed by the Governments of Mozambique, South Africa and Swaziland. Southern Africa TFCAs are governed by the Peace Parks Foundation status, defining a TFCA as “An area or component of a large ecological region that straddles the boundaries of two or more countries, encompassing one or more protected areas as well as multiple resource use areas” (www.peaceparks.org). This status gives TFCAs the possibility of including both protected and human habitat areas, making them innovative situations where the questions of nature conservation can be addressed against the framework of human use of natural resources. As a consequence, part of the MTA is under conservation within the limits of the recently established UGCCA designed to be managed by the community for the improvement of people’s livelihoods.
About two thirds of the households are located in the west, upper zone, less than a third in the lower zone and only a tenth in the middle, east zone. Higher population in the upper zone is congruent with higher rainfall, a smoother topography (dissected plateau) and deeper soils. Wealth status appears better here than in the other zones, with bigger, iron-roofed houses, and more schools, clinics and boreholes. The middle zone is the less endowed, showing no secondary schools, clinics or electricity. In this zone, people have to walk long distances to reach water and other resources and are more dependent on natural resources from the wild, with more natural vegetation available than in the upper zone. Although it is much drier and with poorer, stony soils, the lower zone is better equipped with infrastructures than the middle zone and located along the main road as well as along the UGCCA access road.
1.2. Methods
We used FAO’s (1999) Guidelines for agrarian systems diagnosis as a methodological framework. The agrarian diagnosis involved the following steps: (i) zoning (identification of homogenous agro-ecological zones), (ii) landscape analysis (identification of within-zones units according to ecological and socio-economic characteristics, (iii) agrarian history and dynamics (analysing historical and present trends explaining landscape changes), (iv) farming systems analysis (analysing farmers strategies) and (v) ecosystem services assessment (investigating in-kind benefits obtained from the natural environment by farmers and other stakeholders). We utilized aerial photographs and satellite imageries together with field data and secondary information to perform the zoning and landscape analysis. Data and other observations were obtained from May to July 2009 through formal questionnaires with farmers (n =104) and semi-structured interviews (n=38) as well as interviews with key informants (local leaders, agronomists, conservation officers, elders) and focus group discussions (n=3). We used local interpreters, carefully trained previously, for translation from IsiZulu to English and vice versa. Given that our objective was to detect major factors explaining landscape structure at a coarse grain, we did not perform any statistical analysis on quantitative data but rather report qualitative findings in the form of major trends and important facts. All monetary figures are reported in US Dollars ($), using the approximate exchange rate with the South African Rand (ZAR) of August, 2009 (US$ 1 = ZAR 7.9).
2. RESULTS
2.1. Some historical facts on the Mathenjwa people
The Mathenjwa people are said to have migrated from Nyasaland (current Malawi) in the 16th
century, first reaching Swaziland then Manyiseni in the area where they still live today during the 17th century. Their territory extended up to East Swaziland and South Mozambique and
ISDA 2010, Montpellier, June 28-30, 2010
5
plateaus where they kept cattle and established trading links with Mozambique and the nearby eastern lowlands. Strong links still exist today with Swaziland, with many people in the upper, west zone claiming a Swazi rather than Zulu culture, speaking isiSwati rather than isiZulu and regularly commuting to Swaziland (no border fence) for trading or shopping. The area has been a trading route for long and several conflicts historically took place for the respective influence of the Zulu, British and Portuguese. The apartheid government allowed the land to being ruled by the Zulus, and because of regular tensions with the KwaZulu homeland government during the Mozambican civil war, even tried to give away the land to Swaziland. The idea never materialized but this shows that the area was not given high consideration except for establishing an army camp during civil unrest in Mozambique. As a result of these series of historical events, parts of today’s inhabitants are also related to the Tembe-Thonga people of Mozambique.
Since the settlement in Manyiseni, 13 chiefs (Inkosi) have ruled. The Mathenjwa people fought a war (1970) and lost land to the Mngomezulu tribe (helped by Zulus) under Inkosi Mtshelegwane. Inkosi Mbekwane (1972-2002) has remained very popular for promoting education and banning the use of fire as a land clearing tool. This latter decision has probably had a major effect on today’s landscape. The division of land amongst tribes by the apartheid government in the 1960’s and the gazetting of some areas for nature conservation (e.g. Ndumo Game Reserve; Tembe Elephant Park) led to several changes in land tenure and to land conflicts still active today and presently looked into by the Land Affairs Department.
2.2. Biophysical and socio-economic characteristics of the Mathenjwa land
2.2.1 Biophysical context
The study area shows a West-East altitudinal gradient (Figure 3) with three successive levels. The parent, acidic bedrock (rhyolite) is little weathered and frequently apparent, giving rise to shallow, stony soils. Basalt is locally present, with corresponding deeper, clayey soils with calcareous nodules in upper layers. Sand is present towards the eastern part of the area. These conditions do not represent a high agricultural potential, except for the basaltic spots. Because of the presence of acidic rocks, soils do not show a good structural stability and mineral supply to plants is not adequate. Shallow, stony soils do not retain water during the rainy season, leading to runoff and erosion on steep, plantless slopes and severe drought during the dry season. Only deep, level soils show a good agricultural potential. Water capture and erosion control schemes appear to be essential for secure good soil productivity. Soil fertility management through fallowing is only possible with long term fallows and cattle grazing in order to recover the initial low soil fertility. Nevertheless, 37000 presently people live in the area, following the isolation of former generations during the apartheid.
ISDA 2010, Montpellier, June 28-30, 2010
6
2.2.2. Land administration and household characteristics
There are two forms of administration: the Municipal Administration and the Tribal Authority. At the tribal level, the Inkosi’s leadership is hereditary and his kingdom is sub-divided into 21 communities each run by a local leader called Induna. The 21 Izindunas are elected by the people and make up the Tribal Authority (TA) which has a key role in all major decisions. The land tenure system is under customary rules: land belongs to the Inkozi who is responsible for land distribution among people. Land is granted in perpetuity, giving the tenant full control. In addition, the tribal authority land is registered under the Ingonyama Trust which functions as landowner-in-law of some 2.7 million ha of Community land spread throughout the Province of KwaZulu-Natal, to protect communal lands from evictions and make sure that land development benefits to local people and not only to would-be developers. Although power is vested in the TA, no major development is possible without the approval of the trust and neither can the trust foster development without the approval from the TA.
In the entire study area, a majority (63%) of households were headed by men, with more than 40% aged 50 years and above. Age of household head could not be obtained in about 25% of the interviews. Small and large households are headed by old people while other households have younger household heads. Fourty eight per cent of the respondents never attended school, 30% from grade 1 to grade 7, 14% from grade 8 to grade 12 and only 1% above grade 12 (no answer: 7%). The two major sources of income are government grant and farm sales, followed by external remittances. About 53% of the people mention income from the sale of natural resources (Marula beer, fuel wood, thatching grass and handicrafts). A third of the respondents could not tell what their monthly income was, mainly for lack of records, except for the government grant. Out of those who responded, 9% have an income of less than $ 63 per month, 45% between $ 63 to 126, 26% between $ 127 to 189 and 20% above $ 190.
2.2.3. Present farming practices
Today’s farms are characterized, across the 3 zones, by the omnipresence of maize, grown by 99% of the farmers, while other crops rank much lower, except pumpkins (Table 1). Maize is normally intercropped with pumpkins and water melons while other crops are grown as single crops. The average cultivable land size per household is 2.5 ha, excluding grazing land. Cropland is fenced, with both dead and live fences. Slash and burn agriculture is still practiced in places. Land opening is done by tree felling and occasionally fire. Oxen are used to prepare land or reclaim fallows, with 44% of the farmers owning oxen and the other
borrowing of renting them. Both animal manure and fertilizers are used, the former mainly around homesteads and in vegetable gardens, the latter in maize fields. Crop rotation is practiced between maize and legumes. Scattered trees in cropland and agroforestry homegardens are present but not widespread. Hired labour is sometimes used for weeding. The presence versus absence and different proportions of these common characteristics define specific cropping systems which, together with livestock systems, allow characterizing different farming systems in each zone.
Table 1. Number of people growing different
crops*
Crop Percentage of
respondents growing the crop Maize (Zea mays) 99 Pumpkins (Cucurbita maxima) 68
Vegetables (varied species) 55
Peanuts (Arachis hypogea) 47 Watermelon (Citrullus lanatus) 29 Beans (Phaseolus vulgaris) 22 Cassava (Manihot esculenta) 16 Sugarcane (Saccharum officinarum) 10 Bananas (Musa acuminata) 8 *Total adds to more than 100 because
ISDA 2010, Montpellier, June 28-30, 2010
7
2.3. Recent agricultural development in Mathenjwa land
2.3.1 Main events which have impacted land development
To our knowledge, and with the exception of the work by Kloppers (2004) that we used for some historical milestones, there is no consistent monography on the history of the Mathenjwa tribe nor on its agricultural practices. Our interviews with old people have allowed us to draw a tentative evolution of land development over the last sixty years, as shown on Table 2. The Table depicts how, through a series of historical events, transhumant livestock keepers have eventually become sedentary farmers who sometimes still own cattle. The reasons for these dramatic changes can be traced back to the isolation of the area during the apartheid and has led to modifications in land development practices which, in turn, have led to correlative transformations of the original savanna landscape.
2.3.2 Contribution of aerial photography interpretation
Recent history as it is narrated by senior people can be confirmed by the analysis of aerial photos of the area, ranging from 1942 to the present. Figure 4 shows a same location in the upper zone in 1942, 1990 and 2010 respectively. A striking feature is the increase of tree cover, virtually absent in 1942, except on steep slopes and deep valleys while trees are widespread today. The complementary analysis of aerial photos and people interviews thus confirms that tree cover development (except on steep slopes) is no older than 60 years. However, these tree covered areas are not homogeneous neither similarly distributed in the three altitudinal zones.
2.3.3. Todays’ mosaic landscape is a consequence of past agricultural development
In order to get an idea of the diversity of today’s landscapes in the area, we selected a 2.5 x 1.5 km “window” for each of the 3 altitudinal zones, along the West-East gradient shown on Figure 3. The comparison of the 3 “windows” (Figure 5) shows that a landscape mosaic, resulting from the combination of cropped land, tree cover and wooded savanna, is always present, but in different proportions. In order to understand the development of today’s mosaic landscape, it is thus necessary to analyse the origin and diversity of farming practices.
2.4. Today’s agriculture and landscapes in Mathenjwa land
2.4.1. Farming systems diversity
Table 3 is a typology of farming systems in the area, as found from farm surveys and interviews. We designed the typology so as to show linkages between farming practices and impact on the landscape. In terms of cropping practices, impact on the landscape is a function of soil fertility management. The history of changes in soil fertility management practices shows everywhere in the world the same successional stages, starting from early practices requiring large land areas such as long fallows to much localised practices such as today’s intensive use of mineral fertilizers.
As a consequence, if land management is performed through long fallows, a strong impact on the landscape follows. For instance, 1 ha of crops with a 20-year long fallow requires 20 ha of available land. If long fallows are associated with cattle, impact on the landscape is maximized because additional grazing land (depending on herd size) is required. Fallow duration can be reduced when cattle graze in the fallow land, thus providing additional organic matter to the soil and allowing a quicker soil fertility recovery. This is not the case in Mathenjwa land, where wealthy people do buy mineral fertilizers. The Mathenjwa people have actually not used soil management practices based on the interactions between agriculture and livestock. They have quickly opted for fallowless practices such as crop rotations, intercropping and mineral fertilizers, all allowing continuous cropping.
The 9 farming system types thus have a different impact on the landscape (Figure 6), function of whether or not there are cattle, of whether or not the herd is transhumant and of
ISDA 2010, Montpellier, June 28-30, 2010
8
its size. It is also a function of land size and of soil fertility management practices. However, data on the relative importance of the farming systems types and their spatial distribution are necessary to quantitatively asses the impact on the landscape. It is also necessary to know whether there are households with low income who rely on natural resources for a living (e.g. wood collection, harvesting natural products, hunting, fishing, stone collection). Finally, farming systems dynamics (i.e. change with time) is important to know.
2.4.2. Analysing today’s farming system diversity
Analysis of supplementary data
Table 4 shows that medium size households make the majority of farming systems. Although these households do get social welfare (like all other households), they need to complement their income through the collecting of products from the wild. As Figure 6 shows, it is finally type B1 which has the strongest landscape impact.
Farming systems dynamics
As shown on Table 3, the Mathenjwa territory is characterized by the coexistence of slash-and-burn, long bush fallow farming systems and intensive, continuous cropping farming systems with rotations and the use of chemical inputs. Any of these systems may or may not include cattle. This diversity in land development is the result of a recent differentiation which has occured over the last sixty years as from when the former transhumant Mathenjwa herders were forced to become sedentary crop growers because of the apartheid regime. Although the persistence of partly mobile cattle herds recalls the time of nomadic herders and although the persistence of long fallows is a mark of early changes from livestock keeping to crop growing, one can legitimately wonder whether these practices will survive and consequently, whether today’s landscape is here to stay.
3. DISCUSSION
3.1. Agricultural dynamics and present land use
Farming history as it is told by elders (who are both actors and witnesses) shows a progressive intensification. The different stages of the intensification process still co-exist today, from bushland grazing and a few cultivated fields to intensive vegetable gardens. The progressive abandonment of grazing in favour of crop growing has led to the development of a dense tree cover. Although there are many cattle, livestock breeding has never been really coupled to soil fertility management in fields. As is well known in all non-mechanized agricultural systems, soil fertility management has relied on fallowing. In the present case, because of the inherent low potential of the area, long fallows were especially important. After five to seven years of cropping, the land is fallowed for at least twenty years. It has been shown in a neighbouring area that such duration is sufficient for a tree cover to develop (Gaugris and Van Rooyen 2009). Consequently, when fallow land is brought into cultivation for the second time, it is a wooded land which needs to be cleared again. This explains the widespread use of fire and slash-and-burn mentioned by elders. While such practices were banned in 1975, they still persist locally.
The years 1970’s (about 20 years after the apartheid regime began) were a time when many people would work outside the area, especially in mines. This was an advantage for large families who could send their members to work outside and get extra income in order not to depend solely on agricultural products. These conditions have remained until the years 1990’s. Land isolation has thus generated household differentiation, with large families getting easier access to agricultural intensification inputs. When land isolation ceases at the end of the apartheid, people do not rely any more on agriculture only and household differentiation further increases. Some households further invest in agriculture (fertilizers, improved seeds, mechanization, etc.) while other survive with social welfare and long fallow-based minor cropping activities.
ISDA 2010, Montpellier, June 28-30, 2010
9
Table 2. Major milestone events of the Mathenjwa land history
ContextTime Environment Political context Agriculture Landscape impact Mathenjwa People Before
1950 1951 Authority Act Bantou Not widespread : sorghum fields near houses Slightly wooded savanna landscapes, in all 3 zones Mainly Nguni cattle keepers Years 1950
Locusts - Start of the apartheid regime (1948) - Creation of NDUMO Game Reserve - INGWAVUMA Authority Act
- Farm plots appear - Animal ploughing, contour lines, stone removal - Long fallows - Differentiated agricultural development in the 3 zones. - In the upper zone : stone lines on contours and narrow fields - Starving - Increase of cropped area - People forcefully removed from Ndumo Game Reserve Years 1960 - 1964-1965 : Drought - Earthquake - 1967 : Floods Government food aid program (yelllow maize) - Sorghum progressively substituted by maize - Line sowing of maize Wooded savannas and cultivated plots coexist, mainly in the upper and lower zones Outmigration for employment in mines (Johanesburg) Years 1970 Civil war in Mozambique Inkosi Mbekwane bans slash and burn (negatively affects cattle breeding because of increased difficulties in grazing land management) - Increase of tree-covered areas - Some land is reserved for grazing Immigration from Mozambique Years 1980 - 1982-1983 : Drought - 1984 : Floods and cyclone - Introduction of
Brahman cattle and crossbreeding with Nguni cattle - Beginning of vegetable gardening Fruit and vegetable gardens developed along rivers Years 1990 - Apparition of Lantana Camara (invasive plant) in the Middle zone - 1996-1997 : Drought - 1994: End of the apartheid regime - Beginning of social welfare grants Creation of a Community garden at Makwanga Increase of tree cover mainly in the middle zone
Cotton Project (KFCCP) and settlements in the lower zone
Years 2000 - Creation of the Lubombo TFCA (2002 and of the UGCCA (2006) - Fencing off of UGCCA (2007) - Dropping of fence between UGCCA and Ndumo Game Reserve (2010?) More Community gardens (Mabona et Magwanga) - Upper zone : Mosaic - Middle zone :Matrix of woodland, fallows and wooded savannas - Lower zone : Mosaic of wooded savannas and cultivated fields. - Abandonment of cotton fields End of cotton project
Torquebiau, E. Dosso, M. Nakaggwa, F. Philippon, O.
ISDA 2010, Montpellier, June 28-30, 2010
10
Table 3. Farming system characteristics and corresponding landscape impact
Farming system Fertility management Landscape impact
(ha under use – min. / max.)
A – Large families Crops : 5 to 10 ha Animals : Cattle, poultry Cattle utilised as drought force
B
–
Medium size familiesCrops
: <
5 ha(average = 2,5 ha) Animals : goats, pigs,
poultry, no cattle,
Cattle rented for land cultivation
C – Small families
Crops : < 1ha
(average : 0,5 ha)
Animals : Goats, pigs,
poultry, no cattle
Manual ploughing
No fertilizers => long fallow
20 to 30 years Transhumant herds Sedentary herds Fertilizers
=>
Short fallow 5 to 8 years Continuous cropping A1 A2 A3 A4 100 / 300 + > 100 ha range land 100 / 300 25 / 80 5 / 10No fertilizers=> long fallow (20 to 30 years)
Fertilizers
=>
Short fallow 5 to 8 years Continuous cropping B1 B2 B3 50 / 150 + impact on range lands of goats and pigs7.5 / 40 2.5 / 5 ‘Gardening’ Long fallow 20 to 30 years No fallow C1 C2 10 / 30 0.5 / 1
Torquebiau, E. Dosso, M. Nakaggwa, F. Philippon, O.
Torquebiau, E. Dosso, M. Nakaggwa, F. Philippon, O.
Torquebiau, E. Dosso, M. Nakaggwa, F. Philippon, O.
ISDA 2010, Montpellier, June 28-30, 2010
13
Table 4 - Supplementary farming system characteristics
It is thus legitimate to ask whether today’s landscape mosaics (mainly in the upper and lower zones) are not actually a mark of the past. Don’t they represent a society which has been formerly forced to practice agriculture in conditions which did not satisfy basic needs and thus does not want to farm any more? Aren’t cultivated fields presently being encroached upon by trees? The situation may be different for the middle zone, which is mainly used as grazing land for the remaining mobile herds of cattle and is tree covered because of the fire ban. Two contrasted scenarios can be envisaged to describe the future of the area.
3.2. Possible future scenarios
In a first scenario, the legacy of unfair past policies keeps influencing land dynamics. Farmers who have been forced to practice a poorly performing and non viable agriculture keep relying exclusively on social welfare and progressively stop farming. Household differentiation increases. Most people leave the area. The landscape progressively becomes
Other activities Location % of total number of farms Social welfare Off-farm income Collection of wild products Natural resource impact Large families (> 10 people) A1, A2, A3, A4
Lower Zone
25% IMPORTANT YES NO LOW
Medium size families (from 4 to 9 people) B1, B2, B3 Upper and Middle Zones
70 % MEDIUM YES YES IMPORTANT
Small families (from 1 to 3 people) C1, C2 Upper and Lower Zones
Torquebiau, E. Dosso, M. Nakaggwa, F. Philippon, O.
ISDA 2010, Montpellier, June 28-30, 2010
14
entirely tree covered, especially in the upper and middle zones. More conservation areas are developed at the expense of people’s land. Only a few farmers remain, mainly in the lowlands where they practice intensive farming.
In a contrasted scenario, collective land management is strengthened. A “landscape label” is developed. It conveys the idea that todays’ landscape mosaic can potentially be managed by the inhabitants and for their benefit. Long fallows which protect shallow and fragile soils through their dense tree cover can potentially be improved through enrichment planting or selective management and generate additional income. Existing cropping areas are sustainably intensified so as not to require additional land clearing. This is the “ecoagriculture” option, which can potentially be adopted by nearly all farmers, especially medium-size households, the most numerous, which are headed by young people and have thepotential greatest impact on the landscape.
3.3. Which conditions for an ecoagriculture option?
The Mathenjwa landscape as it is today is an ecoagriculture landscape as defined by Scherr and McNeely (2008). Its components provide for a mosaic of different land uses and the possibility of solid combinations between agricultural production and biodiversity conservation objectives. The fact that the farming landscape analysed here is adjacent to protected areas (UGCCA and Ndumo Game Reserve), and actually part of a transfrontier conservation area (Lubombo TFCA), adds value to this statement. At a wider scale, the relevant landscape mosaic should include these protected areas as well as areas under special status because of the transfrontier conservation initiative.
The absence of extension services so far has probably played an important role in maintaining the landscape in its current form. Farmers tend to copy existing practices. This does not mean that extension is not desirable, but it should be targeting the right ecoagriculture practices, not any agricultural intensification. Experience has shown that extension for innovative practices (e.g. agroforestry) requires skilled extension officers (Chitakira and Torquebiau 2010). Local organisations such as NGOs and other agencies may greatly help in making the landscape keep (or change towards better) conservation of natural resources together with food production.
While there may be some local awareness about conservation, there must also be tangible benefits for conservation concepts to gain popularity among local people. On-going studies in the area (Chitakira and Torquebiau, in press) reveal that people’s perception of the fencing off of the UGCCA is not always positive. If local dwellers are held responsible for the maintenance of ecosystem services and the scenic beauty of the landscape, they should be rewarded for this. The payment for or retribution of ecosystem services and the effect this may have on poverty alleviation in developing countries is the object of a heated debate in recent literature (e.g. Leimona et al.2009). Some initiatives nevertheless show that it possible to develop procedures through which people who, through their practices, maintain ecosystems or landscapes, make money or receive in-kind benefits (Wunder 2007 ; Swallow et al. 2009). The bio-physical environment of the Mathenjwa area is a clear opportunity to build on. The scenic, rolling landscape with hills, forested valleys, gorges, streams and cliffs is in itself an asset, for viewing tourism, but also for sport activities like hiking or mountain biking and the associated development of local skills. Local leadership of the king is highly respected. Together with a strong tradition of communal work, this makes information transfer and community mobilisation for training or implementation of innovations probably easy. Any implemented change should be based on existing practices and not trying to impose top-down innovations onto farmers. For instance, the existence of multi-purpose trees in the land and of fruit trees in homegardens leads towards a progressive move towards more agroforestry. The presence of contour farming or grass strips practices for land conservation is an existing step towards a greener agriculture. Fallow improvement, including
Torquebiau, E. Dosso, M. Nakaggwa, F. Philippon, O.
ISDA 2010, Montpellier, June 28-30, 2010
15
through agroforestry, is a small change over an existing practice which can lead to major improvement in land productivity (Kwesiga et al. 2003).
The informal Mathenjwa ecoagriculture landscape as it developed under poverty conditions now represents a huge potential because it can support many ecosystem services and lead to the improvement of people’s livelihoods. However, for this to happen, the links between farmers’ practices and landscape structure and function have to be understood and formalized into actual landscape-level management processes involving farmers and other stakeholders. Landscape mosaics as they are advocated by the ecoagriculture approach provide a framework for these processes and have so far not been studied in this part of the world.
CONCLUSION
The Mathenjwa families are still farming families but more for tradition and lack of other opportunities than for necessity. The analysis of past and present farming practices shows that agriculture alone has never been the unique source of income: off-farm salaries and social welfare make a large part of people’s income, so food needs are partly met from purchases. The fact that a kind of slash and burn agriculture, which theoretically is not compatible with a population density around 60 inhabitants / km2 is still practiced, confirms
that agriculture is a secondary activity. As a consequence, when looking at the landscape, one can observe a mosaic of dense forest, clear forest, savannas with more or less trees, cultivated lands, young fallows, abandoned fields, etc. This appears as a remarkable landscape when compared with the general openfield landscape associated with intensive farming practices as they exist elsewhere in the country. It thus appears of interest for the further development of communities living in former homelands to rely on these landscape mosaics for their livelihoods rather than transforming their land into large scale monocultures. This can be achieved provided collective decisions are taken that lead to a formal ecoagriculture landscape. Key stakeholders potentially contributing to such decisions have to be identified and consulted, in order to establish a strong social process through which formal ecoagriculture innovations could take place. Under such a scheme, poor people would be able to make a good living out of their own land, combining some agricultural activities with other activities linked to the ecosystem services value of the landscape such as ecotourism, resource conservation (e.g. plants, animals, water, carbon) and interaction with neighbouring protected areas.
Acknowledgements
We are grateful to the Centre for Environmental Studies (CFES), University of Pretoria, for hosting FN during her stay in South Africa, and to the Environmental Education Centre in Ndumu for providing accommodation during field work. Munyaradzi Chitakira and Clint Halkett-Skiddall are warmly thanked for their assistance, as well as local interpreters. CFES, the Embassy of France in South Africa, CIRAD and SUPAGRO provided funds for travel, accommodation and research expenses.
REFERENCES
Adams WL et al 2004. Biodiversity conservation and the eradication of poverty. Science 306:1146– 1149
Caron P 2005. À quels territoires s’intéressent les agronomes ? Le point de vue d’un géographe tropicaliste. Natures Sciences Sociétés 13 : 145-153
Conway GR 1985. Agroecosystem analysis. Agricultural Administration 20: 31-55
Chitakira, M. and Torquebiau, E. 2010. Hurdles and Coping Mechanisms Relating to Agroforestry Adoption by Smallholder Farmers in Zimbabwe. Journal of Agricultural Education and Extension, Accepted, June 2010 Issue
Chitakira, M. and Torquebiau, E. in press. Towards balancing production and protection in KwaZulu-Natal, South Africa: participatory landscape performance assessment. ISDA Symposium, June 2010, Montpellier, France.
Torquebiau, E. Dosso, M. Nakaggwa, F. Philippon, O.
ISDA 2010, Montpellier, June 28-30, 2010
16
Dixon J, A Gulliver & D Gibbon 2001. Farming Systems and Poverty: Improving Farmers’ Livelihoodsin a Changing World. FAO & World Bank, 412 pp
FAO (1999) Guidelines for Agrarian Systems Diagnosis: Land tenure service, Rural Development Division, Sustainable Development Dedpartment, Rome, 70p.
FAO (2009) State of the world’s forests 2009. Food and agriculture organization of the United Nations Rome, 168 pp
Gaugris J.Y., M.W. Van Rooyen. 2009. Woody vegetation structure in conserved versus communal land in a biodiversity hotspot: A case study in Maputaland, South Africa. South Africa Journal of Botany (2009), doi:10.1016/j.sajb.2009.11.007
Gordon. L.J., M. Finlayson and M. Falkenmark. 2010. Managing water in agriculture for food production and other ecosystem services. Agricultural Water Management 97 (4): 512-519 Kloppers R.J. (2004), Border Crossings: Life in the Mozambique/ South Africa Borderland, PhD
Anthropolgy, Univerity of Pretoria, 268 p.
Kwesiga F, F.K. Akinnifesi, P.L. Mafongoya, M.H. McDermott and A. Agumya, 2003. Agroforestry research and development in southern Africa during the 1990s: Review and challenges ahead. Agroforestry Systems 59: 173–186
Leimona B, Joshi L and van Noordwijk M 2009. Can rewards for environmental services benefit the poor? Lessons from Asia. International Journal of the Commons 3 (1): 82-107
Lightfoot C 2000. Agroecosystems analysis: A systems application with a future? In Collinson M (ed) A History of Farming Systems Research, CABI / FAO, pp 363-381
McNeely JA, Scherr SJ 2003. Ecoagriculture: strategies to feed the world and save wild biodiversity. Island Press, Washington, DC, 323 pp
Mucina L. & Rutherford. M.C. (eds) 2006. The vegetation of South Africa, Lesotho and Swaziland. Strelitzia 19. South African national Biodiversity Institute, Pretoria, South Africa.
Patriquin DG 2001. Systems for sustainable agriculture : Approaches, tradeoffs and needs. In: Haidn, H (ed) Exploring sustainable alternatives: An introduction to sustainable agriculture. Saskatoon, (SK): Canadian Centre for Sustainable Agriculture, pp 95-104
Renetzeder C., S. Schindler, J. Peterseil, M.A. Prinz, S. Mücher, T. Wrbka. 2010. Can we measure ecological sustainability? Landscape pattern as an indicator for naturalness and land use intensity at regional, national and European level. Ecological Indicators 10: 39–48
Robson JP 2007. Local approaches to biodiversity conservation: lessons from Oaxaca, southern Mexico. Int J Sustain Dev 10(3): 267–286
Scherr SJ, McNeely JA 2008. Biodiversity conservation and agricultural sustainability: towards a new paradigm of ‘ecoagriculture’ landscapes. Philos Trans R Soc B 363:477–494
Scherr SJ, McNeely JA (eds) 2007. Farming with nature: the science and practice of ecoagriculture. Island Press, Washington, DC, 445 pp
Shahin M. 2002. Hydrology and water resources of Africa. Kluwer, Dordrecht, Netherlands
Swallow, B. M., M. F. Kallesoe, U. A. Iftikhar, M. van Noordwijk, C. Bracer, S. J. Scherr, K. V. Raju, S. V. Poats, A. Kumar Duraiappah, B. O. Ochieng, H. Mallee, and R. Rumley. 2009. Compensation and rewards for environmental services in the developing world: framing pan-tropical analysis and comparison. Ecology and Society 14(2): 26. [online] URL:
http://www.ecologyandsociety.org/vol14/iss2/art26/
Tallis H, Kareiva P, Marvier M, Chang A 2008. An ecosystem services framework to support both practical conservation and economic development. Proc Natl Acad Sci USA 105(28):9457–9464 Torrance J.D. 1972. Malawi, Rhodesia, Zambia. In: Griffiths J.F. (Ed.) Africa. World Survey of
Climatology. V 10. Elsevier, The Hague
Wood D, Lenné JM (eds) 1999. Agrobiodiversity: characterization, utilization and management. CABI Publishing, Wallingford, 490 pp
Wunder, S. 2007. The Efficiency of Payments for Environmental Services in Tropical Conservation. Conservation Biology 21 (1): 48–58
Acronym