Major urban road characteristics and injured pedestrians: A
representative survey of intersections in Montréal, Quebec
Patrick Morency,
MD, PhD,
1,2,Judith Archambault,
MSc,
1,2Marie-Soleil Cloutier,
PhD,
3Mathieu Tremblay,
MSc,
3Céline Plante,
MSc2ABSTRACT
OBJECTIVES: In urban settings, pedestrian fatalities and injuries are concentrated on major roads. This study aims to describe urban intersections with major roads (arterials and collector roads) and explore the association between intersection characteristics and injured pedestrians.
METHODS: From a stratified random sampling in Montréal, Quebec, 512 intersections were selected and their characteristics collected. The number of injured pedestrians from 1999 to 2008 was obtained from ambulance services. Binomial negative regression models (including IRR: incidence rate ratios) were calculated to determine associations between intersection characteristics and injured pedestrians: i) at all intersections; ii) at intersections with multi-lane roads and iii) at signalized intersections with available vehicle and pedestrian counts.
RESULTS: Major intersections had more traffic lanes (3.8 vs. 1.7,p < 0.01) and longer pedestrian crossings (18.8 m vs. 12.7 m, p < 0.01) than minor intersections. Bus stops were also more frequent at these intersections (75% vs. 6%,p < 0.01). Overall, each additional traffic lane was associated with a 75% increase in the number of injured pedestrians (IRR = 1.75; 95% confidence interval [CI] = 1.41–2.18). At intersections with multi-lane roads, a fourth branch (IRR = 2.40; 95% CI = 1.53–3.77), vehicles parked within 5 m of the intersection (IRR = 2.40; 95% CI = 1.64–3.51), and marked crosswalks (IRR = 1.79; 95% CI = 1.08–2.95) significantly increased the number of injured pedestrians. Raised medians had no significant protective effect.
CONCLUSIONS: The results show that besides traffic and pedestrian volumes, intersection characteristics contribute to pedestrian injuries. The reduction of traffic lanes, parking prohibition near intersections and implementation of appropriate pedestrian refuge areas would improve pedestrian safety.
KEY WORDS: Injuries; pedestrian; major roads; intersections; urban health
La traduction du résumé se trouve à la fin de l’article. Can J Public Health 2015;106(6):e388–e394
doi: 10.17269/CJPH.106.4821
I
n 2010 in the United States, 4,280 pedestrians were killed and 70,000 were injured in traffic crashes.1In Québec, every year over 3,000 pedestrians are injured, including about 1,400 on the Island of Montréal.2Arterial and collector roads, two of the hierarchical road classes found in urban cities,3 seem to play active roles in this road safety statistic. From 1997 to 2006 in the US, over half of pedestrians who died in pedestrian crashes in urban settings were killed on arterial roads.4 In Vancouver, BC, almost all injured pedestrian“hot spots” (97%) were located on major roads, either arterials or collector roads.5 The situation is similar in Montréal, where most pedestrians (63%) are injured at intersections6and where over half (53%) of the 1,799 injuries to school-aged pedestrians from 1999 to 2008 were located at intersections with at least one arterial road.7The over-representation of arterials in road crashes could be attributable to high traffic volume. However, recent area-level studies have reported that traffic volume and urban arterial roads are independently associated with a greater incidence of road injuries within neighbourhoods.3,8,9In Montréal, the presence of arterial roads at intersections significantly increases the number of injured pedestrians, cyclists and motor-vehicle occupants, even when other intersection characteristics are taken into account.10
By definition, an urban arterial road has more traffic lanes and is consequently wider, has higher average vehicle speeds and longer
emergency stopping distances.11 For decades, wide and straight roads have been considered safer, but the “conventional engineering wisdom”11 (p. 354) overlooked the urban context and pedestrian safety. In urban settings, major roads (arterials and collectors) are used to carry through traffic but are also used to access residences, businesses, schools and local services by motor-vehicle occupants, pedestrians and cyclists.12 The likelihood of road user conflicts is further increased by intersections’ density and geometric features (e.g., 4-way vs. 3-way, either T or Y intersections).10,13,14 In Montréal, as elsewhere, pedestrian volume is a strong predictor of pedestrian injuries, but pedestrian counts have been negatively associated
Author Affiliations
1. Département de médecine sociale et préventive, Université de Montréal, Montréal, QC
2. Direction de santé publique de Montréal, Montréal, QC
3. Institut National de la Recherche Scientifique, Centre Urbanisation Culture Société, Montréal, QC
Correspondence: Dr. Patrick Morency, Direction de santé publique de Montréal, 1301 rue Sherbrooke Est, Montréal, QC H2L 1M3, Tel:☎514-528-2400, ext. 3327, E-mail: [email protected]
Acknowledgements: The research was made possible by in-kind support from the Montréal Public Health Department. We express our sincere gratitude to Urgences-santé for their willing collaboration and expertise in injury data collection and validation, le Centre d’écologie urbaine de Montréal for data collection at intersections and Sylvie Gauthier who edited the English version.
with major roads.13 At intersections with public transit services, public transit type, stop location and the number of people getting on and off buses have been associated with more total and pedestrian crashes.15,16
Injury prevention principles17 suggest reducing pedestrians’ exposure to moving vehicles in order to reduce crash risk: for example, by separating pedestrians from traffic in time (e.g., all-red and half-all-red signal phases) or space (e.g., raised medians or refuge islands). Some studies have suggested that well-marked crosswalks and pedestrian crossing signs may improve pedestrian or motorist behaviour.18,19 However, marked crosswalks have been associated with more injured pedestrians,20–23 including older people24as well as those injured on multi-lane roads with high traffic volumes.12,25
Major roads have been associated with pedestrian injuries for decades, mainly as a proxy of traffic volume. Although it is well known that the geometric features of roads can either increase or decrease the likelihood of crashes and pedestrian injuries,11,26 urban major road characteristics that may contribute to pedestrian injuries have never been described. This study aims to describe intersections with major roads (arterial, collector) in an urban setting using a representative random sample of intersections, and to explore the association between intersection characteristics and injured pedestrians.
METHODS
Population and region
The urban area under study is Montréal’s central core, which includes 11 Montréal administrative boroughs and two independent municipalities. The 174 km2 study area had a population of 1.2 million in 2006 and 8,617 intersections.
Intersection sampling
To study intersections with major roads, six intersection types were originally defined on the basis of Montréal’s hierarchical road classification (GeoBase, City of Montreal): arterials only (a-a); collectors only (c-c); arterials and collectors (a-c); arterials and locals (a-l); collectors and locals (c-l); locals only (l-l). For this study, we defined“major” intersections as exclusively made up of arterials and collectors (a-a; a-c; c-c) and“minor” intersections as exclusively made up of local roads (l-l). Intersections of local roads and arterials (a-l) or collectors (c-l) were considered “mixed” intersections. In Montreal, major intersections were less frequent (7.5%) than mixed (43.1%) and minor intersections (49.4%). Given the limited amount of financial and human resources, a stratified random sample of approximately 600 intersections was selected, with a sampling fraction of 5% and a minimum of 60 intersections per intersection type (strata).27The current study comprised 512 intersections after the exclusion of 76 sites (48 crescents or dead ends, 14 alleys, 7 sites under reconstruction and 7 sites with expressway access).
Data collection
Intersection characteristics were measured at each intersection branch and corner.27 The number of traffic lanes included lanes in both directions (e.g., east and west) but excluded lanes reserved exclusively for on-street parking. Marked crosswalks were standard twin parallel lines and“bar” type. Traffic calming
measures were vertical deflection (e.g., speed hump) and narrowing (e.g., curb extension) of the roadway. Parked vehicles and sight obstructions (building, vegetation, fence) were considered if present within 5 m of at least one intersection corner. Roadway width was measured beyond the intersections (after the corner curves, curb extensions or pedestrian crossings). Pedestrian crossing length was measured in the centre of the crossing or, if there was no crossing, in the middle of the corner’s curvature. Every road segment and pedestrian crossing was measured three times, and the average was calculated and kept for each intersection branch.
Data were collected from July to October 2008. Intersections were randomly assigned to three teams of two observers each. All observers had university degrees in environment or urban planning, and they were trained for two weeks before data collection: indoors with the intersection characteristics observation grid and pictures, and at trial sites with feedback sessions afterward.
Reliability
Each observer on the team independently completed an observation checklist.27Concordance between the two observers, measured by Cohen’s kappa coefficient, was excellent for number of traffic lanes (kappa = 0.92) and the presence of traffic lights (kappa = 0.95), pedestrian lights (kappa = 0.95), stop signs (kappa = 0.93), pedestrian crossings (kappa = 0.98), medians or pedestrian islands (kappa = 0.95), authorized left turns (kappa = 0.92) and authorized or prohibited parking on street corners (kappa = 0.83). When concordance between two observers was moderate (e.g., curb extension, kappa = 0.59), the presence or absence of amenities was validated using Google Street View. Injured pedestrians
The data source for injured pedestrians was the Urgences-Santé ambulance service dataset, more specifically pre-hospital intervention reports filled out by ambulance attendants between January 1, 1999 and July 31, 2008. A previous validation enables us to exclude pedestrian falls.6 Using the geographical coordinates to which ambulances were dispatched, injured pedestrians were geocoded to the closest intersection using a 15 m radius around the intersection’s central point.6
Population and jobs density
Population and jobs density– two indirect measures of pedestrian activity9 – were obtained from the 2006 Canadian census (Statistics Canada). One-kilometre buffers (road network distance) were created around intersections, and all census tracts within each intersection’s buffer were included in the calculation of the population and jobs density measure. To estimate the number of inhabitants and jobs in each buffer, we multiplied the proportion of census tract area (km2) within the buffer by the number of inhabitants and jobs in the whole census tract. The total number of inhabitants and jobs in a buffer was divided by the buffer area (km2) to determine its population and jobs density. Pedestrian and vehicle counts
The City of Montréal provided manual counts of pedestrians and vehicles for a subset of signalized intersections (n = 168).
Three-hour counts were done between 2003 and 2009, at noon (12 h–13 h) and at rush hour (7 h30–8 h30; 16 h30–17 h30). Vehicle counts were adjusted by hourly, weekly and monthly expansion factors to estimate the average annual daily traffic.12 Three-hour pedestrian counts were used as an indicator of the daily number of pedestrians crossing the intersection. Since traffic volume was strongly correlated with the average number of traffic lanes per intersection branch (Pearson’s r = 0.75: Figure 1) and pedestrian volume was strongly correlated with population and job density surrounding the intersection (Pearson’s r = 0.72: Figure 1), these two variables were used as proxies for vehicle and pedestrian activity in Models I and II. Analyses
Descriptive analyses of intersection characteristics included a comparison between major and minor intersections. Negative binomial regression models were performed and included, as predictors of pedestrian injuries, proxies (Models I and II) or estimates (Models III) of traffic volume and pedestrian activity. All regression models included the number of branches (4-way vs. 3-way, either T or Y) and the presence (vs. absence) of parked vehicles near intersections, crosswalk markings, raised medians and bus stops. Regression analyses did not include roadway width and pedestrian crossing length, because they were strongly correlated with number of traffic lanes (respectively Pearson’s r = 0.80 and r= 0.79).
An unadjusted model did not include proxies of pedestrian and traffic volumes. Models I and II included proxies of traffic volume (number of traffic lanes per intersection branch) and pedestrian activity (population and job density). Model I included all surveyed intersections, while Model II was limited to intersections with multi-lane roads, that is, with more than two traffic lanes per intersection branch. Model III included only 168 intersections with vehicle and pedestrian counts: to increase the statistical power, intersection characteristics were included in five separate models (IIIA-IIIE). The incidence rate ratio (IRR) assessed the number of injured pedestrians at intersections with a specific characteristic (e.g., marked crosswalk), compared with intersections without this characteristic. Descriptive and regression analyses were calculated in Stata/SE v10.1.
RESULTS
Intersection characteristics
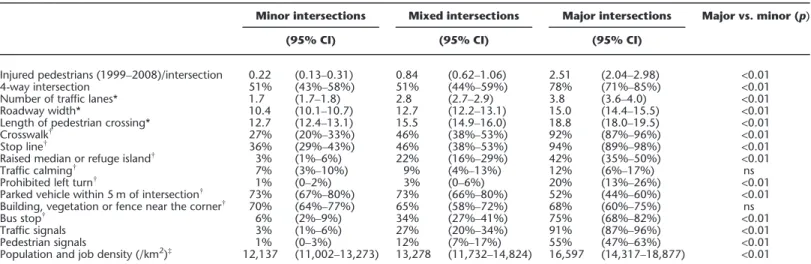
As shown in Table 1, from 1999 to 2008, the average number of injured pedestrians per major intersection (2.51; 95% confidence interval [CI] = 2.04–2.98) was greater than at mixed (0.84; 95% CI: 0.62–1.06) and minor (0.22; 95% CI: 0.13–0.31) intersections. There was a higher density of population and jobs (combined, as an indicator of pedestrian activity) in the 1 km area surrounding major intersections than around minor intersections (16,597 vs. 12,137, p < 0.01). Bus stops were also more frequent at major than minor intersections (75% vs. 6%, p < 0.01). Major intersections had more traffic lanes (3.8 vs. 1.7, p < 0.01), wider roadways (15.0 m vs. 10.4 m, p < 0.01) and longer pedestrian crossings (18.8 m vs. 12.7 m, p < 0.01) than minor intersections (Figure 2). More than three quarters of major intersections were 4-way (78% vs. 51% for minor intersections, p < 0.01), and nearly half of them had at least one branch with five or more traffic lanes (48% vs. none for minor intersections p < 0.01). Marked crosswalks (92% vs. 27%, p< 0.01), stop lines (94% vs. 36%, p < 0.01), traffic signals (91% vs. 3%, p < 0.01), pedestrian signals (55% vs. 1%, p < 0.01) and prohibited left turns (20% vs. 1%, p < 0.01) were more frequent at major than minor intersections. Raised medians or refuge islands were frequent at major intersections but virtually absent at minor intersections (42% vs. 3%, p < 0.01). Traffic calming measures and visibility obstruction were not significantly associated with intersection type. Traffic calming measures had been implemented at only 8% (95% CI = 5%–11%) of all intersections. Visibility obstructions at intersection corners were common: parked vehicles at the time of data collection (72%; 95% CI = 67%–76%), vegetation or fence (43%; 95% CI = 38%– 48%) and buildings (34%; 95% CI = 29%–38%).
Intersection characteristics and injured pedestrians Multivariate regression Model I, which included all intersections, showed that 4-way (vs. 3-way) intersections (IRR = 2.24; 95% CI = 1.46–3.45), the presence of vehicles parked within 5 m of intersections (IRR = 2.29; 95% CI = 1.50–3.48) and bus stops (IRR = 2.25; 95% CI = 1.51–3.36) were significantly associated with an increase in injured pedestrians (Table 2a). At intersections
10 100 1000 10000 100000 1000 10000 100000 Pedestrian volume
Popula on and jobs density (within 1 km-radius) 0 20000 40000 60000 80000 0 2 4 6 8 A verag e annual dai ly tr affi c (AADT)
Number of traffic lanes per intersec on branch
Figure 1. Association between traffic and pedestrian volumes at intersections* and their respective proxies
* Subset of 168 intersections with manual counts of pedestrians and vehicles (Source: City of Montréal). Population and job density were obtained from Montréal census tract, 2006 Canadian census (Statistics Canada).
with more than two traffic lanes per branch, the multivariate regression Model II showed that 4-way intersections (IRR = 2.40; 95% CI = 1.53–3.77), parked vehicles within 5 m of intersections (IRR = 2.40; 95% CI = 1.64–3.51) and marked crosswalks (IRR = 1.79; 95% CI = 1.08–2.95) significantly increased the number of injured pedestrians. In addition to these intersection characteristics, proxies of traffic volume (number of traffic lanes) and pedestrian activity (population and job density) were significantly associated with the number of injured pedestrians both in Model I and Model II.
At signalized intersections with available vehicle and pedestrian counts, separate multivariate regressions showed that parked vehicles within 5 m of intersections (Model IIIB: IRR = 1.84; 95% CI = 1.24–2.72) and the presence of bus stops (Model IIIE: IRR = 2.55; 95% CI = 1.54–4.24) were significantly associated with an
increase in injured pedestrians (Table 2b). The estimate of the association between marked crosswalks and pedestrian injuries was positive (Model IIIC: IRR = 2.12) but only marginally significant (p = 0.06).
DISCUSSION
This paper described intersection characteristics, compared major and minor intersections and examined associations between intersection characteristics and number of injured pedestrians. Significant results illustrate the association between several intersection characteristics and the number of injured pedestrians, even after exposure was controlled for through proxies and estimates of pedestrian and vehicle activity.
A first result worth mentioning relates to the pedestrian exposure to vehicles while on the road: major intersections have longer pedestrian crossings, wider roads and more traffic lanes. This means that pedestrians crossing those intersections are exposed to traffic for a longer period of time, creating more “opportunities” for crashes. Moreover, Model I did show that each additional traffic lane increased pedestrian injuries by 75%: more traffic lanes also mean wider streets, greater vehicle speeds and higher crash rates.11 Similarly, in Maine, the number of injured pedestrians was found to be significantly higher on wider roads, even when pedestrian and motor vehicle volumes were considered.28 In addition to the number of lanes and the road width, the “shape” (4-way vs. 3-way) of an intersection also affected pedestrian injuries in our analyses (Model I and II). In fact, 4-way intersections have a higher number of conflict points and a greater likelihood of crashes and injuries than 3-way T-intersections.3,10,11,14 One of the solutions to reduce pedestrian exposure to traffic is to eliminate traffic lanes, for example on four-lane urban roadways.11In Toronto, it has been proposed to substitute some traffic lane(s) with wide sidewalks and/or new dedicated bike and bus lanes for selected arterial roads.29,30 In the same way, strategies to reduce road users’ conflicts at 4-way intersections Figure 2. Length of pedestrian crossings at major and minor
intersections, by road type
Table 1. Major, mixed and minor intersection characteristics (n = 512; Montréal, Québec, 2008)
Minor intersections Mixed intersections Major intersections Major vs. minor (p)
(95% CI) (95% CI) (95% CI)
Injured pedestrians (1999–2008)/intersection 0.22 (0.13–0.31) 0.84 (0.62–1.06) 2.51 (2.04–2.98) <0.01
4-way intersection 51% (43%–58%) 51% (44%–59%) 78% (71%–85%) <0.01
Number of traffic lanes* 1.7 (1.7–1.8) 2.8 (2.7–2.9) 3.8 (3.6–4.0) <0.01
Roadway width* 10.4 (10.1–10.7) 12.7 (12.2–13.1) 15.0 (14.4–15.5) <0.01
Length of pedestrian crossing* 12.7 (12.4–13.1) 15.5 (14.9–16.0) 18.8 (18.0–19.5) <0.01
Crosswalk† 27% (20%–33%) 46% (38%–53%) 92% (87%–96%) <0.01
Stop line† 36% (29%–43%) 46% (38%–53%) 94% (89%–98%) <0.01
Raised median or refuge island† 3% (1%–6%) 22% (16%–29%) 42% (35%–50%) <0.01
Traffic calming† 7% (3%–10%) 9% (4%–13%) 12% (6%–17%) ns
Prohibited left turn† 1% (0–2%) 3% (0–6%) 20% (13%–26%) <0.01
Parked vehicle within 5 m of intersection† 73% (67%–80%) 73% (66%–80%) 52% (44%–60%) <0.01 Building, vegetation or fence near the corner† 70% (64%–77%) 65% (58%–72%) 68% (60%–75%) ns
Bus stop† 6% (2%–9%) 34% (27%–41%) 75% (68%–82%) <0.01
Traffic signals 3% (1%–6%) 27% (20%–34%) 91% (87%–96%) <0.01
Pedestrian signals 1% (0–3%) 12% (7%–17%) 55% (47%–63%) <0.01
Population and job density (/km2)‡ 12,137 (11,002–13,273) 13,278 (11,732–14,824) 16,597 (14,317–18,877) <0.01 Notes: Major intersections are exclusively made up of arterials (a) and collectors (c) (a-a; a-c; c-c); mixed intersections consist of local roads (l) and arterials or collectors (a-l; c-l); and minor intersections are exclusively local roads (l-l).
CI = confidence interval.
* Average of the three or four intersection branches (at 3-way and 4-way intersections respectively).
†If present at one or more intersection branches or corners. ‡Within a 1 km buffer of the intersection.
may include left turn prohibition or, if feasible, changing one of the two-way street segments into a one-way street going away from the intersection.
A second result highlighted here concerns the importance of visibility at intersections. In fact, most Montréal intersections had on-street parked vehicles within 5 m of intersections, despite parking prohibition regulations. On-street parking near intersections impedes drivers’ ability to see pedestrians and may increase child pedestrian injuries.11 Accordingly, our results confirm the association between parking within 5 m of intersections and increased pedestrian injuries, at all intersections (Model I), at intersections with multi-lane roads (Model II) and at signalized intersections with traffic counts (Model IIIB). Better enforcement of parking regulations, retreat of the stop line, addition of signs, and marked pavement (yellow-painted curbs) or physical infrastructure, such as curb extension, could lead to better visibility of crossing pedestrians, especially at major intersections. Bus stops have been associated with pedestrian activity and pedestrian or motor vehicle occupant crashes.13,15,16The significant association between bus stops and pedestrian injuries (Models I and IIIE), even when traffic and other intersection characteristics had been controlled for, may also be related to visibility at intersections.
Finally, the significant (Model II) and marginally significant (Model IIIC) results relating to the presence of marked crosswalks may reflect the selective implementation of marked crosswalks at intersections with higher risk of injury, greater traffic or greater number of pedestrians. However, it is worth noting that previous studies have also observed negative impacts of marked crosswalks on pedestrian safety,20,21 at unsignalized and uncontrolled locations (no traffic signals or stop signs),22,24,25for older pedestrians24and on multi-lane roads with high traffic volumes.25 This result still highlights the fact that marked crosswalks at major urban intersections need complementary measures, such as appropriate medians and pedestrian signals with exclusive phases (e.g., “All red”) to really protect crossing pedestrians. Raised medians and raised crossing islands may provide refuge areas for pedestrians, and have been previously associated with a reduction in pedestrian crashes.11In Montréal, raised medians had no significant protective effect when other intersection characteristics were taken into account, a result that could be explained by their design: most of them are narrow, end before crosswalks and do not provide any refuge or protection to pedestrians. Furthermore, in Montréal, only half of signalized intersections have separate pedestrian signals,27and “All red” phases for pedestrians are unusual.
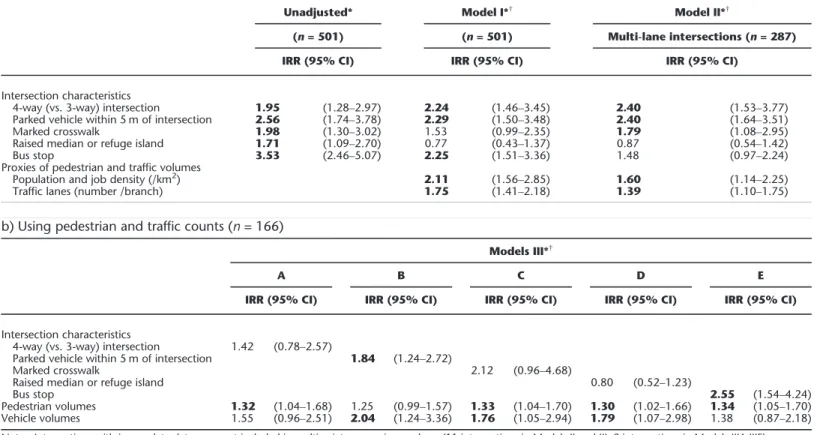
Table 2. Multivariate models of the number of injured pedestrians (1999–2008), as a function of intersection characteristics (Montréal, Québec, 2008)
a) Using proxies of pedestrian and traffic volumes
Unadjusted* Model I*† Model II*†
(n = 501) (n = 501) Multi-lane intersections (n = 287)
IRR (95% CI) IRR (95% CI) IRR (95% CI)
Intersection characteristics
4-way (vs. 3-way) intersection 1.95 (1.28–2.97) 2.24 (1.46–3.45) 2.40 (1.53–3.77) Parked vehicle within 5 m of intersection 2.56 (1.74–3.78) 2.29 (1.50–3.48) 2.40 (1.64–3.51)
Marked crosswalk 1.98 (1.30–3.02) 1.53 (0.99–2.35) 1.79 (1.08–2.95)
Raised median or refuge island 1.71 (1.09–2.70) 0.77 (0.43–1.37) 0.87 (0.54–1.42)
Bus stop 3.53 (2.46–5.07) 2.25 (1.51–3.36) 1.48 (0.97–2.24)
Proxies of pedestrian and traffic volumes
Population and job density (/km2) 2.11 (1.56–2.85) 1.60 (1.14–2.25)
Traffic lanes (number /branch) 1.75 (1.41–2.18) 1.39 (1.10–1.75)
b) Using pedestrian and traffic counts (n = 166)
Models III*†
A B C D E
IRR (95% CI) IRR (95% CI) IRR (95% CI) IRR (95% CI) IRR (95% CI)
Intersection characteristics
4-way (vs. 3-way) intersection 1.42 (0.78–2.57)
Parked vehicle within 5 m of intersection 1.84 (1.24–2.72)
Marked crosswalk 2.12 (0.96–4.68)
Raised median or refuge island 0.80 (0.52–1.23)
Bus stop 2.55 (1.54–4.24)
Pedestrian volumes 1.32 (1.04–1.68) 1.25 (0.99–1.57) 1.33 (1.04–1.70) 1.30 (1.02–1.66) 1.34 (1.05–1.70) Vehicle volumes 1.55 (0.96–2.51) 2.04 (1.24–3.36) 1.76 (1.05–2.94) 1.79 (1.07–2.98) 1.38 (0.87–2.18)
Notes: Intersections with incomplete data were not included in multivariate regression analyses (11 intersections in Models II and III; 2 intersections in Models IIIA-IIIE). IRR = incidence rate ratios; CI = confidence interval. IRR in bold are statistically significant (p < 0.05).
* Unadjusted Model and Model I included all intersections. Model II included only intersections with more than two traffic lanes per intersection branch. Models III included only intersections with available pedestrian and traffic counts.
†Proxies of traffic volume (traffic lanes) and pedestrian activity (population and job density) were used in Model I and Model II. In Models III, average annual daily traffic (AADT) and
Strengths and limitations
The main strengths of this research lie in the representative sample – instead of convenience samples13,14– of intersections, the scope and the inter-observer reliability of the field data collected. Our measurements were not restricted to area-level9 or indirect10 measures and included detailed characteristics at each intersection branch. The research design was neither experimental nor “before-and-after”, and causal links between intersection characteristics and number of injured pedestrians cannot be inferred. Day of the week, season and weather were not included, but pedestrian activity was taken into account through proxies (Model I, II) and counts (Models III). Lighting and the presence of alcohol outlets and commercial retail properties were not measured. Intersection characteristics collected in 2008 reflect decades of roadway design and traffic engineering practices. Using police accident reports2 would increase the number of injured pedestrians by approximately 50% but is unlikely to influence the observed associations between intersection characteristics and pedestrian injury.
CONCLUSION
Urban major intersection characteristics contribute to an increased likelihood of crashes and pedestrian injuries. High vehicle capacity translates into more traffic lanes, wider streets and longer pedestrian crossings. Four-way intersections improve connectivity but also increase potential conflict points between vehicles and pedestrians. Parked vehicles near intersections impede drivers’ ability to see pedestrians. Without any other substantial crossing improvements, marked crosswalks may increase pedestrians’ risk of injury through a false sense of security. Arterials and collector roads could be retrofitted to better take into account pedestrian needs and safety: reduction of traffic lanes or traffic, prohibition of parking near intersections and implementation of appropriate pedestrian refuge areas would improve pedestrian safety.
REFERENCES
1. National Highway Traffic Safety Administration (NHTSA). Traffic Safety Facts 2010: Pedestrians. Washington, DC: U.S. Department of Transportation, 2012. Available at: http://www-nrd.nhtsa.dot.gov/Pubs/811625.pdf (Accessed May 8, 2014).
2. Direction de la recherche et du développement en sécurité routière. Dossiers statistiques - accidents, parc automobile, permis de conduire: bilan 2011. Québec, QC: Société d’assurance-automobile du Québec, 2012; 214 p.
3. Dumbaugh E, Rae R. Safe urban form: Revisiting the relationship between community design and traffic safety. J Am Plann Assoc 2009;75(3):309–29. doi: 10.1080/01944360902950349.
4. National Highway Traffic Safety Administration (NHTSA). National Pedestrian Crash Report. DOT HS 810 968. Washington: U.S.Department of Transportation, 2008; 63 p.
5. Schuurman N, Cinnamon J, Crooks VA, Hameed SM. Pedestrian injury and the built environment: An environmental scan of hotspots. BMC Public Health2009;9:233. PMID: 19602225. doi: 10.1186/1471-2458-9-233.
6. Morency P, Cloutier MS. From targeted“black spots” to area-wide pedestrian safety. Inj Prev 2006;12(6):360–64. PMID: 17170182. doi: 10.1136/ip.2006. 013326.
7. Morency P, Gauvin L, Tessier F, Miranda-Moreno L, Cloutier MS, Morency C. Analyse désagrégée des facteurs environnementaux associés au nombre d’enfants blessés par un véhicule à moteur en milieu urbain. Cahiers de Géographie du Québec2011;55(156):449–68. doi: 10.7202/1008888ar.
8. Lovegrove GR, Sayed T. Macro-level collision prediction models for evaluating neighbourhood traffic safety. Can J Civil Eng 2006;33(5):609–21. doi: 10.1139/l06-013.
9. Wier M, Weintraub J, Humphreys EH, Seto E, Bhatia R. An area-level model of vehicle pedestrian injury collisions with implications for land use and
transportation planning. Accid Anal Prev 2009;41:137–45. PMID: 19114148. doi: 10.1016/j.aap.2008.10.001.
10. Morency P, Gauvin L, Plante C, Fournier F, Morency C. Neighbourhood social inequalities in road traffic injuries: The influence of traffic volume and road design. Am J Public Health 2012; 102(6), 1112–19. PMID: 22515869. doi: 10.2105/AJPH.2011.300528.
11. Ewing R, Dumbaug E. The built environment and traffic safety: A review of empirical evidence. J Plann Lit 2009;23(4):347–67. doi: 10.1177/ 0885412209335553.
12. World Road Association (PIARC). Road Safety Manual, 1st ed., UK: Route 2 Market Limited, 2004; 603 p.
13. Miranda-Moreno LF, Morency P, El-Geneidy AM. The link between built environment, pedestrian activity and pedestrian-vehicle collision occurrence at signalized intersections. Accid Anal Prev 2011;43(5):1624–34. PMID: 21658488. doi: 10.1016/j.aap.2011.02.005.
14. Lyon C, Persaud B. Pedestrian collision prediction models for Urban intersections– Paper No. 02-3609. Transp Res Rec 2002;1818:102–7. doi: 10. 3141/1818-16.
15. Shahla F, Shalaby AS, Persaud NB, Hadayeghi A. Analysis of transit safety at signalized intersections in Toronto, Ontario, Canada. Transp Res Rec 2009;2102:108–14. doi: 10.3141/2102-14.
16. Hess PM, Vernez Moudon AV, Matlick JM. Pedestrian safety and transit corridors. J Public Transp 2004;7(2):73–93.
17. Haddon W Jr. Energy damage and the 10 countermeasure strategies. Inj Prev 1995;1(1):40–44. PMID: 9345992.
18. Retting RA, Van Houten R, Malenfant L, Van Houten J, Farmer CM. Special signs and pavement markings improve pedestrian safety. J Inst Transp Eng 1996;66(12):28–35.
19. Hauck J, Bates L. Well-marked crosswalks are a pedestrian’s best friends. Rural and Urban Roads1979;17(3):26–28.
20. Herms B. Pedestrian Crosswalk Study: Crashes in Painted and Unpainted Crosswalks. Record No. 406. Washington: Transportation Research Board, 1972.
21. Jones TL, Tomcheck P. Pedestrian accidents in marked and unmarked crosswalks: A quantitative study. J Inst Transp Eng 2000;70(9):42–46. 22. Gibby AR, Stites JL, Thurgood GS, Ferrara TC. Evaluation of Marked and
Unmarked Crosswalks at Intersections in California. Report No. FHWA/CA/ TO-94/1. Chico State University, CA: Federal Highway Administration (FHWA), 1994.
23. Leden L, Garder P, Johansson C. Safe pedestrian crossings for children and elderly. Accid Anal Prev 2006;38(2):289–94. PMID: 16263073. doi: 10.1016/j. aap.2005.09.012.
24. Koepsell T, McCloskey L, Wolf M, Vernez Moudon A, Buchner D, Kraus J, et al. Crosswalk markings and the risk of pedestrian-motor vehicle collisions in older pedestrians. JAMA 2002;288(17):2136–43. PMID: 12413373.
25. Zegeer C, Stewart J, Huang H, Lagerwey P. Safety Effects of Marked vs. Unmarked Crosswalks at Uncontrolled Locations: Final Report and Recommended Guidelines. FHWA-HRT-04-100. McLean, VA: U.S. Department of Transportation, Federal Highway Administration (FHWA), 2005; 104 p. 26. Retting RA, Ferguson SA, McCartt AT. A review of evidence-based traffic
engineering measures designed to reduce pedestrian-motor vehicle crashes. Am J Public Health2003;93(9):1456–63. PMID: 12948963.
27. Morency P, Archambault J, Cloutier MS, Tremblay M, Plante C, Dubé AS. Sécurité des piétons en milieu urbain: enquête sur les aménagements routiers aux intersections. Montréal, QC: Agence de la santé et des services sociaux, direction de santé publique, 2013; 34 p.
28. Garder PE. The impact of speed and other variables on pedestrian safety in Maine. Accid Anal Prev 2004;36(4):533–42. PMID: 15094405. doi: 10.1016/ S0001-4575(03)00059-9.
29. Toronto Centre for Active Transportation. Complete Streets by Design; Toronto Streets Redesigned for All Ages and Abilities. 2012; 25 p. Available at http://completestreetsforcanada.ca/complete-streets-design (Accessed March 22, 2015)
30. Hess PM. Avenues or arterials: The struggle to change street building practices in Toronto, Canada. J Urban Des 2009;14(1):1–28. doi: 10.1080/ 13574800802451049.
Received: September 25, 2014 Accepted: June 25, 2015
RÉSUMÉ
OBJECTIFS : Décrire les intersections avec routes majeures (artère, collectrice) en milieu urbain, et explorer l’association entre les caractéristiques de ces intersections et le nombre de piétons blessés. MÉTHODES : Les caractéristiques de 512 intersections (Montréal, Québec), sélectionnées via un échantillonnage aléatoire stratifié ont été mesurées. Le nombre de piétons blessés provient des services ambulanciers (1999–2008). L’association entre les caractéristiques des intersections et le nombre de
piétons blessés (RTI : rapports de taux d’incidence) a été quantifié par des régressions binomiales négatives : 1) incluant toutes les intersections; 2) incluant les intersections de rues ayant plusieurs voies de circulation; 3) incluant les intersections pour lesquelles des comptages de véhicules et de piétons étaient disponibles.
RÉSULTATS : Les intersections majeures ont davantage de voies de circulation (3,8 c. 1,7,p < 0,01) et des traverses pour piétons plus longues (18,8 m c. 12,7 m,p < 0,01) que les intersections de rues locales. Les arrêts d’autobus y sont plus fréquents (75 % c. 6 %, p < 0,01). Globalement, chaque voie additionnelle de circulation est associée à une augmentation de 75 % du nombre de piétons blessés (RTI = 1,75; IC95% = 1,41–2,18). Aux intersections de rues ayant plusieurs voies de circulation, une quatrième branche (RTI = 2,40; IC95% = 1,53–3,77), la présence de véhicules
stationnés à moins de 5 m de l’intersection (RTI = 2,40; IC95% = 1,64–3,51) et le marquage de passages pour piétons (RTI = 1,79; IC95% = 1,08–2,95) sont significativement associés à une augmentation du nombre de piétons blessés.
CONCLUSION : Les résultats démontrent qu’au-delà des volumes de trafic et de piétons, les caractéristiques des intersections avec routes majeures contribuent au plus grand nombre de blessés piétons. La réduction des voies de circulation, l’interdiction de stationner près des coins de rue et d’autres aménagements pertinents pourraient y améliorer la sécurité des piétons en milieu urbain.