_____________________________________________________________________________________________________ *Corresponding author: E-mail: mariama-dalanda.diallo@ugb.edu.sn;
32(7): 26-40, 2020; Article no.IJPSS.57878 ISSN: 2320-7035
Influence of Anthropic and Topographic Factors on
the Physicochemical Properties of the Soil around
Temporary Pools in Ferlo, North Senegal
Ndiabou Faye
1, Mariama Dalanda Diallo
2,3,4*, Jean Luc Peiry
5, Aly Diallo
6and Aliou Guisse
1,3,41
Department of Plant Biology, Cheikh Anta Diop University, B.P. 5005, Dakar, Senegal. 2
Gaston Berger University, UFR of Agronomic Sciences, Aquaculture and Food Technologies, B.P. 234, Saint Louis, Senegal.
3UMI 3189 "Environnement, Santé, Sociétés" UGB, UCAD, CNRS, CNRST, USTTB, Dakar, Senegal.
4
Observatoire Homme-Milieux international de Téssékéré, CNRS/Université Cheikh Anta Diop, Dakar, Senegal.
5Clermont Auvergne University, 63001 Clermont-Ferrand, Cedex 1, France.
6Assane Seck University, Department of Agroforestry, B.P. 523 Néma, Ziguinchor, Senegal.
Authors’ contributions This work was carried out in collaboration among all authors. All authors read and approved the final
manuscript.
Article Information DOI: 10.9734/IJPSS/2020/v32i730302 Editor(s): (1) Dr. Yong In Kuk, Sunchon National University, South Korea. Reviewers: (1)Priscila Vogelei Ramos, Universidad de Burgos, Spain. (2)Christtiane Fernandes Oliveira, University of Campinas, Brazil. (3)Ankita Rajeev Mishra, DCRUST, India. Complete Peer review History:http://www.sdiarticle4.com/review-history/57878
Received 05 April 2020 Accepted 12 June 2020 Published 22 June 2020
ABSTRACT
The temporary ponds at Ferlo constitute wetlands whose pastoral activity is of paramount importance in the economy of Senegal. These zones are characterized by a fairly specific microclimate (soft and humid), a shallow depth of the water table, alternating phases of submersion and exudation whose functioning is linked to the soil. Thus the restoration and conservation of these wetlands requires a good knowledge of the soil factors.
The objective of this study is to compare the physico-chemical parameters of the soil around temporary pools in grazed and ungrazed areas and different topographical units in order to determine their relative similarities.
Faye et al.; IJPSS, 32(7): 26-40, 2020; Article no.IJPSS.57878
The samples taken at different horizons from seven soil pits (P1, P2, P3, P4, P5, P6 and P7) opened
in the different morpho-pedological facies of two grazed ponds and one ungrazed pond were analyzed in the laboratory.
The results obtained show that the soils of Ferlo have a sandy texture and low fertility in the slopes and plateaus. However, they have a balanced texture and average fertility in ponds and ungrazed areas. The factorial analysis made it possible to highlight three distinct soil classes. A class of sandy texture soil with very low chemical fertility comes from the plateau. A class of soil with a balanced texture which is rich in cation and calcium exchange capacity found in the low zones of strong mineralization. A last class rich in chemical element with a silty texture which is found in wooded areas.
These results thus reveal the predominant influence of anthropic and topographic factors on the evolution and physico-chemical composition of the soil.
Keywords: Wetland; grazed; soil factors; slopes; plateaus; physicochemical fertility.
1. INTRODUCTION
At the Ferlo, the temporary pools constitute wetlands where pastoral activity is of capital importance in the economy of Senegal. These areas are characterized by a rather particular microclimate (mild and humid), a shallow water table, alternating phases of submersion and
exoneration among others. They provide
livestock with water and food during the entire rainy season thanks to the possibilities of watering and the fragmentation of the pastoral load [1,2] due to the optimal exploitation of the resulting fodder resources [3,4,5]. These ponds, located at the interface between the aquatic and terrestrial environment, are exceptionally rich in ecological diversity and teeming with life [6]. They are thus living and breeding grounds for a diverse, abundant and often rare flora [7]. Given the importance of ponds for human activities and animal and plant biodiversity, several research projects have been carried out to date: Mapping the location of ponds [8], study of the role that ponds play in rangelands [9], their role in conserving biodiversity and the living environment of pastoral populations [10], a classification of ponds [11], analysis of the role of ponds in the management of Sahelian pastoral systems in the Ferlo [1] and a study of health risks in the Ferlo in relation to pond water [12] among others.
However, these ponds, which occupy the most forested areas in the Ferlo, have not been spared by the series of persistent droughts and increasing anthropisation. This has resulted in the disappearance of the ponds' open water layer and its replacement by wet afforestation. Thus, it would be interesting, in order to better understand the functioning of these fragile ecosystems, to proceed with their ecological
characterization. It is clear that good
management of space or land can only be conceived on the basis of a good knowledge of soils and their properties.
While work on the edaphic factors of ponds is lacking, this study aims to characterize and evaluate the physico-chemical parameters of the soil under the influence of anthropogenic and topographic gradients (toposequence) in two areas, one grazed and one ungrazed. The work is based on the hypothesis that ponds remain the areas richest in mineral elements. The latter are also subject to topographic and anthropogenic factors.
2. MATERIALS AND METHODS 2.1 Presentation of the Study Area
The study was carried out in the center of Ferlo, in northern Senegal at the WIDOU THIENGOLY station (15°58'30'' N and 15°17'90''W) over the period from August 2018 in September 2019. The climate is of the arid Sahelian type, characterized by the alternation of a long dry season which lasts nine months (from October to June) and a short rainy season of three months (from July to September) [13] With the current situation marked by a drop in rainfall, the station is between 300 and 400 mm isohyets. The rainfall varies from year to year with an average of 371.67 mm over the past fifty years (rainfall data from the weather station of the "Center for Zoo-technical Research in Dahra" [14]. The
averagetemperaturehoversaround27.73°C[15].
The relief of the study area is little uneven with tropical and brown-red subarid soils formed of sandy materials poor in clay [15]. The absence of uneven reliefs limits the development of the hydrographic network which shows no trace of organized flow. It is characterized in the rainy
season by the presence of a multitude of small endorheic ponds.
The vegetation is in the form of a shrubby to treed steppe. It is a mixed formation of thick, usually thorny trees and shrubs and a discontinuous mat of annual species dominated by grasses during the rainy season
layer is marked by the strong presence of
Balanites aegyptiaca L. Del. Which
constitutes mono-specific stands by the presence of Acacia tortilis var. raddiana Forst.
senegal L. while the shrub layer consists of Calotropis procera Ait. And Boscia senegalensis
Pers. As for the herbaceous layer, species such as Alysicarpus ovalifolius Schumach. &
Aristida mutabilis Trin. & Rupr, Cenchrus bifloris
Roxb, Digitaria horizontalis Willd,
tremula Lam. Hochst. Ex Steud, Schoenefeldia gracilis Kunth, Tribulus terrestris Auct
glochidiata Rchb. ex DC are the most frequent
[17,18].
2.2 The Choice of Ponds
The choice of ponds is based on two essential criteria: the type of activity developed since the
Fig. 1. Map showing the location of ponds and soil profil map were 28 obtained from the
Faye et al.; IJPSS, 32(7): 26-40, 2020; Article no.IJPSS.
season by the presence of a multitude of small
The vegetation is in the form of a shrubby to a mixed formation of thick, usually thorny trees and shrubs and a discontinuous mat of annual species dominated [16]. The tree layer is marked by the strong presence of L. Del. Which sometimes by the presence Forst. And Acacia L. while the shrub layer consists of
Boscia senegalensis
Pers. As for the herbaceous layer, species such Schumach. & Thonn,
Cenchrus bifloris
Willd, Eragrostis
Schoenefeldia
Auct and Zornia the most frequent
The choice of ponds is based on two essential the type of activity developed since the
ponds are used differently [1] and the type of development. On this basis, three ponds were chosen: WENDOU MARODI or lions pond, BELEL SOW and BELEL LOUGAL ponds or hole pond (artisanal surface wells) (Fig.
WENDOU MARODI is a pond where the
degree of anthropisation is very low. It been closed for decades to house the activities of the German project (the Senegalese German Reforestation Project for the North Zone aimed to restore and enhance the environment through large scale reforestation programs) [19]. In 2018 the fence was reinforced by the Great Green Wall project.
BELEL SOW is a private pond belonging to
an old man from the village of Belel Sow. It is very protected but anthropogenic action is very regular since the owner has a large livestock.
BELEL LOUGAL was dug by the
local population to exploit the water of a
small alluvial water table. It is a
grazed pond, of course, but the
accessibility to animals is very limited by the holes.
cation of ponds and soil profil. Numerical data used to construct the map were 28 obtained from the centre of ecological monitoring, Dakar, Senegal
; Article no.IJPSS.57878
and the type of development. On this basis, three ponds were chosen: WENDOU MARODI or lions pond, BELEL SOW and BELEL LOUGAL ponds or hole
artisanal surface wells) (Fig. 1).
WENDOU MARODI is a pond where the degree of anthropisation is very low. It has been closed for decades to house the activities of the German project (the Senegalese German Reforestation Project for the North Zone aimed to restore and enhance the environment through large-scale reforestation programs) [19]. In 2018
reinforced by the Great BELEL SOW is a private pond belonging to an old man from the village of Belel Sow. It is very protected but anthropogenic action is very regular since the owner has a large
BELEL LOUGAL was dug by the
local population to exploit the water of a
small alluvial water table. It is a
grazed pond, of course, but the
accessibility to animals is very limited by
Numerical data used to construct the , Dakar, Senegal
2.3 Field Data Collection
Soil pits have been dug in the different geomorphological units of the three ponds. The sections are wide enough and deep enough to identify the soil horizons and their lateral variations (Photo 1). These soil pits were dug
along transverse transects at inter
depressions, at 3 easily identifiable points on the ground: 1) in the lower part of the paleo
in the interface zone between the paleo dune and the pond (edge of the pond) and 3) in the bottom of the pond.
To carry out our field studies, we proceeded as follows:
• Identification of the different
geomorphological units and positioning of the soil profiles to be studied (these profiles are geo-referenced);
• Digging of soil pits and the identification of the different horizons of the soil (H
H3 and H4) and their lateral variations
(Photo 1a);
• Description of the profiles by presenting for each delimited horizon, its color, its
structure (presence or absence of
aggregates, their shape, their dimensions and their sharpness), its consistency, its degree of humidity and the transition with the next layer. The immediate environment
Photo 1. Soil profile and profile environment of the transition zone (Lions'
Faye et al.; IJPSS, 32(7): 26-40, 2020; Article no.IJPSS.
Soil pits have been dug in the different s of the three ponds. The sections are wide enough and deep enough to identify the soil horizons and their lateral variations (Photo 1). These soil pits were dug
along transverse transects at inter-dune
depressions, at 3 easily identifiable points on the round: 1) in the lower part of the paleo-dune, 2) in the interface zone between the paleo dune and the pond (edge of the pond) and 3) in the
To carry out our field studies, we proceeded as
of the different
orphological units and positioning of the soil profiles to be studied (these of soil pits and the identification of the different horizons of the soil (H0, H1, H2,
) and their lateral variations of the profiles by presenting for each delimited horizon, its color, its
structure (presence or absence of
aggregates, their shape, their dimensions and their sharpness), its consistency, its degree of humidity and the transition with layer. The immediate environment
of the profile (Photo 1b) which are
important in the description (the
information around the profile) has been recorded on the soil description sheet;
• Soil sampling: representative samples
were taken and served as a support laboratory analyzes (texture, soil pH, soil mineral elements among others). They are made from the bottom horizon to the top to avoid mixing particles.
2.4 Physicochemical Analyses in the Laboratory
The study carried out in the laboratory consists o
sample preparation operations for the
measurement of physico-chemical parameters. The analyses were carried out at the Senegalese Institut of Agricultural Research (ISRA) at the Saint-Louis in February 2019. It involved 27 soil samples for the determination of granulometry,
hydrogen potential (pH) and electrical
conductivity (EC) and 36 soil samples for other chemical elements.
Particle size is obtained by the sieving method for coarse elements and by densimetry
Robinson pipette for fine elements; pH and (EC) were obtained from soil suspensions with soil/water ratios of 1/2.5 and 1/10 respectively. Acidity and salinity were judged according to the standards of Ndiaye and Bocoum [14,20].
Photo 1. Soil profile and profile environment of the transition zone (Lions' pond slope
; Article no.IJPSS.57878
1b) which are
important in the description (the
information around the profile) has been recorded on the soil description sheet;
sampling: representative samples were taken and served as a support for laboratory analyzes (texture, soil pH, soil mineral elements among others). They are made from the bottom horizon to the top to
Physicochemical Analyses in the
The study carried out in the laboratory consists of
sample preparation operations for the
chemical parameters. The analyses were carried out at the Senegalese Institut of Agricultural Research (ISRA) at the Louis in February 2019. It involved 27 soil ion of granulometry,
hydrogen potential (pH) and electrical
conductivity (EC) and 36 soil samples for other
Particle size is obtained by the sieving method for coarse elements and by densimetry with a Robinson pipette for fine elements; pH and (EC) were obtained from soil suspensions with soil/water ratios of 1/2.5 and 1/10 respectively. Acidity and salinity were judged according to the standards of Ndiaye and Bocoum [14,20].
Faye et al.; IJPSS, 32(7): 26-40, 2020; Article no.IJPSS.57878
The carbon determination is done by the modified Black & Wakley method. The organic carbon is oxidized with a mixture of 1N
potassium dichromate (K2Cr2O7) and
concentrated sulphuric acid (H2SO4) d=1.84.
Nitrogen mineralization was carried out in the
presence of concentrated sulphuric acid
(H2SO4 at 18N). Salicylic acid (C7H6O3),
hydrogen peroxide (H2O2) and selenium
powder as catalyst (the Kjeldhal method). Assimilable phosphorus is obtained by the
original Olsen method modified according to Dabin. The soil is leached with an ammonium acetate solution to have the cation exchange capacity. The amount of ammonium
retained by the soil after washing off the
excess ammonium acetate is an
estimate of the cation exchange capacity (CEC).
The retained ammonium is released by
percolation and is determined by
Spectrophotometer.
The exchangeable bases (Na, K, Ca, and Mg) will be determined in the first percolate by atomic absorption. The organic matter (OM), the C/N ratio and the base saturation rate (T = sum of exchangeable bases/CEC) are deducted by calculation.
2.5 Data Processing
The results obtained after the laboratory analysis were entered and processed on R Markdown from R studio, an open source software [21] and Microsoft Excel. Principal component analysis and classification allowed for the grouping of physicochemical parameters that are more
correlated since the variables are not
independent and correlate with each other [22]. A row matrix of the 27 horizons of the 7 soil profiles described and a column matrix of the 14 physicochemical parameters measured were used for this analysis.
3. RESULTS AND DISCUSSION
3.1 Physicochemical Characteristics of Soils
3.1.1 Hydrogen potential (pH) and electrical conductivity (EC)
Fig. 2 illustrates the variation in the Hydrogen Potential (pH) of the horizons in the different
topographic units around the three ponds studied soil pH at the plateau level varies from 6.52 to 8.06. With the exception of the last horizon of the hole pond which is slightly acidic (6.52) and the H3 and H4 horizons of the Belel Sow pond which are neutral (between 6.7 and 7.2),the plateau horizons have a pH ranging from slightly alkaline (between 7.3 and 7.9) to alkaline (between 8 and 8.5). The pH of
the slope soils ranges from 6.06 to 7.9; all the horizons of the lion pond have a slightly alkaline pH, while most of the horizons of
the other ponds have a slightly acidic to neutral pH. At the level of the ponds, the pH of
the soils varies from 6.28 to 7.55; almost all the horizons have a slightly acidic to neutral pH. The difference between water pH and KCl pH ranges from 1.45 to 2.31 for the plateaus,
1.28 to 2.01 for the slopes and 1.06 to 2 for the ponds.
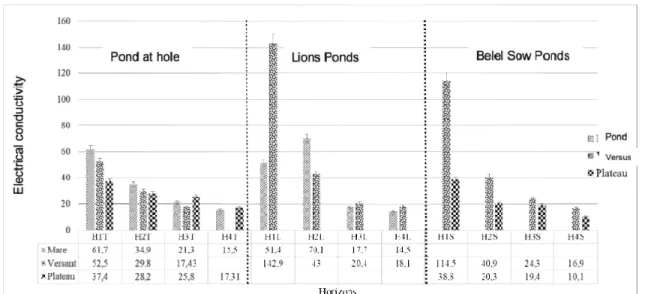
Fig. 3 shows the change in electrical conductivity (EC) as a function of the horizons of the different profiles. The electrical conductivity of the soils of the different topographical units varies from 10
to 38.8 μS/cm on the plateaus; from
17.43 to 142.9 μS/cm on the slopes and from 15.5 to 70.1 μS/cm on the ponds. This
translates that the soil of our study area is
generally non-saline (Fig. 3). However,
these soils present higher electrical
conductivities at the level of the first horizons. The highest value is found on the slope of the lion pond.
3.1.2 Granulometry
The soil on the plateau is 84% sand (Fig. 4).
They have a sandy texture on all the horizons obtained, whereas the soil on the
slopes is characterized by a clayey texture on the first horizons of the hole pond and the
Belel Sow pond and a sandy-silt texture on the deep horizons. Similarly, the texture of the first horizons of the pond profiles is clayey and the texture of the deep horizons is sandy (Table 1). However, the ponds and slopes have a balanced texture, successively clay-sandy and silty-sandy (Fig. 4).
Fig. 5 shows the difference in texture between grazed and ungrazed areas in our Study Area. For example, the texture of the surface horizons of the grazed areas is sandy while the texture of the surface horizons of the ungrazed areas is balanced.
3.2 Variation of Soil Chemical Parameters as a Function of the Different Topographical Units of the Ponds
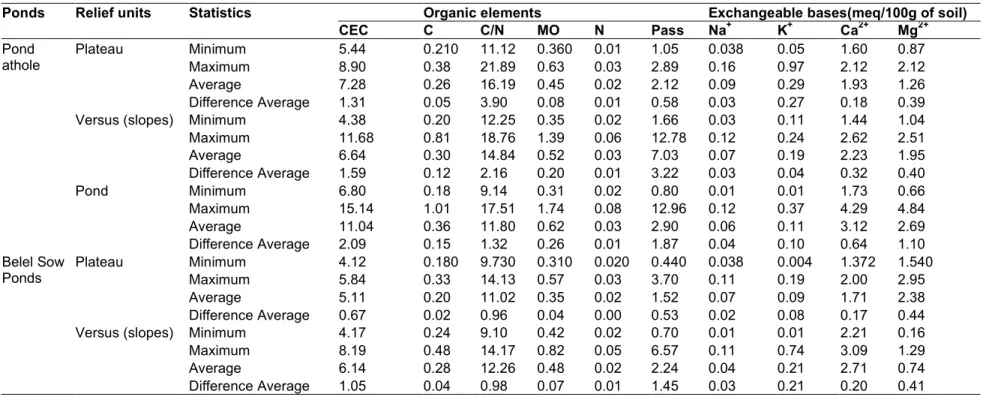
Cation exchange capacity (CEC), carbon content (C), C/N ratio, organic matter (OM) content, nitrogen (N) content, assimilable ph
(Pass) and exchangeable bases (Sodium (Na Potassium (K+). Calcium (Ca2+) and Magnesium (Mg2+)) are essential mineral elements that provide information on soil chemical fertility. These elements all have a potential impact on soil evolution (Table 2).The average cation exchange capacity (CEC) varies between 11.04 to 11.41 meq/100 g in ponds; 6.14 to 10.01 meq/100 g on slopes (versus) and 5.11 to 7.28 meq/100 g on plateau. The CEC is low in grazed areas (ponds at hole and Belel Sow ponds) except for the bottom of the pond and average in ungrazed areas (Lion ponds). Carbon and organic matter contents vary according to the ponds and topographical units. The highest average carbon and organic matter contents were found in the lion pond (0.48% and 0.83 and the lowest in the Belel Sow pond plateau (0.2% and 0.35%).The soils studied are very poor in nitrogen. Average contents vary between 0.02 and 0.04%. The highest nitrogen levels were observed on the surface horizons. Like the carbon and organic matter contents of the soils, the nitrogen rate decreases at depth and the highest rates were observed from the lion pond
Fig. 2. Variation of the pH of the different profiles according to horizons and ponds
Faye et al.; IJPSS, 32(7): 26-40, 2020; Article no.IJPSS.
Variation of Soil Chemical Parameters as a Function of the Different Topographical Units of the Ponds
Cation exchange capacity (CEC), carbon content (C), C/N ratio, organic matter (OM) content, assimilable phosphorus (Pass) and exchangeable bases (Sodium (Na+), ) and Magnesium )) are essential mineral elements that provide information on soil chemical fertility. These elements all have a potential impact on le 2).The average cation exchange capacity (CEC) varies between 11.04 g in ponds; 6.14 to 10.01 g on slopes (versus) and 5.11 to 7.28 g on plateau. The CEC is low in grazed areas (ponds at hole and Belel Sow ponds) or the bottom of the pond and average in ungrazed areas (Lion ponds). Carbon and organic matter contents vary according to the ponds and topographical units. The highest average carbon and organic matter contents were found in the lion pond (0.48% and 0.83%) and the lowest in the Belel Sow pond plateau (0.2% and 0.35%).The soils studied are very poor in nitrogen. Average contents vary between 0.02 and 0.04%. The highest nitrogen levels were observed on the surface horizons. Like the r contents of the soils, the nitrogen rate decreases at depth and the highest rates were observed from the lion pond
(0.04%). The average carbon to nitrogen (C/N) ratio varies between 11.02 and 16.19. Almost all the topographical units studied in the graze
area have a high average degree of
mineralization, whereas that of the lion pond is normal.
Assimilable phosphorus contents are very low in the soil samples from the plateau. They are very high in the superficial horizons. They decrease with depth and are higher in the lion pond (ungrazed zone) (19.41ppm).
The soils in our study area have low exchangeable base contents (less than 5.39 meq/100 g). The average calcium content
dominates largely followed by those of
magnesium and potassium and by far
The proportions of exchangeable bases are very low on the plateaus and slopes, except for calcium and sodium, the highest average contents of which are observed on the slope of
the lion pond (Ca2+: 5.39 meq/100 g) and on the
plateau of the hole pond (Ca2+: 0.09 meq/100
3.3 Spatial Variation of Soils
The results of the principal component analysis show that the first two axes (Dim1 and Dim2) account for 56.09% of the initial information. This is sufficient for a good interpretation and that most of the analysis can be done in the plan obtained by crossing these two axes (Table 3).
2. Variation of the pH of the different profiles according to horizons and ponds
; Article no.IJPSS.57878
(0.04%). The average carbon to nitrogen (C/N) ratio varies between 11.02 and 16.19. Almost all the topographical units studied in the grazed
area have a high average degree of
mineralization, whereas that of the lion pond is
Assimilable phosphorus contents are very low in the soil samples from the plateau. They are very high in the superficial horizons. They decrease are higher in the lion pond
The soils in our study area have low exchangeable base contents (less than 5.39 meq/100 g). The average calcium content
dominates largely followed by those of
magnesium and potassium and by far sodium. The proportions of exchangeable bases are very low on the plateaus and slopes, except for calcium and sodium, the highest average contents of which are observed on the slope of : 5.39 meq/100 g) and on the : 0.09 meq/100 g).
The results of the principal component analysis show that the first two axes (Dim1 and Dim2) account for 56.09% of the initial information. This is sufficient for a good interpretation and that t of the analysis can be done in the plan obtained by crossing these two axes (Table 3).
Fig. 3. Variation of the electrical conductivity of the different profiles as a function of horizons
Fig. 4. Variation in the rate of mineral particles (sands. clays and silts) in the soil of different
Fig. 5. Variation in the level of mineral particles (sands. clays and silts) in the soil of grazed
Faye et al.; IJPSS, 32(7): 26-40, 2020; Article no.IJPSS.
Variation of the electrical conductivity of the different profiles as a function of horizons and ponds
4. Variation in the rate of mineral particles (sands. clays and silts) in the soil of different topographic units
Variation in the level of mineral particles (sands. clays and silts) in the soil of grazed and ungrazed areas
; Article no.IJPSS.57878
Variation of the electrical conductivity of the different profiles as a function of horizons
4. Variation in the rate of mineral particles (sands. clays and silts) in the soil of different
Faye et al.; IJPSS, 32(7): 26-40, 2020; Article no.IJPSS.57878
33
Table 1. Soil texture of the different horizons according to geomorphological units and ponds Pond with hole Lions' pond Belel SOW pond
Pond Versus Plateau Pond Versus Versus Plateau
H1 Sable-Limoneous Sandy clay Sableuse Sandy clay Sable-Limoneous Sandy clay Sableuse
H2 Sable-Limoneous Sable-Limoneous Sableuse Sableuse Sable-Limoneous Sable-Limoneous Sableuse
H3 Sable-Limoneous Sable-Limoneous Sableuse Sandy clay Clayeysand Sable-Limoneous Sable-Limoneous
H4 Sableuse - Sableuse Clayeysand Clayeysand Sable-Limoneous Sableuse
Table 2. Some statistical parameters according to the geomorphological units of the different ponds
Ponds Relief units Statistics Organic elements Exchangeable bases(meq/100g of soil) CEC C C/N MO N Pass Na+ K+ Ca2+ Mg2+ Pond athole Plateau Minimum 5.44 0.210 11.12 0.360 0.01 1.05 0.038 0.05 1.60 0.87 Maximum 8.90 0.38 21.89 0.63 0.03 2.89 0.16 0.97 2.12 2.12 Average 7.28 0.26 16.19 0.45 0.02 2.12 0.09 0.29 1.93 1.26 Difference Average 1.31 0.05 3.90 0.08 0.01 0.58 0.03 0.27 0.18 0.39
Versus (slopes) Minimum 4.38 0.20 12.25 0.35 0.02 1.66 0.03 0.11 1.44 1.04
Maximum 11.68 0.81 18.76 1.39 0.06 12.78 0.12 0.24 2.62 2.51 Average 6.64 0.30 14.84 0.52 0.03 7.03 0.07 0.19 2.23 1.95 Difference Average 1.59 0.12 2.16 0.20 0.01 3.22 0.03 0.04 0.32 0.40 Pond Minimum 6.80 0.18 9.14 0.31 0.02 0.80 0.01 0.01 1.73 0.66 Maximum 15.14 1.01 17.51 1.74 0.08 12.96 0.12 0.37 4.29 4.84 Average 11.04 0.36 11.80 0.62 0.03 2.90 0.06 0.11 3.12 2.69 Difference Average 2.09 0.15 1.32 0.26 0.01 1.87 0.04 0.10 0.64 1.10 Belel Sow Ponds Plateau Minimum 4.12 0.180 9.730 0.310 0.020 0.440 0.038 0.004 1.372 1.540 Maximum 5.84 0.33 14.13 0.57 0.03 3.70 0.11 0.19 2.00 2.95 Average 5.11 0.20 11.02 0.35 0.02 1.52 0.07 0.09 1.71 2.38 Difference Average 0.67 0.02 0.96 0.04 0.00 0.53 0.02 0.08 0.17 0.44
Versus (slopes) Minimum 4.17 0.24 9.10 0.42 0.02 0.70 0.01 0.01 2.21 0.16
Maximum 8.19 0.48 14.17 0.82 0.05 6.57 0.11 0.74 3.09 1.29
Average 6.14 0.28 12.26 0.48 0.02 2.24 0.04 0.21 2.71 0.74
Faye et al.; IJPSS, 32(7): 26-40, 2020; Article no.IJPSS.57878
34
Ponds Relief units Statistics Organic elements Exchangeable bases(meq/100g of soil) CEC C C/N MO N Pass Na+ K+ Ca2+ Mg2+
Lions Ponds
Versus (slopes) Minimum 7.45 0.27 8.32 0.46 0.02 1.23 0.03 0.02 4.34 0.05
Maximum 11.02 0.76 12.75 1.31 0.09 14.10 0.12 0.33 7.01 1.12 Average 10.01 0.32 11.14 0.55 0.03 2.37 0.07 0.12 5.39 0.70 Difference Average 0.79 0.07 1.24 0.12 0.01 1.81 0.03 0.11 0.81 0.33 Pond Minimum 9.09 0.31 8.50 0.53 0.02 14.10 0.04 0.23 4.04 0.12 Maximum 12.51 0.80 15.53 1.37 0.08 37.56 0.16 0.52 6.95 2.30 Average 11.41 0.48 12.38 0.83 0.04 19.41 0.08 0.34 5.21 0.97 Difference Average 1.20 0.10 2.96 0.17 0.01 5.76 0.04 0.07 0.78 0.70
Faye et al.; IJPSS, 32(7): 26-40, 2020; Article no.IJPSS.57878
Table 3. Eigen value and percentage variance of the most important factor axes
Dim1 Dim2 Dim3 Dim4 Dim5 Eigen value 5.62 2.23 1.67 1.29 1
Inertie (%) 40.14 15.95 9.2 7.02 5.37
% cumulative 40.14 56.09 67.99 77.19 84.21
For the definition of the Dim1*Dim2 plan, the physicochemical parameters whose contribution in relation to these two axes is higher than the average are: carbon (95.49%), organic matter (95.21%), nitrogen (89.16%), sand (76.68%), clay (74.2%), calcium (66.06%), assimilable phosphorus (59.52%) and cation exchange capacity (51.45%). The other parameters have a contribution higher than 25% except for sodium (1.56%) which has a good contribution on the third dimension (45.89%).
The horizons whose contribution to the plan is above average are P1H2 (75%), P1H3 (70%), P1H4 (50%), P2H1 (58%), P2H3 (85%), P3H1 (85%), P3H2 (50%), P4H0 (58%), P4H1 (62%), P4H2 (57%), P4H3 (76%), P6H1 (63%), P6H3 (52%), P6H4 (54%), P7H1 (76%), P7H2B (82%). The horizon with a low contribution (<25%) are P3H3H (3%), P5H1 (15%), P7H3 (17%) and P7H2H (20%) (Fig. 6).
The horizons on the positive side of axis 1 are rich in organic matter, assimilable phosphorus, nitrogen, carbon, cation exchange capacity, electrical conductivity among others. On the other hand, those on the negative side of this axis are devoid of these elements, with a basic pH and rich in sand.
The horizons on the positive side of axis 2 are rich in magnesium and sand and devoid of clay, while those on the negative side of the axis are rich in clay (Fig. 6).
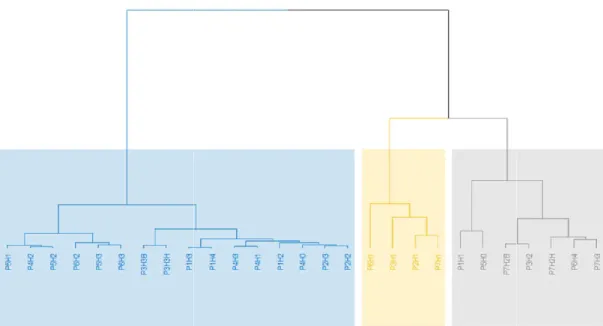
The following classification allows us to group the physico-chemical parameters that are correlated and the horizons that compose them into three classes. The results obtained show three (03) groups in blue class1, black class2 and yellow class3 (Fig. 7).
The tables below present the characteristic variables of each class and the horizons. They serve as a basis for interpreting the classes (Table 4).
V. test or test value is expressed as the number of standard deviations of a normal distribution. It is interpreted by evaluating the distance between the general mean and the mean and the mean in
the class. This common unit allows a comparison between the variables and sorts in order of importance. If the term is positive, the group is characterized by strong values of the variable on the other hand if the term is negative, the group is characterized by weak values of the variable. The physico-chemical parameters are grouped into three (03) distinct classes. They are presented as follows:
1st class is composed of eight (08) horizons coming from the vicinity of the pond at Trou, including four (04) on the plateaus, two (02) on the slopes and two (02) at the level of the pond; seven (07) in the vicinity of the Belel Sow pond, including (04) on the plateaus and three (03) on the slopes and one (01) from the lion pond, including horizon 2 of the slope. These horizons contain on average 78.8% sand and are poor in certain physico-chemical elements such as
electrical conductivity, clay, assimilable
phosphorus, nitrogen, organic matter, carbon, cation exchange capacity (CEC) and calcium. These are the poorest areas.
2nd class consists of horizons whose determining parameters are calcium, clay, cation exchange capacity and an average proportion of sand. This class includes five (05) horizons in the surroundings of the lion pond (two at the level of the slope and three at the level of the pond) and horizon 2 of the hole pond.
3rd class consists of two (02) horizons from the lion pond and two (02) horizons from the hole pond. It includes the superficial horizons of ponds and slopes. These are horizons rich in organic matter, carbon, nitrogen. assimilable phosphorus, silt and potassium. The pH is slightly acid and the electric conductivity is around 84.6 μS/cm. These are the fertile areas.
3.4. Discussion
The physico-chemical parameters of the soils of the different zones studied in the village of WIDOU THIENGOLY show a significant spatial variability. The different horizons of the plateau have a slightly alkaline to alkaline hydrometric potential (pH). Considering the slopes, the
horizons of the ungrazed pond have a slightly alkaline pH while the horizons of the other grazed ponds have a slightly acidic to neutral pH. In the same way at the level of the ponds, the different horizons have a slightly acidic to neutral pH. These results do not agree with those of Ndiaye [23], which prove that the Ferlo soils are
Fig. 6. Plane of horizons and physico
Fig. 7. Dendrogram obtained from the classification of the analysis into major components
Faye et al.; IJPSS, 32(7): 26-40, 2020; Article no.IJPSS.
horizons of the ungrazed pond have a slightly alkaline pH while the horizons of the other grazed ponds have a slightly acidic to neutral pH. In the same way at the level of the ponds, the different horizons have a slightly acidic to neutral H. These results do not agree with those of Ndiaye [23], which prove that the Ferlo soils are
characterized by high acidity. The soils of our study area like those of the Ferlo in general are non-saline (10 to 142.9 μS/cm) whatever the topographic unit and the pond. It should be noted that in the central Ferlo, there is the inexistence of a marine intrusion and the absence of irrigation by salt water.
6. Plane of horizons and physico-chemical properties formed by Dim1 and Dim3
7. Dendrogram obtained from the classification of the analysis into major components
; Article no.IJPSS.57878
characterized by high acidity. The soils of our study area like those of the Ferlo in general are saline (10 to 142.9 μS/cm) whatever the the pond. It should be noted that in the central Ferlo, there is the inexistence of a marine intrusion and the absence of
chemical properties formed by Dim1 and Dim3
Faye et al.; IJPSS, 32(7): 26-40, 2020; Article no.IJPSS.57878
37
Table 4. Determinant variables of class Class 1
V. test Variable mean Overall average of the variable Components of the class
Sandy (S) 3.1 78.8 74.4 P1H1 - P1H2 – P1H3 - P1H4 – P2H2 - P2H3 – P3H3H -P3H3B – P4H0 - P4H1 – P4H2 - P4H3 – P5H1 - P5H2 – P5H3 - P6H2
Electrical conductivity (EC) -2.4 25.4 37.2
Clay(A) -2.5 12.8 16.1
Assimilable phosphorus (Pass) -3.2 2.2 6.5
Nitrogen (N) -3.4 0.02 0.03
Organic metter (MO) -3.5 0.4 0.6
Carbone (C) -3.5 0.3 0.4
Cation exchange capacity(CEC) -3.7 6.6 8.2
Calcium (Ca2+) -3.9 2.3 3.3
Class 2
V. test Variable mean Overall average of the variable Components of the class
Calcium (Ca2+) 3.9 5.4 3.3 P3H2 - P6H3 –
P6H4 - P7H2H – P7H2B - P7H3 – P5H0
Clay (A) 3 25.1 16.1
Cation exchange capacity (CEC) 2.9 11 8.2
Sandy (S) -2.3 67.2 74.4
Class 3
V. test Variable mean Overall average of the variable Components of the class
Organic matter (OM) 4.28 1.26 0.64
P2H1 - P3H1 – P6H1 - P7H1
Carbone (C) 4.27 0.73 0.37
Nitrogen (N) 4.25 0.07 0.03
Electrical conductivity (EC) 3.81 84.6 37.22
Assimilable phosphorus (Pass) 3.07 16.79 6.47
Silt (L) 3.06 14.9 9.44
Potassium (K+) 2.04 0.4 0.22
Faye et al.; IJPSS, 32(7): 26-40, 2020; Article no.IJPSS.57878
Soil texture in this area is characterized by a dominance of the sandy fraction over clays and silts, especially on the uplands. In fact, a sandy texture is found in all the horizons of the plateau and the deep horizons of the slope. The first horizons of the slope and ponds have a balanced texture. This can be explained by the nature of the original material or source rock and the process of erosion that carries the fine particles into the lower areas. On the other hand, the sandy texture of the surface layer of the puddle pond is due to the fact that the holes are dug. Indeed, the coarse particles come from the deep layers, and this profile is within 2 m of a hole. In addition, the texture of the surface horizons of the grazed areas is sandy while the texture of the surface horizons of the non-grazed areas is balanced. Grazing plays a role in the evolution of soil textures.
Moreover, the cation exchange capacity is greater in soils with a balanced texture such as ponds and ungrazed areas (lion ponds) with average values exceeding 9 meq/100 g.
The soils in our study area have low exchangeable base contents (less than 5.39 meq/100 g). The proportions of exchangeable bases are very low in the plateau and slopes (versus), except for calcium and sodium, the highest average levels of which are observed on the slopes of the ungrazed pond for calcium (5.39 meq/100 g) and on the plateau of the grazed pond for sodium (0.09 meq/100 g). These results do not corroborate with those of Ndiaye, 2013 [23] who found low calcium content in the plateau. Indeed, variations in the concentration of exchangeable calcium are linked to pH since they occupy two thirds of the exchangeable cations when the pH is higher than 7 [24], which is in line with our results. On the other hand, the highest average levels were found in ponds and especially in non-grazed areas. These areas have a high clay content which endows the soils with a high cation-fixing capacity by forming the adsorbent complex of the soil with the organic matter that captures positively charged nutrients [25] and gives the soil chemical fertility [26].
In addition, the highest organic matter content was noted in pond soils with an average of 0.72% followed by the slopes with 0.52% despite its low content in our study area.
The highest average carbon and organic matter contents were found in the lion pond (0.48% and
0.83%) and the lowest in the Belel Sow pond plateau (0.2% and 0.35%). These levels
decrease with depth, regardless of the
geomorphological unit and the pond. This could be explained by the presence of plant cover [27] and the favorable microclimatic conditions for the accumulation of organic matter around the ponds.
As for the C/N ratios, almost all the topographical units studied in the grazed area have a strong average degree of mineralization, whereas that of the lion pond is normal. The latter, being fenced off, favors biological activity which leads to the mineralization of organic matter.
Like the organic matter content, the nitrogen content is very low. They are proportional. Thus the surface layers of ponds and slopes have the highest rates. These are the wooded areas, so the organic matter input supplies the soil with nitrogen after its mineralization [28].
Assimilable phosphorus levels are very low in soil samples from the plateau. In slopes and ponds, they are low to medium. Ferlo soils are generally tropical ferruginous soils with low assimilable phosphorus content [29,30]. These contents are very high in the superficial horizons decrease with depth and are higher in the ungrazed pond. Phosphorus is an element that is not very mobile and migrates at depth in very small quantities [31], which is the reason for the low grades noted at depth.
The multivariate analysis shows three classes whose horizons are more or less similar with respect to certain physicochemical parameters. The first class is composed of soils from the different horizons of the plateaus and the slopes of the grazed ponds. These soils have a sandy texture and are poor in certain physicochemical elements such as electrical conductivity, clay, assimilable phosphorus, nitrogen, organic matter, carbon, cation exchange capacity (CEC) and calcium. These are the poorest areas (plateau). Class two is characterized by physicochemical parameters such as calcium, clay, cation exchange capacity and an average proportion of sand. This class contains five (05) horizons of the surroundings of the lion pond and horizon 2 of the hole pond, areas, where there is strong mineralization. Class three consists of three (03) horizons from the lion pond and two (02) horizons from the pond to hole. It includes the superficial horizons of ponds and slopes. These are horizons rich in organic matter, carbon,
Faye et al.; IJPSS, 32(7): 26-40, 2020; Article no.IJPSS.57878
nitrogen, assimilable phosphorus, silt and potassium. The pH is slightly acid and the electric conductivity is around 84.6 μS/cm. These are the fertile areas where there is a strong presence of trees and a low exposure to the sun.
4. CONCLUSION
This study reveals a differentiation in the
evolution of physico-chemical parameters
according to the topographic unit and
environmental conditions. Indeed, the analyses show that the soil texture of the plateau and pastured areas is sandy, while the texture of ponds, slopes and non-pastured areas is balanced.
Similarly, the chemical element contents are much higher in low areas (ponds and slopes) and non-grazed areas.
Three classes are obtained with the multivariate treatment. A coarser-textured soil class with very low chemical fertility found on the plateaus, a soil class with a balanced texture that is rich in cation exchange capacity and calcium found in low areas with high mineralization, and a last class rich in chemical elements with a silty texture found in wooded areas.
These physical and chemical properties may be responsible for the diversity and distribution of herbaceous and woody vegetation around temporary pools.
ACKNOWLEDGEMENTS
We would like to thank the UMI 3189 "Environment, Health, Societies" (UCAD, CNRS, CNRST, USTTB, UGB), and the Labex DRIIHM, programme "Investments for the future" ANR-11-LABX-0010, for funding our work.
COMPETING INTERESTS
Authors have declared that no competing interests exist.
REFERENCES
1. Sy O. Role of the pond in the
management of Sahelian pastoral
systems in Ferlo (Senegal). European Journal of Geography. 2009;440:1-11. Available:https://doi.org/10.4000/cyberge o.22057
2. Ndiaye I, Camara B, Ngom D. Specific
diversity and ethno-botanical uses of
woody plants following a North-South rainfall gradient in the Senegalese
groundnut basin. J. Appl. Biosci.
2017;113:11123–11137.
3. Akpo LE. Dynamics of Sahelian
ecological systems: Specific structure productivity and quality of grasslands: Widdu Thiengoly drilling (IRD Center in Bondy) [ORSTOM]. 1990;65.
4. Diop AT. Ecological dynamics and
evolution of practices in the Sylvo-pastoral zone of Senegal: Perspectives for a sustainable development [Doct. Sc. Nat]. FST / UCAD. 2007;296.
5. Ngom D. Biodiversity and ecosystem
services in biosphere reserves: Ferlo Biosphere Reverse in West Africa. Academic Press. 2014;184.
6. Allem M, Hamel T, Tahraoui C,
Boulemtafes A, ouslama Z. Floristic diversity of temporary ponds in the region of Annaba (North-East Algeria). International Journal of Environmental Studies. 2018;75(3):405–424.
7. Jourdas A. Understanding the
pond through its biodiversity.
[Valmares: A Project around ponds]. 2013;20.
8. Diop AT. Inventory and monitoring of the
water resources of Ferlo Nord.
[Confirmatory memorandum]. 1984;46.
9. Diallo M. Study of Senegalese
rangelands by the combined approach of the conventional method and geomatics. [Philosophy doctor (PH.D) in Water
Sciences]. University du Québec.
1996;141.
10. Diop AT, Diaw OT, Thiam M, Dieme I,
Toure I, Dieme G, Traore M. The ponds of the Sylvo-pastoral Zone of Senegal: Role in the conservation of biodiversity and the living environment of pastoral populations. 2004;8.
11. Lacaux JP, Tourre YM, Vignolles C,
Ndione JA, Lafaye M. Classification of
ponds from high-spatial resolution
remote sensing: Application to Rift Valley Fever epidemics in Senegal. Remote
Sensing of Environment.
2007;106(1):66–74.
12. Ndione JA, Lacaux JP, Tourre Y,
Vignolles C, Fontanaz D, Lafaye M. Temporary pools and health risks at Ferlo: Contribution of remote sensing to the study of Rift Valley Fever between
August 2003 and January 2004.
Faye et al.; IJPSS, 32(7): 26-40, 2020; Article no.IJPSS.57878
13. Niang K, Ndiaye O, Diallo A, Guisse. A Flora and structure of woody vegetation along the Great Green Wall in Ferlo North Senegal. Journal of Applied Biosciences. 2014;79(1):6938-6946.
14. Ndiaye O, Diop A, Akpo LE, Diene M.
Dynamics of carbon and nitrogen content of soils in Ferlo farming systems: Case of Dahra CRZ. Journal of Applied Biosciences, 2014;83:7554–7569.
15. Ndiaye O, Aly D, Bassimbe SM, Aliou G.
Floristic diversity of woody stands in Ferlo, Senegal. Vertigo. 2013;13(3):1-12.
16. Niang K. The tree in the community
paths of Ferlo-Nord (Senegal). Mémoire d’étude Approfondie (DEA) in Plant Biology. Plant ecology and ecohydrology laboratory. 2009;68.
17. Bakhoum A. Dynamics of fodder
resources: Indicator of resilience of community téssèkéré routes in Ferlo, (North Senegal) [Biology, Productions and Animal Pathologies]. Cheikh Anta Diop University of Dakar. 2013;118.
18. Diallo A, Faye M, Ndiaye O, Guisse A.
Variations in the composition of the
herbaceous vegetation of Acacia
senegal (L.) Willd plantations in the
Dahra (Ferlo) area. International Journal of Biological and Chemical Sciences, 2011;5(3):1250–1264.
19. Ka A. Eat at Widou Thiengoly (North
Senegal): From abundance remembered to dependence on the market [doctoral thesis: Specialty: Anthropology of food]. Cheikh Anta Diop University of Dakar. 2016;330.
20. Bocoum M. Methods of soil analysis.
Work document. INP. The Minister of Agriculture; 2004.
21. Xie Y, Allaire J, Grolemund G, R
Markdown: The Definitive Guide.
Chapman and. 411 Hall / CRC. Boca Raton. Florida.
22. Diallo MD, Ngamb T, Tine AK, Guisse M,
Ndiaye O, Saleh MM, Diallo A, Seck S, Diop A, Guisse A. Agro-pedological characterization of MBOLTIME soils in the NIAYES area (Senegal). African Agronomy. 2015;27(1):57-67.
23. Ndiaye O. Soil characteristics of the flora
and vegetation of Ferlo. Senegal
[Biology. Plant Physiology & Pathology]. Cheikh Anta Diop University of Dakar. 2013;130.
24. Pernes-debuyser A, Tessier D. Influence
of pH on soil properties: The long-term test of 42 plots at Versailles. Water science journal. 2002;15:27-39.
Available:https://doi.org/10.7202/705484 ar
25. Mareaux M. Understanding a soil
analysis. Chamber of Agriculture of the Atlantic Pyrenees. 2010;4.
26. Calvet G, Villemin P. Interpretation of soil
analyzes. Ed. SCPA; 1986.
27. Arrouays D, Antoni V, Bardy M, Bispo A,
Brossard M, Jolivet C, Le Bas C, Martin M, Saby N, Schnebelen N, Villanneau E, Stengel P. Soil fertility: conclusions of the report on the state of France's soils. Innovations Agronomiques. 2012;21:1-11.
28. Heller R, Esnault, R, Lance C. Plant
Physiology: Vol. Tome I Nutrition (6th Edition of the Abstract). 1998;323.
29. Duchaufour P. Pedology: soil vegetation
environment. (VII. Including 2 p. Of pl. In color) (4th ed. Rev.). Paris; Milan; Barcelona: Masson. 1997;1:324.
30. Laurent JY, Brossard M. Comparative
study of the determination of total phosphorus in tropical soils. Cah. ORSTOM. Sir. Pedol. 1991;26(3):281-285.
31. Huguet JG. Practice of mineral
fertilization of fruit trees (Editions INVUFLEC); 1978.
_________________________________________________________________________________ © 2020 Faye et al.; This is an Open Access article distributed under the terms of the Creative Commons Attribution License
(http://creativecommons.org/licenses/by/4.0), which permits unrestricted use, distribution, and reproduction in any medium,
provided the original work is properly cited.
Peer-review history:
The peer review history for this paper can be accessed here: http://www.sdiarticle4.com/review-history/57878