OATAO is an open access repository that collects the work of Toulouse
researchers and makes it freely available over the web where possible
Any correspondence concerning this service should be sent
to the repository administrator: [email protected]
This is an author’s version published in: http://oatao.univ-toulouse.fr/26656
To cite this version:
Amirdehi, Saba
and Trajin, Baptiste
and Vidal, Paul-Etienne
and Vally, Johana and Colin, Didier and Tastet, Sylvain
Identification of PEM Fuel cell system model for traction chain
based on profile mission measurement. (2020) In: International
symposium on industrial electronics (ISIE 2020), 17 June 2020 - 19
June 2020 (Delft, Netherlands).
Official URL:
Identification of PEM Fuel cell system model for
traction chain based on profile mission
measurement
Saba AMIRDEHI
Alstom transport
Laboratoire Génie de Production, LGP, Université de Toulouse, INP-ENIT
Séméac, France [email protected] Johana VALLY Alstom transport Séméac, France [email protected] Baptiste TRAJIN
Laboratoire Génie de Production, LGP, Université de Toulouse, INP-ENIT
Tarbes, France [email protected] Didier COLIN Alstom transport Séméac, France [email protected] Paul-Etienne VIDAL
Laboratoire Génie de Production, LGP, Université de Toulouse, INP-ENIT
Tarbes, France [email protected] Sylvain TASTET Alstom transport Séméac, France [email protected]
Abstract—Testing of proton exchange membrane fuel cell system is one of the most important issues due to the cost and security reasons in railway applications. To reduce the cost, it would be necessary to have a representative simulation model for this case. Having an accurate model of proton exchange membrane fuel cell system requires considering several auxiliary circuits. However, in industrial application, the accurate model of proton exchange membrane fuel cell system and corresponding information are not often provided by the designer. Moreover, the simplicity and representativity of model is required to be compatible with overall traction chain model. The model has to be suitable for system simulation and not design purpose. In this paper, a simplified model of PEMFC system is proposed using the experimental profile mission. The impact of all the environment system of proton exchange membrane fuel cell stack is estimated using the average of polarization curve on several operational points. The parameter identification process is applied, and the obtained parameters are then inserted on the overall system of fuel cell stack. The experimental data obtained through train is compared with the consecutive simulation results.
Keywords—PEMFC system model, polarization curve, train traction chain, parameter identification
I. INTRODUCTION
Fuel cells (FCs) are one of the most promising renewable energy sources. They are environmentally clean, and they have low emission of oxides of nitrogen and sulfur. There are wide range of FC technologies classified into different categories based on fuel used, operating temperature and type of electrolyte. Among different types of FCs, Proton Exchange Membrane Fuel Cell (PEMFC) has lower temperature (under 100°C), fast connection time and easiest manufacturing process compare to the other types of FC. It has fast dynamic response in the condition of load variation, and it is compact, lightweight and noiseless [1].
The open circuit voltage of PEMFC is obtained by the differential potential between oxidant (Oxygen coming from air) and fuel (Hydrogen) in cathode and anode, respectively [2]. The maximum differential potential provided by PEMFC is about 1.23 V. In railway applications, to have sufficient amount of power (around 250 KW) to supply the whole traction chain, PEM fuel cell system is used. It consists of several PEMFC stacks in different configuration in series, parallel or combination of series and parallel. To manage an
adequate gas, it is required to have several auxiliaries such as hydrogen, cooling, air and humidification circuit.
The testing activities are the most important issue due to security and cost reasons in railway traction chain design. Therefore, having a representative simulation model of chain components is required. The simulated model of components such as PEMFC system has to be compatible with overall traction chain model. Thus, the simplicity and representativity of PEMFC system model are in priority. The model has to be suitable for system simulation and not design simulation. The PEMFC system model has to consist of the PEMFC stack model and the auxiliary circuits.
Several approaches are done to propose the static and dynamic model of PEMFC stacks [3]- [7] and [8] which provide the polarization curve (voltage as a function of current). In last few years, the numerical modeling, computer simulation and PEMFC stacks performance have been proposed [2], [9]- [11]. State-space modelling of PEMFC is provided in [12]. These approaches allow us to establish equivalent electrical model of PEMFC. There are several approaches to propose the PEMFC stacks model using graphic way of power transfer in the system. In [13]- [15], PEMFC stack model is proposed based on bond graph methodology [16] which illustrates the energy exchange within overall system. Generally, the methodology of bond graph is applied to model the PEMFC stack in the following sections.
As mentioned in previous approaches, the polarization curve depends on numerous factors such as membrane thickness and state of hydration, catalyst loading, catalyst layer structure flow filed design and operating conditions (temperature, pressure, humidity, flowrates and etc.) [17]. Experimentally, the polarization curve is also impacted by the transient load use, which causes a hysteresis effect on the dynamic characteristics of PEMFC stack [18]. Based on several studies, the hysteresis effect occurs due to several reason such as double layer charging effect [19] and its interaction with activation losses [20] and water management in the cells [21]. Therefore, it would be necessary to take into account the PEMFC stack dynamic model, auxiliary circuits model, its control command system to realize the polarization curve of overall system in various operating modes. The detailed model of PEMFC system are presented in [22] and [23].
However, in railway application, a simplified model from user point of view is required to test the overall performance of system in different operating modes. Moreover, the detailed information and data about the PEMFC system are not often provided by the manufactures. Therefore, it is required to propose a model based on the overall profile mission of PEMFC system.
In this paper, a simplified model of PEMFC system is proposed using the experimental profile mission on train. The PEMFC stack model is obtained using bond graph methodology. To adapt the PEMFC stacks model parameters, the output polarization curves on experimental measurements affected by several auxiliary circuits is estimated by a specific average curve.
This paper is organized as following. In section II, the general structure of PEMFC stack and PEMFC system are explained. The electrical model considering voltage drops of each cell under load condition is illustrated. The corresponding equations are provided. In section III, the parameter identification process is illustrated. The average polarization curve is obtained using the part of measured profile mission. The parameters of electrical circuit are then adapted using the average characteristics of PEMFC system. The railway experimental results in the other part of mission profile are compared with simulation results in section IV.
II. PEM FUEL CELL SYSTEM
A. PEMFC System Structure
A PEMFC system is constituted by several PEMFC stacks in series/parallel combination to achieve higher output voltage and power. Fig. 1 shows the example of basic PEMFC stack and PEMFC system configuration.
(a)
(b)
Fig. 1 (a) PEMFC stack (b) PEMFC system
As it is illustrated in Fig.1 (a), the PEMFC stacks consists of a multitude of single cells stacked up. Each single cell is constituted by a membrane, electrodes which are the catalyst layer, a gas diffusion layer and a bipolar plate to separate the cells connected in series. The electrochemical reactions occur
on anode (hydrogen) and cathode (oxygen). Therefore, in the PEMFC stack structure, the cathode of a single cell is electrically connected to the anode of the adjacent cell. In this paper, it is assumed that the parameters of individual cells can be lumped together to represent PEMFC stacks. Thus, it is assumed that the same current flows through each cell on the stack. Considering the overall current of PEMFC system as
!"#$%&', the current for each single cell is as below:
!()**%&' +, !"#$%&' -$.(/01.2.**)*
(1)
where,-$.(/01.2.**)*is number of series stacks in parallel. Supposing the output voltage response of each single cell as 3()**%&' , the output voltage of PEMFC system can be
calculated as (2).
3"#$%&' + 4,()**,-$.(/0-)25)-3()**%&'6 7 38%&' 7 39:%&'
(2) where ,()** and ,-$.(/0-)25)- are numbers of single cell in PEMFC stacks, number of stacks in series, respectively. 38%&' and 39:%&' represent the voltage losses due to cables’
impedance which can have an impact on dynamic response. PEMFC stacks are obviously the heart of PEMFC system. However, it is required the supporting equipment to be useful and perform efficiently. Typically, the PEMFC systems involves several subsystems such as oxidant supply, fuel supply, heat management, water management, power conditioning and instrumentation and controls. Fig. 2 depicts a PEMFC stack with the involved auxiliary circuits.
Fig. 2 PEMFC stack and the involved auxiliary circuits
There is also a control system which sends or receives the commands depending on the operating modes. The control system structure is different depending on the designers. The static and dynamic behavior of the system output are impacted by the subsystems and PEMFC stacks. However, as it is required to have a simple and representative model of PEMFC system, it is focused on the user point of view model. To do so, the impact of auxiliary circuits on polarization curve is considered in the proposed methodology in this paper considering the average polarization curve on train measurements. In the following sections, the PEMFC stack model is presented and the proposed methodology to predict the behavior of PEMFC system is discussed.
B. PEM Fuel cell stack model
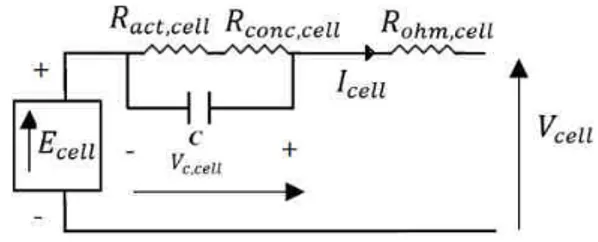
The electrical model of a single cell of PEMFC stack is proposed in different literatures [4]- [8]. Fig. 3 depicts the PEMFC dynamic model considered.
Fig. 3 Dynamic model of a single cell of PEMFC
In Fig.3, ;()** is the internal voltage of PEMFC provided by chemical and mass reactions in open circuit condition. Once the electrical load is connected to the fuel cell, the internal potential will decrease due to the voltage drops caused by the kinetic electrochemical reactions, convection and diffusion process, resistance of electrons flow, and transferred ions through solid polymer membrane and electrode materials. These voltage drops are namely, activation, concentration and ohmic losses, respectively [4]. There is also the double layer charging effect which is presented as a capacitor denoted C [2]. The voltage equations of internal potential and voltage losses in the presence of load are presented as (3)-(8).
;()**%&' + ;<0()**"= >?%@ABC D %@EBC '<DF' 7 ;G0()** (3)
where;<0()**" ,H@ABC ,H@EBC and ;G0()** represent standard reference potential at standard state (298K and 1-atm pressure) which is 1.23 V, partial pressures (hydrogen and oxygen) and the fuel and oxidant delay of PEMFC, respectively. The fuel and oxidant delay are obtained as below [4]:
;G0()**%&' + I)J!()**%&' 7 !()**%&' C KL@ J7M&
)NN
(4)
where I) and M) are constant value (O) and overall flow delay in seconds, respectively. Note that (C ) is the convolution product. ;G0()**%&' is zero in steady state. The ohmic voltage loss and state equation which represents the double layer charging effect are provided in (5) and (6) respectively.
3"PQ0()**%&' + !()**%&'R%S'> (5)
3T(0()**%&' +UV !()**%&' 7WX U
.($0()**= X("Y(0()**ZV3(0()**%&'
(6) where R is cell active area in cm2 and > is the thickness of membrane in cm (electrolyte of cell). S is the membrane conductivity in mS/cm.
In (6), V represent double layer charging effect. HX.($0()** and
X("Y(0()** are activation and concentration losses of each
single cell of PEMFC, respectively. They can be expressed as (7) and (8). X.($0()**%&' +! X[ ()**%&'\?] >? J !()**%&' = !Y !< N (7)
where ? + ^0 \0 !< and !Y are the number of transferred electrons in chemical reactions in PEMFC, the charge transfer coefficient, corresponding current of activation and the internal leakage current, respectively. \, !< and !Y are the parameters which should be found from datasheet and experimentally. X("Y(0()**%&' + 7! X[ ()**%&'_?] >? JU 7 !()**%&' !*5Q5$ N (8)
where !*5Q5$ and _ are the limit diffusion current and a transfer coefficient of concentration loss, respectively. Note that (7) and (8) are valid while !()**%&' ` a.
Therefore, the dynamic output voltage of PEMFC (9) can be obtained using equations of (3)- (8).
3()**%&' + ;()**%&' 7 3(0()**%&' 7 3"PQ0()**%&' (9)
The output voltage of PEMFC single cell in steady state condition (without load transition) turns to (10).
3()**%&' + ;()**%&' 7 3.($0()**%&' 7 3("Y(0()**%&' 7 3"PQ0()**%&'
(10) where 3.($0()**%&' and 3("Y(0()**%&' are the linked
toX.($0()**%&' and X("Y(0()**%&' respectively. The static
polarization curve of PEMFC stack is as Fig. 4.
Fig. 4 Characteristics of PEMFC single cell in steady state
Since the fuel cell stack developed for railway application are commercial products, authors have no access of detailed information about stack characteristics; and have taken some hypothesis for R and > constant based on the state of the art in the following sections. For the same reason, the control command of the auxiliary system is considered as a black box. Therefore, the dynamic behavior of PEMFC system is estimated using the profile mission measured on train. The estimated polarization curve is presented during the identification process in the following.
III. PARAMETER IDENTIFICATION
A. Experimental Profile Mission analysis
The parameter identification of a system is done by comparing the simulation results and system experimental
measurement and tuning the model parameters. The optimal set of parameters is determined by minimizing the difference between the system response and simulation results.
To have the experimental results, the measurements are done on train (hybrid railway). Fig. 5 demonstrates the block diagram of the hybrid train including PEMFC system, battery, converter, motor, etc. It is also shown where the voltage and current measurements are done.
Fig. 5 Block diagram of train including fuel cell under measurement
The PEMFC system detailed block diagram is presented in Fig.1 and 2.
Fig.6 depicts the measured current (a) and voltage of PEMFC system (b) on the part of profile mission on train united by the maximum value of voltage and current (bbcde
fgh,
icde
ifgh) of PEMFC
system provided in datasheet. Note that the sampling time of measurement is 0.5 second.
(a)
(b)
Fig. 6 (a) measured current and (b) voltage of PEMFC system (j1h in the beginning of test procedure)
Generally, the static polarization curve presented in the datasheet of PEMFC stacks are used to identify the parameters. Then, the dynamic response of PEMFC system which experimentally shows the nonlinear behavior, is obtained by a precise model of the overall PEMFC system. However, as it is aimed to have simplified model in user point of view, following approaches are proposed.
As depicted in Fig. 6, various voltage-current curves are observed based on the power demand to ensure the railway profile mission. All experimental polarization curves in profile mission are shown in Fig. 7 within 3h of measurement. Let us remind that the voltage and current shown in the following sections and figures are united by the maximum
value of PEMFC voltage and current provided in the datasheet.
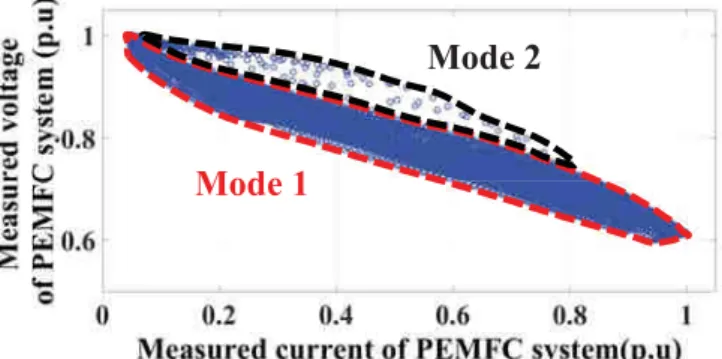
Fig. 7 Measured voltage response versus the current extracted from profile mission for 3h of test procedure
The complete polarization curve can be obtained while progressive power range is demanded. Within 3h of measurement, 21 curves with the time constant of more than 5 seconds are registered. As illustrated in Fig. 7, it is distinguished two modes, denoted Mode1 and Mode 2. The Mode 1 defines the typical polarization curve impacted by the dynamic feature of system for different operating points considering the variation of temperature, level of the hydration etc. The voltage variation for the same demanded power is around 7%. This is due to the factors mentioned in section I which impact the polarization curve of PEMFC system. However, to identify the parameters, it is required to have unique polarization curve which represents a typical behavior of the PEMFC system during profile mission. This typical polarization curve allows us to identify the static parameters of system. Therefore, an average of polarization curve is obtained in next section.
The Mode 2 is due to the dynamic response of PEMFC system in fast power variation (<5 seconds response) which is out of the usual polarization curve. This mode occurs at maximum power while dramatically power reduction is demanded. At maximum power demand the hydration level of membrane is high and does not respond instantaneously. This mode allows us to identify the dynamic parameters of system.
B. Paramater identification of static model
Mainly, to identify the parameters, a part of measured voltage and current (last 2h of test procedure) is considered. Then, the identified parameters are inserted in the model and the simulation results are compared with the other part of measurement (1h in the beginning of test procedure) which is not the same as the part used in identification process to confirm the model.
The differential evolution (DE) method [24] is used here to identify the parameters. In this case the cost function for DE method is achieved by minimizing the difference between desired and calculated output voltage of PEMFC system. The cost function is as:
Mode 1
k + lW%3"#$'m0n7 %3"#$'m0oZ (11)
where Hk represents the sum of error, %3pq&'m0o is the calculated output voltage of PEMFC system in steady state operation (10). %3pq&'m0n is the measured output voltage of PEMFC system in the last 2h of test procedure. To have a unique voltage response, the characteristics of PEMFC system in Mode 1 within the last 2h of measurements can be considered as an average polarization curve. The average of polarization curve is obtained using a window of 6% maximum measured current as Fig. 8. For each window, the average value voltage and current values are represented by
(3"#$05, !"#$05) operating points which are plotted by the red
curve in Fig. 8.
Fig. 8 Average voltage-current points for profile mission in last 2h of measurements
The average curve represents the simplified polarization curve of PEMFC system used to identify the parameters of the PEMFC stack steady state model.
The objective is to reproduce the response voltage of PEMFC system which is measured on 1h in the beginning of the test procedure shown in Fig.6 (b). The optimization is started with 100 for number of population and 100 for number of evaluations. As a matter of facts, 10000 numbers of iterations are applied.
The required parameters for steady state model of PEMFC stack are H!Y0 !<and !*5Q5$.H\0 _ and S are patent technological parameters given in PEMFC stack datasheet.
C. Paramater identification of dynamic model
Once the desired parameters are obtained, the identification process has to be redone for the dynamic model. In this case one cycle of response voltage in Mode 2 is selected; the second identification process provides the values of I), M) and V. The cable impedance value is considered based on the its nominal value per meter.
IV. SIMULATION RESULTS AND COMPARISON WITH EXPERIMENTAL RESULTS
The PEMFC system model is simulated using (1)- (10). All the identified parameters in section III are inserted in the model. The measured power demand of PEMFC system in the first 1h of measurement is applied to the simulated model; then the results are compared with the measured output voltage as illustrated in Fig. 9.
Fig. 9 Comparison of measured output voltage of PEMFC system and the simulated one using identified parameters in section III
The average error of model during the profile mission in the first 1h of measurement is 1.85%. In mode 1 which consists the 90% of profile mission, the average value of error is about 1.7% and in mode 2 which consists the 10% of profile mission is about 5%. On the proposed model, the average of profile mission is considered to identify the parameters, therefore it is normal to have error on some specific and unusual point of profile mission (mode 2).
The polarization curve obtained in simulation is compared with result on train in the first 1h of testing in Fig.10. It is shown that simplified model of PEMFC system can represent two modes of experimental polarization curve.
Fig. 10 Comparison of measured voltage and current of PEMFC system on train in 1h in the beginning of test and the simulated one.
It is concluded that identifying the model parameter of PEMFC stack using profile mission allows to have a simple and representative model of PEMFC system with enough accuracy.
V. CONCLUSION
In this paper, PEMFC system is modeled using average experimental profile mission on train. This leads to have a simplified model of overall system in order to be easily simulate in railway application. The parameters of model are identified using the experimental average polarization curve. The two major characteristics of system in various operating modes are simulated using the dynamic model. Comparison between experimental measurements and simulation results depicts that the presented model sufficiently accurate to predict the behavior of PEMFC system.
In future work, the identification of PEMFC system model will be done considering the impact of control command circuits of PEMFC system.
ACKNOWLEDGMENT
This research was supported partially by national association research technology (ANRT) and received
funding from the Shift2Rail Joint Undertaking (JU) under grant agreement No 826054. The JU receives support from the European Union’s Horizon 2020 research and innovation program and the Shift2Rail JU members other than the Union.
VI. REFERENCES
[1] Blunier, A. Miraoui, Pile Combustible (French), Paris: Ellipses, 2007.
[2] Dicks, Andrew & Rand, David., Fuel Cell Systems Explained, 2018.
[3] Lee, Dong-Jing; Wang, Li, "Dynamic and Steady-State Performance of PEM Fuel Cells under Various Loading Conditions," in IEEE Power Engineering Society General Meeting, Tampa, FL, USA, 2007.
[4] Caisheng Wang ; M.H. Nehrir ; S.R. Shaw, "Dynamic models and model validation for PEM fuel cells using electrical circuits," IEEE Transactions on Energy Conversion, vol. 20, no. 2, pp. 442 - 451, 2005.
[5] Mohamed Becherif, Aïcha Saadi, Daniel Hissel, Abdennacer Aboubou, Mohamed Yacine Ayad, "Static and dynamic proton exchange membrane fuel cell models," Journal of Hydrocarbons Mines and Environmental Research, vol. 2, no. 1, 2011.
[6] Ishwar PrasadSahu, Gali Krishna, Manojit Biswas, Mihir Kumar Das, "Performance Study of PEM Fuel Cell under Different Loading Conditions," in 4th
International Conference on Advances in Energy Research (ICAER 2013), India, 2014.
[7] Ambrosio B. Cultura, Ziyad M. Salameh, "Dynamic Analysis of a Stand Alone Operation of PEM Fuel Cell System," Journal of Power and Energy Engineering,,
vol. 2, pp. 1-8, 2014.
[8] M. Becherif, D. Hissel, S. Gaagat, M. Wack, «Electrical equivalent model of a proton exchange membrane fuel cell with,» Elsevier Renewable Energy,
vol. 36, pp. 2582-2588, 2011.
[9] Maher A.R. Sadiq Al-Baghdadil,, "Modelling of proton exchange membrane fuel cell performance based on semi-empirical equations," Renewable energy, vol. 30, pp. 1587-1599, 2005.
[10] Fmoun, P., Member, S., Gemmen, R. S., "Electrochemical Circuit Model of a PEM Fuel Cell," in IEEE Power Engineering Society General Meeting, Toronto, Canada, 2003.
[11] Khan, M., J., Iqbal, M. T., "Dynamic Modelling and Simulation of a Fuel Cell Generator," Fuel cell, vol. 5, no. 1, 2005.
[12] Sachin V. Puranik, Ali Keyhani, Farshad Khorrami, "State-Space Modeling of Proton Exchange," IEEE Transactions On Energy Conversion, vol. 25, no. 3, pp.
804-813, 2010.
[13] M. Bressel, M. Hilairet, D. Hissel, B. Ould-Bouamama, "Dynamical modeling of Proton Exchange Membrane Fuel Cell and parameters," Toulouse, France, 2014.
[14] César Peraza, Jose Gregorio Diaz,J. Arteaga-Bravo,Carlos Villanueva,Francisco Gonzalez-Longatt, "Modeling and Simulation of PEM Fuel Cell with Bond Graph and 20sim," in American Control Conference, Washington, USA, 2008.
[15] Mathieu Bressel, Mayank Shekhar Jha, Belkacem Ould Bouamama, Mickael Hilairet, Hissel Daniel, "Bond Graph for modeling and diagnostics of Proton Exchange Membrane Fuel Cell," in ICBGM, montréal, Canada, 2016.
[16] G. Gandanegara, X. Roboam, B. Sareni, G. Dauphin-Tanguy, "Modeling and Multi-time Scale Analysis of Railway Traction Systems Using Bond Graphs," in
Proceedings of International Conference on Bond Graph Modeling and Simulation, 2001.
[17] Bouziane Mahmah, Ghania Morsli, Mounia Belacel, Hocine Benmoussa, Soulef Achachera, Amina Benhamou, Ma>ouf Belhamel, "Dynamic Performance of Fuel Cell Power Module for Mobility Applications,"
Engineering, vol. 5, no. 2, pp. 219-229, 2013.
[18] R. Talj, T. Azib, O. Béthoux, G. Remy, C. Marchand, et al., "Parameter analysis of PEM fuel cell hysteresis effects for transient load use," European Physical Journal: Applied Physics, EDP Sciences, vol. 54, no. 2,
2011.
[19] G. Fontes, C. Turpin, S. Astier, T.A. Meynard,, "Interactions Between Fuel Cells and Power Converters: Influence of Current Harmonics on a Fuel Cell Stack," IEEE Trans. on Power Electronics, vol. 22, no. 2, pp. 670-678, 2007.
[20] D. Gerteisen, T. Heilmann and Ch. Ziegler, "Modeling the phenomena of dehydration and flooding of a polymer electrolyte membrane fuel cell," Journal of Power Sources, vol. 187, no. 1, pp. 165-181, 2009.
[21] J.-M. Le Canut, R. Latham, W. Mérida and D.A. Harrington, "Impedance study of membrane dehydration and compression in proton exchange membrane fuel cells," Journal of Power Sources, vol. 192, no. 2, pp. 457-466, 2009.
[22] C.H. Li, X.P. Ji, Q.J. Zeng, Y.L. Wang and X.D. Wu, "Modeling and performance analysis of PEM fuel cell system," Springer Science Business Media New york,
pp. 943-951, 2014.
[23] Eng. Waseem Saeeda, Dr. Eng. Ghaith Warkozekb, "Modeling and Analysis of Renewable PEM Fuel Cell System," in International Conference on Technologies
and Materials for Renewable Energy, Environment and, 2015.
[24] Aluffi-Pentini, F., Parisi, V. and Zirilli, F., "Global Optimization and Stochastic Differential Equation,"
Journal of Optimization Theory and Applications, vol.