HAL Id: hal-02652266
https://hal.inrae.fr/hal-02652266
Submitted on 29 May 2020
HAL is a multi-disciplinary open access archive for the deposit and dissemination of sci-entific research documents, whether they are pub-lished or not. The documents may come from teaching and research institutions in France or abroad, or from public or private research centers.
L’archive ouverte pluridisciplinaire HAL, est destinée au dépôt et à la diffusion de documents scientifiques de niveau recherche, publiés ou non, émanant des établissements d’enseignement et de recherche français ou étrangers, des laboratoires publics ou privés.
Genetic parameters of product’s quality and hepatic
metabolism in fattened mule ducks
Christel Marie-Etancelin, Benjamin Basso, S. Davail, K. Gontier, Xavier
Fernandez, Zulma Vitezica, Denis Bastianelli, Elisabeth Baéza,
Marie-Dominique Bernadet, Gerard Guy, et al.
To cite this version:
Christel Marie-Etancelin, Benjamin Basso, S. Davail, K. Gontier, Xavier Fernandez, et al.. Genetic parameters of product’s quality and hepatic metabolism in fattened mule ducks. Journal of Animal Science, American Society of Animal Science, 2011, 89 (3), pp.669-679. �10.2527/jas.2010-3091�. �hal-02652266�
Bastianelli, E. Baéza, M.-D. Bernadet, G. Guy, J.-M. Brun and A. Legarra
C. Marie-Etancelin, B. Basso, S. Davail, K. Gontier, X. Fernandez, Z. G. Vitezica, D.
doi: 10.2527/jas.2010-3091 originally published online November 12, 2010
2011, 89:669-679.
J ANIM SCI
http://www.journalofanimalscience.org/content/89/3/669
the World Wide Web at:
The online version of this article, along with updated information and services, is located on
ABSTRACT: Genetic parameters of traits related to hepatic lipid metabolism, carcass composition, and product quality of overfed mule ducks were estimated on both parental lines of this hybrid: the common duck line for the maternal side and the Muscovy line for the paternal side. The originality of the statistical model was to include simultaneously the additive genetic ef-fect of the common ducks and that of the Muscovy ducks, revealing a greater genetic determinism in com-mon than in Muscovy. Plasma metabolic indicators (glucose, triglyceride, and cholesterol contents) were heritable, in particular at the end of the overfeeding period, and heritabilities increased with the overfeeding stage. Carcass composition traits were highly heritable in the common line, with values ranging from 0.15 for liver weight, 0.21 for carcass weight, and 0.25 for ab-dominal fat weight to 0.32 for breast muscle weight. Heritabilities of technological outputs were greater for
the fatty liver (0.19 and 0.08, respectively, on com-mon and Muscovy sides for liver melting rate) than for the pectoralis major muscle (between 0.02 and 0.05 on both parental sides for cooking losses). Fortunately, the processing industry is mainly facing problems in liver quality, such as too high of a melting rate, than in meat quality. The meat quality appraisal criteria (such as texture and cooking losses), usually dependent on pH and the rate of decline of pH, were also very lowly heritable. This study demonstrated that genetic deter-minism of meat quality and ability of overfeeding is not similar in the common population and in the Muscovy population; traits related to fattening, muscle devel-opment, and BW have heritability values from 2 to 4 times greater on the common line than on the Muscovy line, which is relevant for considering different selection strategies.
Key words: crossbred animal, duck, genetic parameter, hepatic metabolism, meat and fatty liver quality ©2011 American Society of Animal Science. All rights reserved. J. Anim. Sci. 2011. 89:669–679
doi:10.2527/jas.2010-3091 INTRODUCTION
In France, about 95% of the fatty liver production comes from the mule duck, an infertile hybrid duck
from a female common duck (Anas platyrhynchos) and a Muscovy drake (Cairina moschata). So, the genetic improvement of mule performances is done by selecting the parental populations for traits measured on their mule progenies. Therefore, it is necessary to know the genetic parameters (heritabilities and genetic correla-tions) in the pure breed parental strains for produc-tion traits measured in the mule crossbred populaproduc-tions (Marie-Etancelin et al., 2008).
Genetic evaluation by BLUP is based on modeling the genetic means and the covariances among
individu-Genetic parameters of product quality and hepatic metabolism
in fattened mule ducks
1C. Marie-Etancelin,*
2B. Basso,* S. Davail,† K. Gontier,† X. Fernandez,‡ Z. G. Vitezica,‡
D. Bastianelli,§ E. Baéza,# M.-D. Bernadet,
‖ G. Guy,‖ J.-M. Brun,* and A. Legarra*
*Institut National de la Recherche Agronomique, SAGA Station d’Amélioration Génétique des Animaux, UR631, 31 326 Castanet Tolosan, France; †Université de Pau et des Pays de l’Adour, IPREM-EMM Institut Pluridisciplinaire de Recherche sur l’Environnement et les Matériaux, Equipe Environnement et Microbiologie,UMR5254, 40 004 Mont de Marsan Cedex, France; ‡Université de Toulouse, Institut National Polytechnique de Toulouse, Ecole Nationale Vétérinaire de Toulouse, Ecole Nationale Supérieure Agronomique de Toulouse,
Institut National de la Recherche Agronomique, TANDEM Tissu Animaux, Nutrition, Digestion, Ecosystème et Métabolisme, UMR1289, 31 326 Castanet Tolosan, France; §Centre de Coopération Internationale
en Recherche Agronomique pour le Développement, UMR SELMET Systèmes d’élevage, UR18,
34 398 Montpellier Cedex 5, France; #Institut National de la Recherche Agronomique, URA Unité de Recherche Avicole, UR83, 37 380 Nouzilly, France; and ‖Institut National de la Recherche Agronomique,
UEPFG Unité Expérimentale des Palmipèdes à Foie Gras, UE89, 40 280 Benquet, France
1 This work was supported by the French National Research
Agen-cy GENANIMAL, by the Scientific Group of avian genome analysis AGENAVI, and the Midi-Pyrénées and Aquitaine regional councils.
2 Corresponding author: Christel.Marie-Etancelin@toulouse.inra.
fr
Received April 16, 2010. Accepted October 26, 2010.
als. This is complex in the case of crossbred animals, where founder populations have different variances. One theory to estimate the covariances between cross-bred animals was proposed by Lo et al. (1995), and then simplified for a 2-breed terminal cross (Lo et al., 1997) and used in swine data by Lutaaya et al. (2001). This model combines purebred and crossbred informa-tion, correctly accounting for additive and (if consid-ered) dominance effects. In this study, the model of Lo et al. (1997) was used without taking into account the dominance variation for the traits expressed only in the mule ducks.
Duck breeding today is directed mainly toward the fatty liver production, fat meat being a coproduct of fatty liver. As the quantity of product increased, the quality of products became a crucial point. However, meat and liver quality traits remain expensive and dif-ficult to measure on a large number of overfed animals, and there are very few genetic variability studies that have been published in this field. This paper presents relevant genetic parameters of numerous foie gras and magret quality traits and of kinetics of plasma param-eters during the overfeeding period, on common and Muscovy lines. The aim was to ascertain the percentage of the original traits determined by genes and also to ascertain the genetic links between these traits.
MATERIALS AND METHODS
All experimental procedures were performed in ac-cordance with the French National Guidelines for the care and use of animals for research purposes (Certifi-cate of Authorisation to Experiment on Living Animals No. 7740, Ministry of Agriculture and Fish Products). Animals
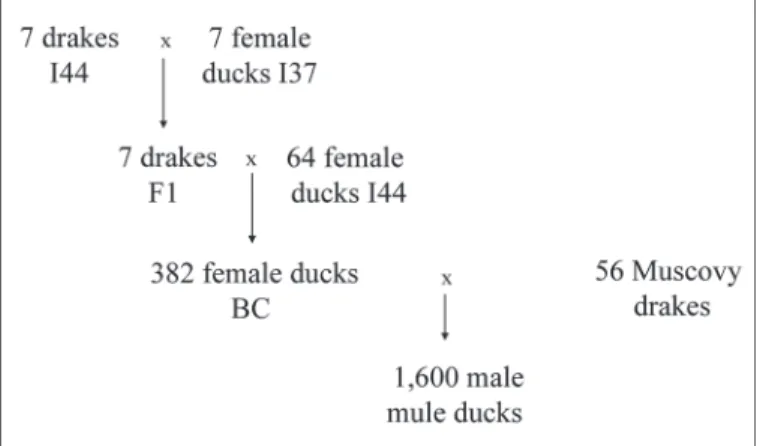
From 2005 to 2006, 800 male mule ducks were hatched each year in 2 pedigree batches of 400 ducklings. These mule ducks were hybrids between 2 experimental popu-lations: the dams were 382 back-cross common ducks (Anas platyrhynchos) and the sires were 56 Muscovy drakes (Cairina moschata). Pedigrees of these 1,600 male mule ducks are described in Figure 1. Four out of the 7 F1 families of mule ducks were produced in 2005 and the other 3 in 2006. For each year and hatch (a 3-wk gap between annual hatches), mule ducklings were bred in 8 batches of 50 animals. They were fed ad libitum from 0 to 6 wk of age with a starting diet (2,820 kcal of ME/kg and 17.5% CP) and then feed restricted from 6 to 10 wk of age (230 g/d with a grow-ing diet, 2,850 kcal of ME/kg and 15.5% CP). With the same growing diet, the pre-overfeeding period started at 10 wk of age with 5 d of restriction (200 g/d) and 6 d of gradual increase of feed amount (from 220 to 320 g/d). At 12 wk of age, ducks were overfed for 12 d in 2 successive series of 200 animals, with a gap of 2 d between series started at 80 and 82 d of age, with 2 dif-ferent crammers. Full-brother mule ducks were equally
distributed between the 2 annual hatching series, the 8 breeding batches and the 2 cramming series. During this period, animals were bred in collective cages of 4 or 5 individuals and were overfed twice each day with a mix of 35% corn-flour, 25% corn-grain, and 40% water; the average feed amount ingested by animal and meal varied from 410 to 825 g. At the end of the overfeeding period, animals were slaughtered at 92 and 94 d of age, respectively. The animals were bled after electronarco-sis and plucked. The carcasses were refrigerated 24 h at 4°C. Then, they were eviscerated: fatty liver, breast muscles, legs, and abdominal fat were removed.
Traits
Three groups of traits were recorded on all these 1,600 mule ducks, including plasma metabolites traits during overfeeding period with a kinetic approach, overfeeding ability traits by weighing carcass pieces, and quality traits of fatty liver and fattened breast muscle.
Plasma Metabolite Traits
Five milliliters of blood was collected by puncture in the duck occipital venous sinus. Blood was collected in a vacuum tube added with EDTA (0.8 g/L) and sodium azide (0.1 g/L). Plasma samples were immediately sep-arated by centrifugation at 3,000 × g for 10 min at 5°C, and frozen at −20°C until further biochemical analyses. Blood samples for measurement of plasma metabolite quantities were taken 3 h after the meal, 3 times during the overfeeding period, at the beginning (after the sec-ond meal), at the middle (after the 10th meal) and at the end (after the 20th meal) of the overfeeding period. Plasma triglycerides and total cholesterol were quan-tified by colorimetric enzymatic methods using kits provided by Bio-Mérieux (Marcy-l’Etoile, France) ac-cording to Fossati and Prencipe (1982) and Richmond (1973). Plasma glucose was quantified by the colori-metric enzymatic methods of Trinder (1969) using a kit provided by Sobioda (Montbonnot St Martin, France). These data were used as markers of liver metabolism for glucose and lipids and bird nutritional status.
Overfeeding Ability Traits
The overfeeding ability of the ducks was measured by weighing the animals at the beginning and at the end of the overfeeding period. The individual feed consump-tion was also estimated during the period, by recording for each of the 25 overfeeding meals if the crammer gave to ducks the whole dose, one-half the dose, or no dose. After slaughtering, the carcass, the fatty liver, the thighs + shanks, the abdominal fat, the pectoralis ma-jor (PM) muscle, and the skin with subcutaneous fat covering the PM muscle were weighed for each animal. The PM muscles and PM skin + subcutaneous fat as a whole constitute the magret, a typical duck meat cut. Quality Traits of Products
Quality traits of fatty liver and fattened breast mus-cle were measured. Color descriptives L* (lightness), a* (redness), and b* (yellowness) of the liver and the PM muscle were recorded with a Chroma Meter (CR 300 Minolta, Minolta Corporation USA, Ramsey, NJ). Lipid content and protein content (only for the liver) were estimated by near-infrared spectroscopy on a NIR-System 6500 spectrophotometer (FOSS NIRNIR-Systems, Silver Spring, MD) on samples of ground muscle and liver. The technological properties of fatty liver and magret were measured by a cooking test: the liver melt-ing rate (percentage of fat release after sterilization of 60 g of liver for 50 min at 105°C) and the muscle cook-ing losses (15 min at 85°C in a water bath). For muscle, temperature and pH at 20 min and 24 h postmortem were measured in the PM muscle. Drip losses of PM muscles wrapped under a plastic film were measured after 6 d storage at 6°C. Last, tenderness of raw meat was measured with the Warner-Bratzler test; from the force deformation curve, maximal shear force and en-ergy at the maximum were obtained. For liver, the total quantity of collagen content was determined according to Woessner (1961).
Statistical Analysis
Preliminary least squares analyses were performed using the GLM procedure (SAS Inst. Inc., Cary, NC) to determine the fixed effects which should be taken into account in the following analyses. The model for all traits included the fixed effect of year, batch, and cram-mer, and the additive breeding value for all animals as a random effect. Genetic parameters were estimated combining pedigree information from both parental populations (common and Muscovy) and from mule duck performances (Lo et al., 1997), with the following model: y X b Z Z u u e AC BC AC BC C C C C
( )
=( )( )
+(
)
æ è çç ççç ö ø ÷÷÷ ÷÷+( )
,where yC is a vector of observations for crossbreds (mule
ducks); bC is a vector of fixed effects corresponding to
the combination of year, batch, and crammer effects (12 levels); uAC (uBC) is the additive genetic effects of
the common dams (Muscovy sires) of mule ducks, as expressed in the phenotypes of the mule ducks (popu-lation C); eC is a vector of residual effects; X and Z
are incidence matrices relating records corresponding effects. We stress that eC contains the remaining
ge-netic effects of crossbred animals (i.e., the Mendelian sampling), as well as the “true” residual environmental effects. In short, the model substitutes the genetic ef-fect of the crossbred animals with the genetic efef-fect of their parents, plus a Mendelian sampling that is con-founded with the residual. Pedigrees were traced back up to 5 generations of ancestors on both parental lines and consisted on 596 animals in the common line and 201 animals in the Muscovy line. Only additive genetic effects were considered because to obtain accurate esti-mates for dominance variation large families, as well as purebreed phenotypes, are required. Also, because all animals with phenotype are mule ducks, average domi-nance effects are the same for all animals and need not be modeled explicitly. Multiple trait genetic pa-rameters estimations were performed by REML using the program remlf90 (Misztal, 1999). Standard errors of these estimations were computed by Gibbs sampling using the program gibbsf90 (Misztal, 1999). A total chain length of 100,000 iterations was run, and 20,000 samples were discarded as burn-in. In both cases, a full multiple-trait analysis was run.
RESULTS Zootechnic Results
Tables 1, 2, and 3 show summary statistics for the 3 groups of studied traits, and the level of significance for year, batch, and crammer. Plasma contents of glucose, cholesterol, and triglyceride increased (P < 0.0001) with overfeeding progress. Glucose and cholesterol increase was about 40% from the 2nd to the 20th meal, whereas triglyceride content was more stable with an increase of 15% during the same period. For these 3 blood vari-ables, the variability of measurements (CV ranging from 16 to 28% on average) increased with overfeeding stage. For almost all plasma traits, the level of signifi-cance of the 3 fixed effects was less than 0.001.
Despite a low carcass weight of 4.9 kg, due to their dam line, mule ducks produced a fatty liver of about 570 g and a magret of 408 g (37% of the weight cor-responded to the skin). Phenotypically, the carcass weight was more strongly related to the thigh + shank weight (+0.66) than to the liver weight (+0.43). Oth-erwise, the abdominal fat weight was logically linked to the PM skin and fat weight (+0.49). Among these overfeeding traits, the crammer effect was very high for the carcass weight and the fatty liver weight.
Concerning foie gras quality, the melting rate, with a mean value of 38.7%, had a particularly high variabil-ity (CV of 32%). The liver lipid content was logically high (52% on average) and not very variable, whereas the liver protein content was very low (8%) but quite variable. The collagen content in the liver was low (about 1.27 mg/g). We showed that melting rate was more correlated with liver protein and lipid contents (−0.80 and +0.76, respectively), than with the liver weight (+0.65), and not much linked with the collagen content (−0.27). The liver lipid and protein contents seemed also to affect on the liver lightness (+0.49 and −0.54, respectively) and redness (−0.37 and +0.40, re-spectively). The melting rate and the lipid and protein contents in liver were significantly influenced by the crammer effect.
Concerning magret quality, the value of the pH at 24 h postmortem was 5.7, but 20 min postmortem the pH has already a low value of 6.0, suggesting a fast postmortem decline of the duck meat pH. The magret was also characterized by decreased drip losses (1.6%) and quite large cooking losses (22%). The average mus-cle lipid content was about 4.9% and presented a low variability. A low and positive correlation (+0.34) con-nected the cooking losses and the shearing force. No
clear links could be seen between both pH and other traits describing muscle quality, except a low correla-tion (−0.24) between pH 20 min postmortem and the shearing force. No syndrome of PSE meat was observed in this experiment. Lastly, the most variable chromatic color traits were the liver redness and the muscle yel-lowness. The muscle lipid content was significantly cor-related with the lightness (+0.43), the redness (+0.38), and logically the yellowness (+0.50) of the muscle. For the liver, the lightness and redness were linked with the protein and lipid content (−0.54 and +0.40, respective-ly, for protein; +0.49 and −0.37, respectiverespective-ly, for lipid), and to a lesser extent with the melting rate (+0.39 and −0.32, respectively). The crammer effect was highly significant (Table 3) on all meat quality traits except the pH 20. Last, there was no significant correlation between plasmatic contents and overfeeding ability or products quality traits.
Genetic Results
Tables 4, 5, 6, and 7 give the genetic parameters for the 2 parental lines for the plasma traits, the overfeed-ing ability traits, the liver quality traits, and the muscle quality traits, respectively. Note that the part of vari-Table 1. Means (in g/L), phenotypic SD, and level of significance for fixed effects of
triglyceride (TG), cholesterol (CHO), and glucose (GLU) plasma contents after the 2nd, the 10th, and the 20th overfeeding meals (M)
Item n Mean SD Year Batch Crammer
TG 2nd M 1,499 4.27 1.00 *** ** *** TG 10th M 1,498 4.61 1.08 * *** ns TG 20th M 1,443 4.89 1.52 *** * *** CHO 2nd M 1,501 1.71 0.25 *** *** *** CHO 10th M 1,499 2.11 0.32 *** *** *** CHO 20th M 1,433 2.46 0.47 *** *** *** GLU 2nd M 1,500 2.20 0.27 ns *** * GLU 10th M 1,498 2.69 0.56 *** *** *** GLU 20th M 1,451 3.13 1.08 *** *** ** ***P < 0.001; **P < 0.01; *P < 0.05; ns: not significant.
Table 2. Means, phenotypic SD, and level of significance for fixed effects of overfeed-ing traits
Item1 n Mean SD Year Batch Crammer
DFI, g/d 1,498 1,325 74 ** *** * BWbeg, g 1,501 3,830 300 ns ns ** BWend, g 1,498 5,805 378 * ** ns BWG, g 1,498 1,974 247 * *** ** CW, g 1,474 4,902 329 ns ** *** FLW, g 1,476 569.6 113.5 ns ns *** pmMW, g 1,476 256.5 23.6 ns *** ** pmSFW, g 1,476 152.4 20.3 * ** ** TSW, g 1,476 481.9 45.1 ns * ns AFW, g 1,476 175.0 28.8 * ns *
1DFI: daily feed intake during overfeeding; BWbeg: BW at beginning of overfeeding period; BWend: BW at
end of overfeeding period; BWG: BW gain; CW: bled-plucked carcass weight; FLW: fatty liver weight; pmMW: pectoralis major muscle weight; pmSFW: pectoralis major skin + subcutaneous fat weight; TSW: thigh + shank weight; AFW: abdominal fat weight.
ances due to the parental lines showed in the tables (call heritability on common vs. Muscovy lines) does not account for Mendelian sampling variation in the progeny. However, an estimate of a pseudo-heritability in the mule duck can be obtained as follows: let ss2 be the part of additive variation in the mule ducks due to the sire, sd2 be the part of additive variation in the mule ducks due to the dam, and se2 the remaining variation in the mule duck. This remaining variation contains environmental variation as well as genetic variation due to Mendelian sampling and dominance. In the absence of variation of dominant effects, Mendelian sampling in the progeny would be equal to ss2+sd2 (Lo et al., 1997). Thus, the pseudo-heritability in the mule ducks is equal to h2 =2
(
ss2+sd2)
(
ss2+sd2+s , which is twice the e2)
sum of the elements in the diagonal in Tables 4 to 7, or 4 times the average of the 2 parts of variance. Neverthe-less, this pseudo-heritability in the mule duck has no meaning because of the sterility of the hybrid.Plasma glucose, triglyceride, and cholesterol contents that were measured at the 2nd, 10th, and 20th meals have low to moderate heritabilities. For each of these 3 plasmatic traits, the greatest heritability was obtained at the 20th meal; the heritabilities on the 2nd meal were always less than 0.06. Whatever the plasmatic trait considered, the estimates obtained on the pater-nal side of the mule duck were definitely less than those estimated on the common maternal side. Likewise, the BW had greater heritabilities on the common maternal side than on the Muscovy paternal side. On the com-mon side, the heritability of BW was smaller at the end of the overfeeding period than at the beginning, despite a strong genetic correlation of +0.95 between
the traits at both stages, which is in accordance with the small heritabilities of the BW gain and of the daily feed intake.
After slaughter, the heritabilities of carcass weight and of weights of carcass pieces were moderate to high in the common line, ranging from 0.15 to 0.32. The PM muscle weight was more heritable than the PM skin + fat weight, which had a similar heritability to fatty liver weight. The weight of abdominal fat, despite the difficulty of measurement, showed a suggestive herita-bility. In the Muscovy line, the heritabilities were again low (values ranging from 0.05 to 0.10) with few varia-tions. Regarding genetic correlations, fatty liver weight was slightly opposed to the PM muscle weight in both parental lines. The link between fatty liver weight and PM skin and fat weight was variable according to the parental lines. In addition, PM muscle weight appeared to be linked to the PM skin and fat weight and the thigh + shank weight, in the same direction in the com-mon line and in the opposite direction in the Muscovy line. On both lines, the carcass weight was genetically the same trait (correlations greater than 0.99) as the BW at the end of the overfeeding period. Nevertheless, the carcass weight was genetically linked with the PM muscle weight in the common line and not with the fat-ty liver weight in the Muscovy line. The carcass weight was more dependent on the fatty liver weight than to the PM muscle weight.
Concerning fatty liver quality, the melting rate had an intermediate heritability on the maternal line and a small one on the paternal line. Nevertheless, the ge-netic correlation between fatty liver weight and melt-ing rate was high, positive and similar for both paren-tal lines (+0.80). The liver lipid and protein contents Table 3. Means, phenotypic SD, and level of significance for fixed effects of liver and
magret quality traits
Item1 n Mean SD Year Batch Crammer
MR, % 1,472 38.7 12.4 ** *** *** LLipC, % 1,476 52.4 4.3 * ns *** LProtC, % 1,476 7.7 1.1 *** ns *** LColC, mg/g 1,436 1.27 0.27 ns * ns LL* 1,476 72.4 2.36 * ns * La* 1,476 9.17 1.77 *** * * Lb* 1,476 31.2 2.9 *** ns ns MExu, % 1,462 1.58 0.84 ns ns * MCookL, % 1,437 22.10 3.84 *** *** *** MLipC, % 1,476 4.93 0.70 *** ** * MpH20 1,476 6.01 0.18 ns ns ns MpHu 1,476 5.72 0.14 *** *** *** MFmax, n 1,443 42.49 7.65 *** ns *** ML* 1,476 47.3 3.4 *** ns *** Ma* 1,476 20.4 2.5 *** ** * Mb* 1,475 7.62 1.46 *** *** ***
1MR: liver melting rate; LLipC: liver lipid contents; LProtC: liver protein contents; LColC: liver collagen
contents; LL*: liver lightness, La*: liver redness; Lb*: liver yellowness; MExu: muscle exudation; MCookL: muscle cooking losses; MLipC: muscle lipid contents; MpH20: muscle pH 20 min postmortem; MpHu: muscle ultimate pH; MFmax: muscle force maximum (Warner-Bratzler test); ML*: muscle lightness; Ma*: muscle red-ness; Mb*: muscle yellowness.
***P < 0.001; **P < 0.01; *P < 0.05; ns: not significant.
T able 4. Genetic parameters (heritabilities ± SE on the diagonal, genetic correlations ± SE ab ov e and belo w the diagonal) for trigly ceride (TG), cholesterol (CHO), and glucose (GLU) plasma con ten ts after the 2nd, the 10th, and the 20th ov erfeeding meals (M): common duc k line ab ov e and Musco vy duc k line belo w the diagonal 1 Item TG 2nd M TG 10th M TG 20th M CHO 2nd M CHO 10th M CHO 20th M GLU 2nd M GLU 10th M GLU 20th M TG 2nd M 0.05 ± 0.02 +0.66 ± 0.21 +0.76 ± 0.18 −0.12 ± 0.37 +0.07 ± 0.31 +0.33 ± 0.27 +0.40 ± 0.32 +0.61 ± 0.53 +0.60 ± 0.24 0.04 ± 0.02 TG 10th M +0.38 ± 0.44 0.11 ± 0.03 +0.86 ± 0.11 +0.28 ± 0.33 +0.35 ± 0.19 +0.41 ± 0.23 +0.37 ± 0.31 +0.77 ± 0.24 +0.76 ± 0.13 0.03 ± 0.02 TG 20th M +0.91 ± 0.17 +0.29 ± 0.51 0.13 ± 0.03 +0.15 ± 0.24 +0.28 ± 0.23 +0.48 ± 0.18 +0.16 ± 0.41 +0.62 ± 0.34 +0.85 ± 0.14 0.03 ± 0.03 CHO 2nd M +0.21 ± 0.33 −0.18 ± 0.37 +0.21 ± 0.37 0.06 ± 0.03 +0.67 ± 0.22 +0.77 ± 0.16 −0.43 ± 0.30 +0.18 ± 0.54 +0.22 ± 0.23 0.05 ± 0.02 CHO 10th M −0.25 ± 0.31 −0.39 ± 0.33 −0.16 ± 0.39 +0.87 ± 0.11 0.11 ± 0.03 +0.81 ± 0.14 −0.08 ± 0.30 +0.53 ± 0.36 +0.59 ± 0.21 0.05 ± 0.02 CHO 20th M −0.01 ± 0.31 −0.14 ± 0.33 +0.01 ± 0.41 +0.75 ± 0.17 +0.67 ± 0.21 0.12 ± 0.03 −0.31 ± 0.30 +0.42 ± 0.36 +0.59 ± 0.15 0.03 ± 0.02 GLU 2nd M +0.53 ± 0.38 +0.68 ± 0.28 +0.63 ± 0.24 −0.01 ± 0.34 −0.17 ± 0.42 −0.02 ± 0.44 0.04 ± 0.02 +0.59 ± 0.32 +0.28 ± 0.32 0.02 ± 0.02 GLU 10th M +0.07 ± 0.29 −0.26 ± 0.45 +0.26 ± 0.28 −0.02 ± 0.36 +0.09 ± 0.30 −0.35 ± 0.30 +0.01 ± 0.39 0.01 ± 0.01 +0.75 ± 0.48 0.04 ± 0.02 GLU 20th M −0.24 ± 0.39 −0.44 ± 0.39 −0.01 ± 0.35 −0.29 ± 0.29 −0.03 ± 0.30 −0.39 ± 0.29 −0.13 ± 0.62 +0.89 ± 0.11 0.12 ± 0.04 0.06 ± 0.03 1 TG 2nd M: trigly ceride con ten ts after 2nd meal; TG 10th M: trigly ceride con ten ts after 10th meal; TG 20th M: trigly ceride con ten ts after 20th meal; CHO 2nd M: cholesterol con ten ts after 2nd meal; CHO 10th M: cholesterol con ten ts after 10th meal; CHO 20th M: cholesterol con ten ts after 20th meal; GLU 2nd M: glucose con ten ts after 2nd meal; GLU 10th M: glucose con ten ts after 10th
meal; GLU 20th M: glucose con
ten
T able 5. Genetic parameters (heritabilities ± SE on the diagonal, genetic correlations ± SE ab ov e and belo w the diagonal) for ov erfeeding abilit y traits: common duc k line ab ov e and Musco vy duc k line b elo w the diagonal 1 Item DFI BWb eg BW end B WG CW F LW pmMW pmSFW TSW AFW DFI 0.06 ± 0.03 +0.25 ± 0.19 +0.12 ± 0.22 −0.39 ± 0.28 +0.13 ± 0.60 −0.28 ± 0.29 +0.19 ± 0.19 +0.51 ± 0.19 +0.38 ± 0.20 +0.21 ± 0.29 0.05 ± 0.02 BWb eg +0.62 ± 0.29 0.34 ± 0.04 +0.95 ± 0.03 −0.09 ± 0.19 +0.93 ± 0.03 −0.10 ± 0.13 +0.89 ± 0.04 +0.59 ± 0.09 +0.86 ± 0.06 +0.40 ± 0.09 0.05 ± 0.03 BW end +0.55 ± 0.31 +0.84 ± 0.11 0.23 ± 0.04 +0.24 ± 0.17 +0.99 ± 0.01 +0.08 ± 0.16 +0.84 ± 0.05 +0.58 ± 0.09 +0.84 ± 0.07 +0.44 ± 0.10 0.05 ± 0.03 B WG +0.14 ± 0.34 +0.15 ± 0.38 +0.65 ± 0.23 0.06 ± 0.03 +0.28 ± 0.22 +0.55 ± 0.16 −0.07 ± 0.20 +0.01 ± 0.22 −0.01 ± 0.21 +0.15 ± 0.16 0.04 ± 0.03 CW +0.58 ± 0.45 +0.84 ± 0.16 +0.99 ± 0.05 +0.65 ± 0.23 0.21 ± 0.04 +0.11 ± 0.16 +0.82 ± 0.05 +0.60 ± 0.09 +0.84 ± 0.05 +0.49 ± 0.09 0.05 ± 0.03 F LW +0.03 ± 0.29 +0.13 ± 0.35 +0.47 ± 0.28 +0.67 ± 0.17 +0.44 ± 0.24 0.15 ± 0.03 −0.17 ± 0.14 −0.29 ± 0.14 −0.31 ± 0.15 +0.03 ± 0.15 0.08 ± 0.03 pmMW +0.53 ± 0.23 +0.25 ± 0.46 +0.14 ± 0.45 −0.09 ± 0.36 +0.15 ± 0.28 −0.05 ± 0.25 0.32 ± 0.04 +0.48 ± 0.11 +0.74 ± 0.07 +0.25 ± 0.10 0.07 ± 0.04 pmSFW +0.19 ± 0.30 +0.80 ± 0.14 +0.82 ± 0.11 +0.39 ± 0.34 +0.79 ± 0.13 +0.39 ± 0.23 −0.09 ± 0.30 0.16 ± 0.03 +0.76 ± 0.11 +0.55 ± 0.10 0.10 ± 0.04 TSW +0.34 ± 0.20 +0.55 ± 0.29 +0.59 ± 0.21 +0.31 ± 0.43 +0.58 ± 0.16 −0.13 ± 0.27 −0.08 ± 0.38 +0.56 ± 0.22 0.20 ± 0.04 +0.39 ± 0.10 0.05 ± 0.03 AFW +0.66 ± 0.33 +0.63 ± 0.24 +0.60 ± 0.25 +0.22 ± 0.35 +0.63 ± 0.19 +0.41 ± 0.24 −0.01 ± 0.30 +0.41 ± 0.21 +0.19 ± 0.29 0.25 ± 0.04 0.09 ± 0.04 1 DFI: daily feed in tak e during ov erfeeding; BWb eg: BW at beginning of ov erfeeding perio d; BW end: BW at end of ov erfeeding perio d; BW G: BW gain; CW: bled-pluc ked carcass w eigh t; FL W: fatt y liv er w eigh t; pmMW: p ectoralis ma jor m uscle w eigh t; pmSFW: p ectoralis ma
jor skin + sub
cutaneous fat w eigh t; TSW: thigh + shank w eigh t; AFW: ab dominal fat w eigh t.
have a smaller genetic variability than melting rate, but lipid and protein contents were highly correlated to the melting rate. The liver collagen content had the smallest heritability either on the maternal than on the paternal lines, and was less negatively linked with the fatty liver weight and the melting rate than the protein contents. For the 3 color traits (L*, a*, and b*), herita-bilities were moderate on the common line and slightly weaker on the Muscovy line; only the yellowness had a comparable heritability on both parental lines. The link between lightness and yellowness seems to be different according to the parental line.
Regarding the muscle quality, the muscle lipid content had the greatest genetic variability. The 3 color traits had moderate heritabilities with, once again, greater values on the maternal side. The muscle redness (as for the liver yellowness) had similar heritability estimates on both lines. We have shown that muscle lipid content was genetically linked with drip losses (about −0.80) and with muscle yellowness (about +0.88). For other muscle quality traits (ultimate pH, drip losses, cooking losses, and shearing force), whatever the lines studied, heritability estimates were very low, and not different from zero. The parental lines have a different genetic link between the pH 20 min postmortem and the lipid content in the muscle. Likewise the link between muscle tenderness (muscle force maximum by Warner-Bratzler test) and yellowness of the meat was negative in the common line and null in the Muscovy line.
All genetic correlations between plasmatic traits at the end of overfeeding period and overfeeding ability traits (fatty liver weight, abdominal fat weight, PM skin + subcutaneous fat weight, and PM muscle weight) or quality traits (liver melting rate, liver lipid contents, liver protein contents, muscle cooking losses, liver light-ness, and muscle lightness) were not different from 0.
DISCUSSION
In our approach, the total genetic variability of mule traits was divided into the paternal and the ma-ternal lines, as done by a “sire-dam” model in a pure population, the sire and the dam accounting each for one-quarter of the additive variance of the trait. The comparison of estimates obtained on each parental line reveals that the values were systematically greater in the common maternal line. This difference of heritabil-ity values according to the transmission way had al-ready been highlighted for carcass and muscle weights by Chapuis and Larzul (2006). It became widespread to all the traits in our study.
We provide 3 hypotheses for this disequilibrium be-tween genetic determinism in parental lines. First, the greater heritability SD from the Muscovy line is simply due to scarcity of data (there were only 56 Muscovy sires against 382 common dams), which could induce that estimates of heritabilities are poor and less ac-curate. Second, although the common population is a crossbreeding between 2 different common lines, we as-sumed that these 2 lines formed a single population. Thus, extra between-lines variation due to, for example, fixation of alternative QTL alleles of QTL in each line is included in the heritability. Nevertheless, regarding the results, we hypothesize that our Muscovy popula-tion is more genetically homogeneous than our com-mon population. Third, we hypothesize that the greater heritability estimates on the common line result from a maternal effect absorption in the additive genetic ef-fect of the female duck. That is, the heritability is then artificially overestimated on the maternal common line. Nevertheless, Larzul et al. (2006) estimated maternal effects on overfeeding ability and meat quality traits with a duck factorial crossbreeding study; only fatty Table 6. Genetic parameters (heritabilities ± SE on the diagonal, genetic correlations ± SE above and below the diagonal) for fatty liver quality traits: common duck line above and Muscovy duck line below the diagonal1
Item FLW MR LLipC LProtC LColC LL* La* Lb*
FLW 0.18 ± 0.03 +0.80 ± 0.07 +0.86 ± 0.06 −0.93 ± 0.04 −0.66 ± 0.12 +0.68 ± 0.11 −0.69 ± 0.12 −0.27 ± 0.18 0.09 ± 0.03 MR +0.79 ± 0.13 0.19 ± 0.04 +0.87 ± 0.05 −0.86 ± 0.05 −0.56 ± 0.14 +0.48 ± 0.15 −0.61 ± 0.16 −0.06 ± 0.18 0.08 ± 0.03 LLipC +0.79 ± 0.12 +0.93 ± 0.06 0.16 ± 0.03 −0.96 ± 0.03 −0.68 ± 0.15 +0.50 ± 0.16 −0.61 ± 0.19 −0.05 ± 0.19 0.06 ± 0.03 LProtC −0.81 ± 0.10 −0.89 ± 0.08 −0.89 ± 0.08 0.17 ± 0.03 +0.78 ± 0.16 −0.66 ± 0.11 +0.69 ± 0.15 +0.15 ± 0.18 0.09 ± 0.03 LColC −0.77 ± 0.20 −0.51 ± 0.28 −0.68 ± 0.36 +0.52 ± 0.55 0.09 ± 0.03 −0.71 ± 0.17 +0.73 ± 0.21 −0.03 ± 0.28 0.02 ± 0.02 LL* +0.80 ± 0.13 +0.52 ± 0.20 +0.52 ± 0.26 −0.61 ± 0.16 −0.60 ± 0.39 0.11 ± 0.03 −0.87 ± 0.09 −0.49 ± 0.17 0.05 ± 0.03 La* −0.64 ± 0.16 −0.35 ± 0.24 −0.45 ± 0.24 +0.47 ± 0.22 +0.76 ± 0.21 −0.77 ± 0.14 0.10 ± 0.03 +0.35 ± 0.22 0.06 ± 0.03 Lb* −0.19 ± 0.23 −0.18 ± 0.24 −0.22 ± 0.24 +0.43 ± 0.21 +0.05 ± 0.55 +0.01 ± 0.25 −0.01 ± 0.26 0.13 ± 0.04 0.12 ± 0.04
1FLW: fatty liver weight; MR: liver melting rate; LLipC: liver lipid contents; LProtC: liver protein contents; LColC: liver collagen contents; LL*:
T able 7. Genetic parameters (heritabilities ± SE on the diagonal, genetic correlations ± SE ab ov e and belo w the diagonal) for pectoralis ma jor m uscle qualit
y traits: common duc
k line ab ov e and Musco vy duc k line b elo w the diagonal 1 Item pmMW MExu MCo okL MLipC MpH20 MpHu MFmax ML* Ma* Mb* pmMW 0.32 ± 0.04 −0.10 ± 0.33 −0.77 ± 0.19 −0.13 ± 0.11 −0.16 ± 0.17 +0.15 ± 0.27 −0.01 ± 0.19 −0.15 ± 0.14 +0.10 ± 0.13 −0.11 ± 0.13 0.08 ± 0.04 MExu +0.05 ± 0.29 0.02 ± 0.02 −0.10 ± 0.39 −0.80 ± 0.11 +0.09 ± 0.39 −0.14 ± 0.53 +0.70 ± 0.39 −0.68 ± 0.21 −0.25 ± 0.29 −0.63 ± 0.24 0.05 ± 0.02 MCo okL −0.22 ± 0.37 +0.57 ± 0.28 0.03 ± 0.02 +0.45 ± 0.31 −0.29 ± 0.37 −0.02 ± 0.36 +0.06 ± 0.42 +0.17 ± 0.39 +0.12 ± 0.14 +0.36 ± 0.30 0.02 ± 0.02 MLipC +0.01 ± 0.27 −0.78 ± 0.18 −0.27 ± 0.33 +0.24 ± 0.04 −0.40 ± 0.19 +0.29 ± 0.35 −0.36 ± 0.17 +0.64 ± 0.13 +0.59 ± 0.13 +0.90 ± 0.07 +0.11 ± 0.04 MpH20 +0.22 ± 0.31 +0.60 ± 0.27 +0.50 ± 0.36 −0.62 ± 0.19 0.04 ± 0.03 −0.17 ± 0.48 −0.32 ± 0.23 −0.08 ± 0.27 −0.28 ± 0.24 −0.40 ± 0.21 0.05 ± 0.03 MpHu +0.13 ± 0.32 −0.05 ± 0.35 −0.24 ± 0.46 −0.28 ± 0.30 −0.02 ± 0.38 0.02 ± 0.02 −0.27 ± 0.46 +0.38 ± 0.45 +0.37 ± 0.46 +0.54 ± 0.34 0.02 ± 0.02 MFmax −0.30 ± 0.31 +0.20 ± 0.30 +0.12 ± 0.47 +0.08 ± 0.30 −0.59 ± 0.30 −0.13 ± 0.53 0.06 ± 0.03 −0.71 ± 0.19 +0.22 ± 0.21 −0.35 ± 0.33 0.03 ± 0.02 ML* +0.06 ± 0.29 −0.16 ± 0.27 +0.36 ± 0.30 +0.65 ± 0.18 −0.25 ± 0.27 −0.32 ± 0.32 +0.30 ± 0.30 0.12 ± 0.04 −0.01 ± 0.20 +0.73 ± 0.14 0.09 ± 0.03 Ma* −0.21 ± 0.28 −0.71 ± 0.19 −0.40 ± 0.35 +0.51 ± 0.21 −0.52 ± 0.24 −0.44 ± 0.35 −0.05 ± 0.33 −0.09 ± 0.24 0.14 ± 0.04 +0.56 ± 0.13 0.14 ± 0.04 Mb* −0.08 ± 0.28 −0.59 ± 0.26 −0.10 ± 0.38 +0.86 ± 0.13 −0.35 ± 0.26 −0.67 ± 0.27 −0.05 ± 0.36 +0.59 ± 0.22 +0.60 ± 0.20 0.13 ± 0.04 0.06 ± 0.04 1 pmMW: pectoralis ma jor m uscle w eigh t; MExu: m uscle exudation; MCo okL: m uscle co oking losses; MLipC: m uscle lipid con ten ts; MpH20: m uscle pH 20 min postmortem; MpHu: m uscle ultimate pH; MFmax: m
uscle force maxim
um (W arner-Bratzler test); ML*: m uscle ligh tness, Ma*: m uscle redness; Mb*: m uscle y ello wness.
liver weight and overfeeding BW gain presented a favor-able Pekin maternal effect of low magnitude, whereas muscle temperature 20 min postmortem and shearing force show a favorable Muscovy maternal effect. How-ever, we have a huge difference of heritabilities between the 2 parental lines for BW at the beginning and at the end of the overfeeding period and Larzul et al. (2006) showed no significant maternal effects on both traits. Thus, the hypothesis of a maternal effect bias does not seem adequate for most traits. Moreover, Chapuis and Larzul (2006) showed the same trend of greater herita-bilities in the common line than in the Muscovy line, with a large number of data. Thus, we could conclude that it seems more efficient to select mule ducks traits (i.e., overfeeding ability traits or liver and muscle qual-ity traits) on the maternal common line rather than on the paternal Muscovy line.
To our knowledge, these are the first genetic pa-rameters published for some plasma variables during overfeeding: the glucose, triglyceride, and cholesterol contents were heritable, in particular at the end of the overfeeding period, and the level of heritabilities in-creased with the overfeeding stage. With our data set, the genetic correlations between these metabolic indi-cators and overfeeding ability traits or product quality traits were not significant, and lead to the conclusion that these metabolic variables are not relevant genet-ic predgenet-ictors of overfeeding ability traits or quality of product traits. Nevertheless, because the SE of correla-tions are large, the study of these links must be deep-ened.
Our estimate of fatty liver weight heritability of 0.18 on the maternal line was greater than that of Larzul (2002) and Chapuis and Larzul (2006), which amount-ed respectively to 0.10 and 0.06, but strictly conformamount-ed to that estimated by Poujardieu et al. (1994). We con-firmed the moderate heritability of the melting rate (0.19), as well as the strong genetic correlation between fatty liver weight and melting rate already estimated at +0.88 by Poujardieu et al. (1994). Moreover, we showed that this correlation was comparable in both parental lines. The PM muscle weight and, to a lesser extent, the PM skin and fat weight were heritable, but our estimates appeared to be slightly greater than those previously published (Poujardieu et al., 1994). On the common line, our correlation between the fatty liver weight and the PM muscle weight was similar to that published by these same authors. Last, the abdominal fat weight and the thigh + shank weight were proved to be also heritable. Thus, it is thus also possible to genetically improve them.
Among product quality traits, the visual appearance was one of the most important traits. We have shown, for the first time in overfed waterfowl, that the 3 color traits either for the fatty liver or for the PM muscle were heritable on the common line, as the liver yel-lowness and the muscle redness on the Muscovy line. These original results are strengthened by published estimates on broiler meat (heritabilities ranging from
0.25 to 0.35; Debut et al., 2005) and on turkey meat (heritability slightly less than 0.20, Renand et al., 2003; heritabilities ranging from 0.10 to 0.32, Le Bihan-Duval et al., 2003).
Finally, we obtained singular results on the PM muscle quality. First of all, muscle lipid contents were highly heritable. It could be interesting to estimate the genetic correlation between muscle lipid contents and meat gustative quality. Otherwise, the pH 20 min or 24 h postmortem of red duck meat was not heritable, which conflicts with the poultry literature in which es-timates range from 0.30 to 0.49 (Le Bihan-Duval et al., 2001; Debut et al., 2005), but is similar to estimates on bovine red meat (0.11 ± 0.05 for pH 24 h; Renand, 1985). The result in duck is in accordance with the ge-netic determinism of the red meat pH variation. Unlike the white muscle fibers in which energetic metabolism is only glycolytic and strongly related to the pH varia-tion, the red muscle fibers have a more complex metab-olism, which could explain the low genetic determin-ism of the pH postmortem. The meat quality appraisal criteria (such as texture and cooking losses), usually partly dependent on the pH and its rate of decline, were also not very heritable. This aspect remains to be deepened to confirm the original genetic determinism of duck meat.
We outlined some opposing correlations among traits according to the parental lines (carcass weight and fatty liver weight; fatty liver lightness and yellowness; pH 20 min postmortem and muscle lipid contents; tenderness and yellowness of the meat). These results demonstrat-ed that genetic determinism of meat quality aptitude and ability of overfeeding is not similar in the common population and in the Muscovy population. According to the trait, the parental population with the highest heritability must be chosen to perform the more ef-ficient selection.
Conclusions
Based on the Lo et al. (1997) model, this study points out differences in the genetic determinism between mule duck parental lines. Most overfeeding ability traits and fatty liver or muscle quality traits are more heritable in the common line than in the Muscovy line. Thus, except for meat and liver color which have similar heri-tabilities on common and Muscovy lines, traits relat-ed to fattening (fatty liver weight, liver lipid content, PM skin and subcutaneous fat weight, abdominal fat weight), to muscle development (PM muscle weight, thigh and shank weight, and carcass weight) and above all to BW have heritability values from 2 to 4 times greater on the common line than on the Muscovy line. This study also demonstrated that liver quality traits are more heritable than meat quality traits (apart from the muscle lipid contents). Fortunately, the processing industry is mainly facing problems in liver quality, such as too high of a melting rate, than in meat quality. Our experimental design allowed the genetic parameter
estimates of physiological indicators of metabolism. If the overfeeding stage is sufficient, these indicators are heritable on the common side, but because they are not correlated with quality traits they cannot be used as quality predictors.
LITERATURE CITED
Chapuis, H., and C. Larzul. 2006. How to estimate simultaneously genetic parameters in parental Pekin and Muscovy duck lines using overfed mule ducks performances. Proc. 8th World Con-gr. Genet. Appl. Livest. Prod., Belhorizonte, Brazil. Commun. 07–08.
Debut, M., C. Berri, E. Baéza, N. Sellier, C. Arnould, D. Guéméné, N. Jehl, B. Boutten, C. Beaumont, and E. Le Bihan-Duval. 2005. Analyse en Composantes Principales (ACP) de la qualité technologique de la viande de poulet en relation avec le géno-type et le stress avant abattage. Pages 355–359 in Proc. 6ème JRA, Saint Malo, France.
Fossati, P., and L. Prencipe. 1982. Serum triglycerides determined colorimetrically with an enzyme that produces hydrogen perox-ide. Clin. Chem. 28:2077–2080.
Larzul, C. 2002. Genetic parameters for overfed mule duck traits. Proc. 7th World Congr. Genet. Appl. Livest. Prod., Montpel-lier, France. Commun. 04-08.
Larzul, C., B. Imbert, M.-D. Bernadet, G. Guy, and H. Rémignon. 2006. Meat quality in an intergeneric factorial crossbreeding between Muscovy (Cairina moschata) and Pekin (Anas
platy-rhyncos) ducks. Anim. Res. 55:1–11.
Le Bihan-Duval, E., C. Berri, E. Baéza, N. Millet, and C. Beau-mont. 2001. Estimation of the genetic parameters of meat char-acteristics and of their genetic correlations with growth and body composition in an experimental broiler line. Poult. Sci. 80:839–843.
Le Bihan-Duval, E., C. Berri, E. Baéza, V. Santé, T. Astruc, H. Rémignon, G. Le Pottier, J. Bentley, C. Beaumont, and F. Fer-nandez. 2003. Genetic parameters of meat technological quality
traits in a grand-parental commercial line of turkey. Genet. Sel. Evol. 35:623–635.
Lo, L. L., R. L. Fernando, R. J. C. Cantet, and R. Grossman. 1995. Theory of modelling means and covariances in a two-breed population with dominance inheritance. Theor. Appl. Genet. 90:49–62.
Lo, L. L., R. L. Fernando, and R. Grossman. 1997. Genetic evalu-ation by BLUP in two-breed terminal crossbreeding systems under dominance. J. Anim. Sci. 75:2877–2884.
Lutaaya, E., I. Misztal, J. W. Mabry, T. Short, H. H. Timm, and R. Holzbauer. 2001. Genetic parameter estimates from joint evaluation of purebreds and crossbreds in swine using crossbred model. J. Anim. Sci. 79:3002–3007.
Marie-Etancelin, C., H. Chapuis, J.-M. Brun, C. Larzul, M.-M. Mialon-Richard, and R. Rouvier. 2008. Genetics and selec-tion of mule ducks in France: A review. World’s Poult. Sci. J. 64:187–207.
Misztal, I. 1999. Complex models, more data: Simpler programming. Interbull. Bull. 20:33–42.
Poujardieu, B., F. Guichard, and P. Laventure. 1994. Paramètres génétiques de croissance et de gavage de la cane commune. Genet. Sel. Evol. 26:468–472.
Renand, G. 1985. Genetic parameters of French beef breeds used in crossbreeding for young bull production II—Slaughter perfor-mance. Genet. Sel. Evol. 17:265–282.
Renand, G., C. Larzul, E. Le Bihan-Duval, and P. Le Roy. 2003. L’amélioration génétique de la qualité de la viande dans les différentes espèces: Situation actuelle et perspectives à court et moyen terme. INRA Prod. Anim. 16:159–173.
Richmond, W. 1973. Preparation and properties of a cholesterol oxy-dase from Nocardia sp. and its application to the enzymatic assay of total cholesterol in serum. Clin. Chem. 19:93–98. Trinder, P. 1969. Determination of blood glucose using 4-amino
phenazone as oxygen acceptor. J. Clin. Pathol. 22:246. Woessner, J. F., Jr. 1961. The determination of hydroxyproline in
tissue and protein samples containing small proportions of this amino acid. Arch. Biochem. Biophys. 93:440–447.
http://www.journalofanimalscience.org/content/89/3/669#BIBL Citations
http://www.journalofanimalscience.org/content/89/3/669#otherarticles