ACCEPTED MANUSCRIPT
Highlights
Hospital Big data offers new opportunities in the monitoring of flu epidemics.
Clinical data are more highly correlated with the Sentinel network than queries from Google internet-user activity.
ACCEPTED MANUSCRIPT
Leveraging hospital big data to monitor flu epidemics
Guillaume Bouzillé1234*, Canelle Poirier126, Boris Campillo-Gimenez12, Marie-Laure Aubert6, Mélanie Chabot6, Emmanuel Chazard7, Audrey Lavenu35, Marc Cuggia1234
1
INSERM, U1099, Rennes, F-35000, France
2
Université de Rennes 1, LTSI, Rennes, F-35000, France
3
CHU Rennes, CIC Inserm 1414, Rennes, F-35000, France
4
CHU Rennes, Centre de Données Cliniques, Rennes, F-35000, France
5
Université Rennes 1, Rennes, F-35000, France
6
Université de Rennes 2, IRMAR, Rennes, F-35000, France
7
Département de Santé Publique, Université de Lille EA 2694, CHU Lille, F-59000 Lille, France
* Corresponding author
E-mail: guillaume.bouzille@chu-rennes.fr LTSI - UMR Inserm - Université de Rennes 1k Equipe-Projet Données massives en santé (DMS) Campus de Villejean - Bât. 6
35043 Rennes Cedex, France
Abstract
Background and Objective
Influenza epidemics are a major public health concern and require a costly and time-consuming surveillance system at different geographical scales. The main challenge is being able to predict epidemics. Besides traditional surveillance systems, such as the French Sentinel network, several studies proposed prediction models based on internet-user activity. Here, we assessed the potential of hospital big data to monitor influenza epidemics.
Methods
We used the clinical data warehouse of the Academic Hospital of Rennes (France) and then built different queries to retrieve relevant information from electronic health records to gather weekly influenza-like illness activity.
ACCEPTED MANUSCRIPT
Results
We found that the query most highly correlated with Sentinel network estimates was based on emergency reports concerning discharged patients with a final diagnosis of influenza (Pearson’s correlation coefficient (PCC) of 0.931). The other tested queries were based on structured data (ICD-10 codes of influenza in Diagnosis-related Groups, and influenza PCR tests) and performed best (PCC of 0.981 and 0.953, respectively) during the flu season 2014-15. This suggests that both ICD-10 codes and PCR results are associated with severe epidemics. Finally, our approach allowed us to obtain additional patients’ characteristics, such as the sex ratio or age groups, comparable with those from the Sentinel network.
Conclusions
Hospital big data seem to have a great potential for monitoring influenza epidemics in near real-time. Such a method could constitute a complementary tool to standard surveillance systems by providing additional characteristics on the concerned population or by providing information earlier. This system could also be easily extended to other diseases with possible activity changes. Additional work is needed to assess the real efficacy of predictive models based on hospital big data to predict flu epidemics.
Keywords: Health Big Data; Clinical Data Warehouse; Information Retrieval System; Health Information Systems; Influenza; Sentinel surveillance
1 Introduction
Currently, flu activity monitoring remains challenging and is a costly and time-consuming task [1]. Flu epidemics are a major public health issue because each year, they cause 250,000 to 500,000 deaths worldwide and they destabilize health care systems, resulting in overcrowding of primary care centers and emergency departments [2–4]. Many actors are involved in influenza monitoring, at the local, regional, national and international level. National surveillance systems are the cornerstone of this system. For instance, the US influenza Sentinel Provider Surveillance Network, belonging to the Center for Disease Control and Prevention (CDC), in the United States
ACCEPTED MANUSCRIPT
of America, and the Sentinel network in France, both provide weekly flu activity reports based on data collected from general practitioners [5,6].
Such national flu surveillance systems provide a fine-grained description of what happens at the regional or national level and allow researchers to observe inter-annual epidemic variations. However, these reports are usually available with a delay of one to two weeks and need to be refreshed until all data from a given week have been reported. This delay in data availability limits their use for real-time monitoring purposes. Moreover, data reported by the Sentinel network provide very few details about patients, beside age or sex. Yet, it would be of great interest to better describe, for instance, the comorbidities (e.g., International Classification of Diseases, 10th revision, ICD-10, codes), or to identify subgroups of patients who are more likely to catch influenza or to develop influenza-related complications.
For these reasons, influenza surveillance now relies also on other data sources that gather additional information, such as self-reporting from patients, viral surveillance or data from emergency departments (ED) [2,7,8]. In France, the French Public Health Agency launched an additional monitoring system based on data collected from 86% of all French EDs, thus covering most of the French territory [9]. This project provides a better understanding of flu epidemic severity, especially in relation to cases that require hospitalization.
There is also a growing interest in finding other ways that rely on alternative data sources to achieve near real-time monitoring. Many studies have assessed the use of internet-user activity data because they can produce real-time indicators [10–18]. Several data sources have been explored, including Wikipedia, Twitter or Google search-engine data. For instance, Google created a project dedicated to influenza monitoring: Google Flu Trends (GFT). This project uses search queries connected with influenza-like illnesses (ILI) from Google.com to produce influenza activity estimates [2]. Since its launch in the United States in 2008, GFT predictions have proven to be very accurate when compared to CDC reports. Moreover, GFT data are available 7-10 days before those of the CDC [12]. GFT was extended to other countries and its estimates confirmed to be accurate. However, GFT yielded inaccurate data during several periods [19,20]. In 2009, it produced lower estimates at the start of the H1N1 pandemic; in 2013 its estimates were almost twice those from the CDC. As a result, GFT is currently closed to the public. GFT appeared to be sensitive to uncommon flu epidemics, to media coverage, to changes in the internet users’ habits and to modifications of the algorithm in the Google search engine [11,20]. Consequently, other studies proposed to combine traditional surveillance systems and web data, to benefit from the advantages of both systems. One example is the recently published work on the ARGO model that could be considered to be a GFT update. It combine Google and
ACCEPTED MANUSCRIPT
CDC ILI activity data with a dynamic statistical model (least absolute shrinkage and selection operator, LASSO) to weekly redefine the best predictors for the current week and readjust their coefficients [11]. This model seems very promising because it can produce near real-time flu activity indexes that are very accurate compared with those produced by the CDC, with a correlation coefficient of predicted values for the flu seasons of the 2010-2014 period ranging from 0.928 to 0.993.
However, neither standard systems nor the current web-based models are designed to monitor flu activity at a smaller scale, such as that of a hospital. Yet, flu epidemics strongly contribute to the overcrowding of adult and pediatric EDs. A study by Dugas et al, showed a high correlation between city-level GFT data (Baltimore) and the number of patients visiting adult (r = 0.885) and pediatric EDs (r = 0.652). Specifically, GFT data correlation with standard overcrowding measures was high for pediatric EDs (r = 0.641 to 0.649) and moderate for adult EDs (r = 0.421 to 0.548) [21].
With the widespread adoption of Electronic Health Records (EHRs), hospitals also are producing a huge amount of data - collected during the course of clinical care - that offer a window into the medical care, status and outcomes of a varied population who is representative of the actual patients [22,23]. This huge amount of data holds the promise of supporting a wide range of medical and health care functions, including, among others, clinical decision-making support, disease surveillance or population health management [24].
Hospitals are currently deploying information technologies and tools intended to facilitate access to clinical data for secondary-use purposes. Among these technologies, clinical data warehouses (CDWs) come forth as one of the solutions to address Hospital Big Data (HBD) exploitation [25]. Different projects have developed CDWs with different architectures, tools and services dedicated to the reuse of patient data coming from EHRs [26–31]. Depending on their Extract-Transform and Load process, CDWs can collect data in real-time, such as the STRIDE CDW of Stanford University [30]. The most famous CDW technology is the Informatics for Integrating Biology & the Bedside project (i2b2), developed by Harvard Medical School, that is now used worldwide in clinical research and can be updated in real-time [32,33]. At our academic hospital in Rennes (France), we developed our own CDW technology, called eHOP (formerly named Roogle [31]). Structured (laboratory, prescriptions, ICD-10 diagnoses) and unstructured (discharge summaries, histopathology, operative reports) data can be integrated in eHOP in real time. Unlike i2b2 data models, eHOP integrates the chain of clinical events into its design and allows the direct access to EHRs. eHOP consists of a powerful search engine system that can identify patients who match specific criteria retrieved either from unstructured data, via
ACCEPTED MANUSCRIPT
keywords, or from structured data, by querying terminology-based codes. The eHOP CDW is used routinely for clinical research purposes, such as feasibility studies, cohort detection and pre-screening, at Rennes academic hospital. The eHOP technology is currently implemented in the other five academic hospitals of the Western region of France (Angers, Brest, Nantes, Poitiers and Tours). Its use will constitute a great source of health data that cover a large part of the population of the West of France who has access to health care facilities linked to eHOP (about 11 million inhabitants; 800,000 visits per year) [34].
We believe that CDWs can help to monitor influenza-like illness (ILI) thanks to their ability to provide data in near real-time and at a local scale. Moreover, the richness of the data produced during patient management will allow a better patient characterization.
In this paper, we present a feasibility study on the production of accurate near-real-time estimates of ILI activity based on the CDW eHOP.
2 Methods
We extracted data from the eHOP CDW of the academic hospital of Rennes, from September 1, 2010 to August 31, 2015. This corresponds to the last five winter seasons defined by the Sentinel network (beginning on the first day of September of every year and ending on 31 August of the following year). The data integration and storage method was the same during the entire study period. As a reference, we used French Sentinel network data on Brittany for the same period (https://websenti.u707.jussieu.fr/sentiweb/?page=table). Brittany is the French region from where most patients at Rennes academic hospital come. We also considered internet-based ILI estimates from GFT for Brittany, from September 1, 2010 to August 10, 2015 (date of GFT closure) as an additional source for comparison (https://www.google.org/flutrends/about/data/flu/fr/data.txt). We tested two main approaches with the purpose of identifying patients who might have ILI, from data stored in eHOP (see S1 Table for a complete query description). The first approach was based on three different full-text queries to retrieve documents that match the following keywords and constraints:
₋ Flu query: documents matching the keywords “flu”, in the absence of “flu vaccination,” and “avian flu.”
₋ Symptoms query: documents matching the keywords “fever” or “pyrexia” and “ache” or “muscle pain.”
ACCEPTED MANUSCRIPT
₋ Emergency query: ED discharge summaries where “flu” was the final diagnosis. Only applicable to discharged patients (i.e., documents belonging to patients who were further hospitalized were not considered).
The first two queries could retrieve any kind of document, including discharge summaries of inpatients or outpatients, emergency discharge summaries, operative reports, laboratory results, Diagnosis-Related Groups (DRGs), X-ray reports or histopathology reports. The third query was focused on retrieving documents from the ED.
The second approach involved querying CDW structured data for the following appropriate terminologies:
⁻ ICD-10 query: DRGs having at least one code belonging to the influenza-related ICD-10 chapters: J09.x, J10.x or J11.x.
⁻ Biology query: We relied on the local terminology used by the laboratory information system to retrieve all flu PCR test results (negative and positive). The aim was to have a signal connected with ILI symptoms and not only with flu.
Given that the study purpose was not to assess query accuracy or recall, we made the assumption that potential noise was constant over time. Hence, we did not manually validate the relevance of patients retrieved by the query and we retained the entire list of patients. We then processed the weekly incidences for each query. Our definition of ILI case covered any patient visit for which a document that matched a given query was generated. The date of the case was thus the patient’s admission date. A null incidence estimate was inputted for all weeks without cases. The entire process was performed using anonymous data from the eHOP CDW.
As additional variables, we retrieved the patients’ birthdate to perform analyses based on patients’ age groups at the time of the visit: 0 to 4 years, 5 to 14 years, 15 to 64 years and 65 years and more. The aim was to assess whether the epidemic severity could be extrapolated from such data. We considered that severe epidemics might affect especially younger and/or older people among all hospitalized patients compared with the population covered by the Sentinel network. We computed the distribution of age groups on a calendar year basis, following a process similar to that of the Sentinel network, with the aim of comparing both distributions.
To evaluate ILI detection by our system, we compared our weekly ILI incidence results with the weekly incidences rates from the reference Sentinel network by calculating the Pearson’s correlation coefficient (PCC) for the entire study period and for each winter season. For comparison purposes, we did the same comparison between weekly GFT estimates and weekly incidence rates from the Sentinel network.
ACCEPTED MANUSCRIPT
As an illustration of eHOP’s ability to monitor flu epidemic data, we also replicated the Serfling periodic regression analysis that is currently used by the Sentinel network to identify influenza epidemic periods [35]. We used the Sentinel’s R script, available at
http://marne.u707.jussieu.fr/periodic, and the parameters currently employed in routine practice by the Sentinel network [36]: a pruning threshold corresponding to the 85th quantile, a 95th
unilateral confidence interval to detect the start (when the observed data exceed this threshold for two consecutive weeks) and the end (when the observed data are below the threshold for two consecutive weeks) of ILI epidemics. We fitted the following linear regression model for the whole study period:
( ) ( ) ( ) ( ),
where µ is a constant, α a linear term, k the harmonic number, βk and γk are period terms. The
period T is equal to 52.18 weeks and k is equal to 2. The residual error corresponds to the ε(t) term.
We assessed the periodic regression performance by calculating the shift between the dates (start and end of epidemics) identified with eHOP estimates and the dates identified from Sentinel network estimates.
All analyses were performed using the R software, version 3.2.3 [37].
This study was approved by the local Ethics Committee of Rennes Academic Hospital.
3 Results
3.1 Information retrieval results
The study period included lists of patients retrieved from eHOP queries between September 1, 2010 and August 31, 2015. For this period, 14,873,482 documents were available in the eHOP CDW, as well as 2,220,741 patient visits. Performing the five eHOP queries and then processing the data to produce weekly ILI estimates took approximately 7 minutes (6m 30s for queries on unstructured data and 30s for queries on structured data) on a standard desktop computer. The “flu query” (the keyword “flu”, in the absence of “flu vaccination” and “avian flu”) retrieved 19,522 documents, among which there were 4,604 emergency reports (24%), 3,773 laboratory results (19.3%), 3,344 outpatient discharge summaries (17.1%), 2,882 inpatient discharge summaries (14.8%) and 798 DRGs (4%). The “symptoms query” (association of fever or pyrexia and ache or muscular pain) retrieved 2,916 documents, among which there were 1,436
ACCEPTED MANUSCRIPT
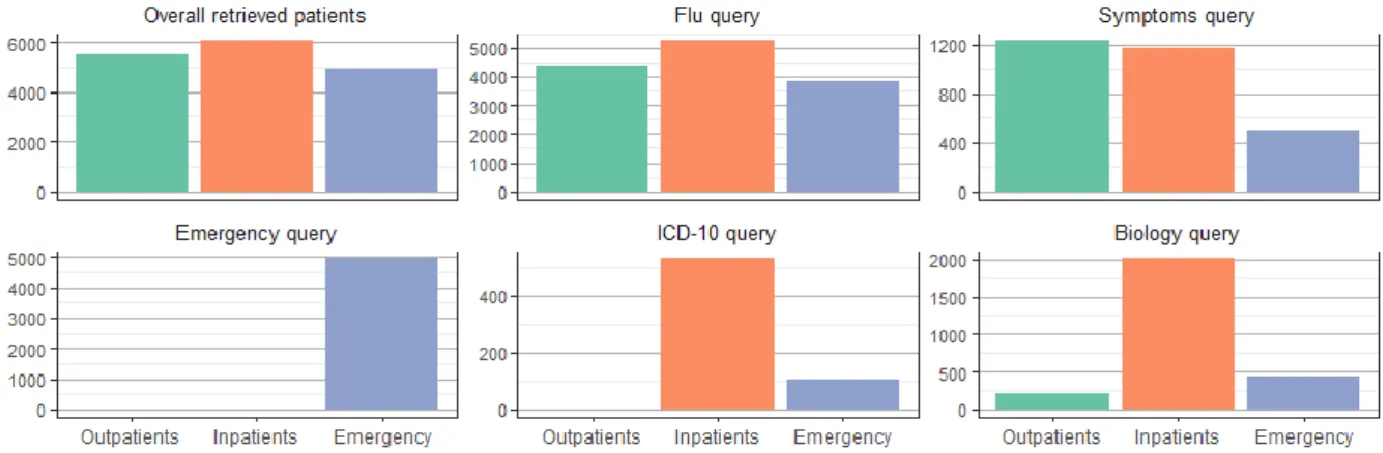
emergency room reports (49.2%), 524 outpatient discharge summaries (18%) and 482 inpatient discharge summaries (16.5%). The remaining documents were connected with unclear or missing document types. The last three queries were connected with specific types of documents, particularly with emergency reports, laboratory results or DRGs. The patients’ distribution according to the different settings (outpatients, inpatients and ED) is illustrated in Fig 1.
Fig 1 : Patients' settings.
Results from queries to retrieve patients with at least one document matching the following conditions: flu query = keyword “flu” in the absence of flu vaccination and avian flu; symptoms query = keywords “fever” or “pyrexia” and “ache” or “muscle pain”; emergency query = discharge summaries from the emergency department with “flu” as final diagnosis; ICD-10 query = DRGs with at least one code belonging to the ICD-10 chapters on influenza (i.e., J09.x, J10.x or J11.x.); biology query = PCR-based flu tests (negative or positive results).
Emergency defined a stay in the emergency department without further hospitalization.
3.2 Overall estimates
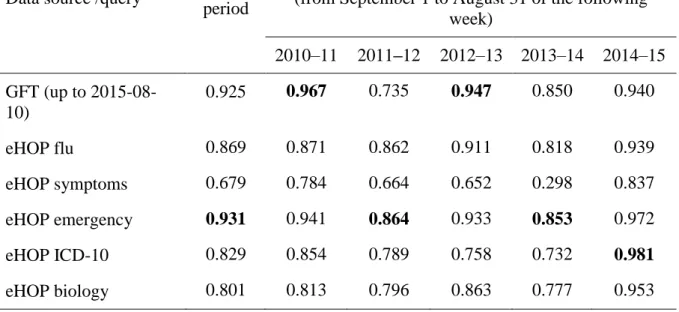
Weekly ILI estimates computed from the eHOP query results are displayed in Fig 2. During the entire study period, the ILI estimates retrieved from the query focused on ED data were the most highly correlated with the Sentinel Network’s (PCC of 0.931 compared with PCCs between 0.869 and 0.679 for other queries) (Table 1). As a comparison, the PCC for GFT with the Sentinel network was 0.925.
GFT was the data source that correlated most with the Sentinel network for the seasons 2010–11 and 2012–13 (PCC = 0.967 and 0.947, respectively). For the seasons 2011–12 and 2013–14, the eHOP query focused on EDs showed the highest correlation with the Sentinel network, but with a PCC below 0.9. For the season 2014–15, the eHOP ICD-10 query performed best, with a PCC of 0.981. The query based on symptoms was the only one with a PCC below 0.9 for this last season. For the 2013–14 flu season, both eHOP queries and GFT had PCC values below 0.9. The last complete season (2014–15) yielded the best correlations because all queries matched the Sentinel network data with PCC values up to 0.9, except for the symptoms query.
ACCEPTED MANUSCRIPT
Fig 2. Weekly influenza-like illness estimates from the different data sources and periods of detected epidemics.
The reference is data from the Sentinel network for the Brittany region. Estimates from Google Flu Trends are for comparison purposes. Black curves correspond to the estimates computed from the different data sources or queries. Red curves are the upper bound of the 95% prediction interval of the periodic regression models, computed using the Serfling method to determine epidemic periods. Green areas are periods that match the Sentinel network epidemic periods. Red areas are epidemic periods not detected from data sources or queries. Blue areas are detected periods that do not match true epidemics.
ACCEPTED MANUSCRIPT
Table 1. Pearson correlation coefficients between ILI activity estimates from eHOP queries or Google Flu Trends and ILI incidence rates from the Sentinel network.
Data source /query Entire period
Winter flu seasons
(from September 1 to August 31 of the following week) 2010–11 2011–12 2012–13 2013–14 2014–15 GFT (up to 2015-08-10) 0.925 0.967 0.735 0.947 0.850 0.940 eHOP flu 0.869 0.871 0.862 0.911 0.818 0.939 eHOP symptoms 0.679 0.784 0.664 0.652 0.298 0.837 eHOP emergency 0.931 0.941 0.864 0.933 0.853 0.972 eHOP ICD-10 0.829 0.854 0.789 0.758 0.732 0.981 eHOP biology 0.801 0.813 0.796 0.863 0.777 0.953
3.3 Sex and age group estimates
In the Sentinel network data, the male to female ratio was 1, 0.96, 0.97, 0.93 and 1.01, respectively, for epidemics from 2010 to 2014. In comparison, the sex ratio observed in eHOP queries ranged from 0.94 to 3.2 in 2010, from 1.07 to 1.90 in 2011, from 0.94 to 1.36 in 2012, from 1.02 to 1.78 in 2013 and from 0.92 to 1.16 in 2014. The highest sex ratio values were found in the results obtained with the biology query, indicating that PCR tests were more often performed for male patients. There was no significant difference in the age group distribution between male and female patients for the patients retrieved with this query (p = 0.41 using the Chi-square test).
Regarding the age group distribution, eHOP queries yielded more pediatric cases (0 to 4 years), compared with the Sentinel network data (Fig 3). The biology query retrieved more pediatric and elderly patients than the other queries.
ACCEPTED MANUSCRIPT
Fig 3. Age group distributions retrieved from the different eHOP queries.
Red bars show the age group distribution from the different eHOP queries. Green bars show the age group distribution from the Sentinel network.
P-values were calculated with the use of the Chi-square test or the Fisher exact test (indicated with an asterisk)
See legend to Fig 1 for a description of the eHOP queries.
3.4 Epidemic periods
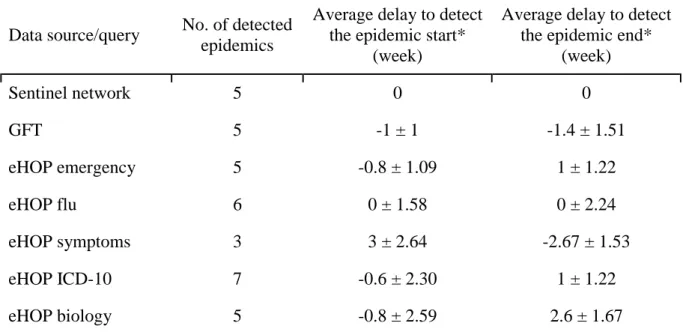
For each GFT and eHOP query, we computed a periodic regression model (i.e., Serfling regression model) to detect epidemic periods, as done by the Sentinel network’s current surveillance system (red line in Fig 2). We compared epidemic periods from GFT and eHOP with reference data from the Sentinel network for the region of Brittany (Table 2).
ACCEPTED MANUSCRIPT
Table 2. Summary of epidemic detection delays using the different data sources or queries
Data source/query No. of detected epidemics
Average delay to detect the epidemic start*
(week)
Average delay to detect the epidemic end*
(week) Sentinel network 5 0 0 GFT 5 -1 ± 1 -1.4 ± 1.51 eHOP emergency 5 -0.8 ± 1.09 1 ± 1.22 eHOP flu 6 0 ± 1.58 0 ± 2.24 eHOP symptoms 3 3 ± 2.64 -2.67 ± 1.53 eHOP ICD-10 7 -0.6 ± 2.30 1 ± 1.22 eHOP biology 5 -0.8 ± 2.59 2.6 ± 1.67
* Delays are related to epidemics overlapping with the true epidemic periods from the Sentinel network
GFT detected the beginning and the end of epidemics from 0 to 2 weeks before the Sentinel network. Among the different eHOP queries, the flu symptoms query yielded the worst results, particularly because it could not detect all epidemics. Laboratory and ICD-10 queries resulted in longer epidemics, particularly for the last two seasons: they anticipated the start of the two epidemics by 2 to 4 weeks and delayed the end by 2 to 5 weeks (Fig 2). The eHOP query on flu keywords and the emergency query gave the best results. Particularly, the emergency query detected the start of epidemics from 1 to 2 weeks before the Sentinel network, except in 2013, when there was a delay of one week. For the epidemic end, the emergency query tended to produce longer epidemics, ending 0 to 3 weeks after the Sentinel network’s estimates (Fig 2).
4 Discussion
This study demonstrates the great potential of HBD for monitoring flu epidemics. CDWs, such as eHOP, allow researchers to leverage the richness of heterogeneous clinical data from EHRs. eHOP added value is that it provides the possibility of querying both structured and unstructured data that appear to be great candidate data sources for efficient monitoring of diseases activity. However, as it is the case with every information retrieval system, part of the results yielded by our system corresponds to noise, that is, patients who do not have ILI. The
ACCEPTED MANUSCRIPT
result precision depends partly on the query used. For instance, the “symptoms” query is particularly subject to noise and thus, does not seem to be specific enough for ILI monitoring. It also depends on the type of queried data. Unstructured data are, of course, more prone to produce noisy results. The main reasons are the mentioning of a personal or family history of influenza and the exclusion of influenza diagnoses in discharge summaries, although our system has several natural language processing capabilities, such as detection of negative sentences. Structured data are less susceptible to noise: laboratory results or ICD-10 codes ascertain the fact that the patient has ILI. The drawback is the lack of recall for such data sources, for instance, during epidemics the severity of which does not lead to hospitalization (i.e., without diagnosis-related groups), or with diagnoses that do not require any laboratory test. Thus, we cannot control the performance of our information retrieval system. This can be seen as a limitation of our approach: we cannot validate every potential case retrieved by the system, and we cannot ensure the retrieval of all patients with ILI. We could have investigated the system precision because eHOP provides the possibility to access the original documents to check whether the retrieved patients truly had ILI. However, the purpose of this study was not to assess the performance of our information retrieval system, but to show that it can produce ILI activity indexes in the same way as internet-based monitoring. Hence, our system is not intended to be as reliable as a traditional monitoring system, such as the Sentinel network, for producing weekly incidence rates. Nevertheless, it provides a good picture of weekly ILI activity in primary care through the ED data and in hospitalized patients.
We believe that the strength of our system is its capability to generate near real-time estimates from hospital big data. Our estimates are generated using health care activity suspected of being connected with ILI and, due to the proximity to actual ILI cases, they could be more reliable than internet-based indexes. Indeed, we can produce estimates based on data connected with patients who presented symptoms severe enough to require visiting the ED or to be transferred to hospital. On the contrary, internet-based estimates may also incorporate data from healthy internet users who can potentially be influenced by the media or are simply searching information about influenza.
The possibility to produce a fine-grained description of the diseased population is an additional strength of our system. We demonstrated this potential for simple attributes (age groups and sex ratio) that were also available in the Sentinel network annual reports, for comparison purposes. This allowed showing some differences between the population coming to hospital and the population captured by the reference system. Our system found more pediatric and geriatric cases than the Sentinel network. Particularly, the younger cases may explain the predominance of male
ACCEPTED MANUSCRIPT
patients found with the PCR query because it seems than male patients are more prone to respiratory infectious diseases than female patients [38].
In addition, eHOP allows a better characterization of ILI patients by using the data available in the CDW, such as comorbidities or episode severity (e.g., requiring hospitalization or intensive care), all in near-real time.
However, one must be aware that the eHOP data loading process has various delays, depending on the data source. As a result, this process involves a high degree of heterogeneity in the availability of the data used to produce ILI estimates. For instance, discharge summaries are often generated several days after the patient’s stay, which is not compatible with real-time monitoring. Conversely, ED discharge summaries are produced during the patient’s visit and are made available as soon as the patient leaves the hospital or is transferred to a conventional unit. Similarly, laboratory results are produced during the patients’ stay. Therefore, these two data sources are available in the CDW with a lag of one day, because they are uploaded in eHOP every night.
Another of the system’s limitations is that we currently only have access to hospital data. This is the main cause of the differences in ILI activity compared with the Sentinel network. From the perspective of our hospital physicians working on infectious diseases this is not really a drawback, because the differences in duration and magnitude may reflect the severity of epidemics that cause more hospitalizations during a longer period. The higher estimates resulting from ICD-10 and laboratory queries also seem to be connected with more severe epidemics, as was the case in 2014–15. Moreover, local ILI activity estimates could be compared with other local indexes, such as the global hospital activity, bed occupation rates or average hospitalization length, to produce more appropriate estimates of the overcrowding risk. This is a key point for hospitals, as estimates from traditional surveillance systems do not allow them to anticipate overcrowding during severe epidemics, resulting in higher rates of hospitalization. However, we also produced estimates comparable to those of the Sentinel network, when using appropriate queries from the ED (PCC of 0.931) that correlated more closely with the Sentinel network estimates than any of the Google Correlate internet-based queries (the Google query most correlated with ILI activity from the Sentinel network for the region of Brittany and for our study period was “Tamiflu”, with a PCC of 0.9265).
In our study, we were limited to the population of Rennes academic hospital that, in addition, does not entirely cover the geographical territory of Brittany. As mentioned in the Introduction, the eHOP technology is going to be deployed in all academic hospitals of the West of France. By extending the study reach, we could obtain a complete view of influenza dynamics and activity at
ACCEPTED MANUSCRIPT
a larger scale. We also believe that our approach is transposable to other CDW technologies, such as the i2b2 standard [32], with appropriate real-time data integration. This could allow aggregating estimates from different institutions, using a SHRINE data sharing network at different scales [39]. Indeed, the SHRINE technology allows building a multi-node, peer-to-peer infrastructure for connecting i2b2 CDWs to research networks. We are also exploring this approach by feeding an i2b2 instance with limited sets (i.e., only patients retrieved through our queries) of structured data from eHOP. Another approach could be based on the OHDSI initiative that proposes a common data model for observational studies employing other standardization procedures [40]. However, we have not yet investigated this approach.
Finally, this study only gives the proof of concept concerning the HBD potential for ILI monitoring. The next step will be to assess eHOP prediction capabilities with appropriate statistical models, using such data to predict the data generated by the Sentinel network. Several models have been explored in previous studies with promising results. Recently, Harvard University proposed an alternative model to GFT also based on Google users’ activity [11]. Briefly, for each weekly ILI activity to be predicted, a model is built using predictors consisting of the 2-year history of the CDC ILI activity, submitted to an autoregressive process of order 52, and the 100 Google queries most highly correlated with the CDC ILI activity for the same period. The model uses a LASSO method to perform variable selections to only keep the most informative predictors. This kind of model could easily use our eHOP query results as covariates instead of internet-based data. Another interesting approach could be to build models that combine internet-based data and hospital data. Besides predicting ILI activity at a population level, we also want to assess whether our data can be used for predicting ED activity that might help to better manage issues connected with overcrowding. Our results also suggests that this approach could be used for monitoring the activity of other diseases that are emerging or that require precise follow-up, especially when the population is not yet worried about them.
5 Conclusions
Our study shows that HBD are a valuable data source for ILI activity monitoring. Specific data sources, such as laboratory results or DRGs, and the patient characteristics that are available in CDWs allow a fine description of epidemics. However, further investigation is necessary to assess the near real-time prediction capabilities of models that use such data sources, and to demonstrate its extensibility to other diseases.
ACCEPTED MANUSCRIPT
6 Acknowledgments
We would like to thank the French National Research Agency (ANR), for funding this work inside the INSHARE (INtegrating and Sharing Health dAta for Research) project (grant no. ANR-15-CE19-0024).
We thank our colleagues Eric Matzner-Lober from the University of Rennes 2, Jean-Marc Chapplain from the CHU of Rennes and the COREB from the French Infectious Diseases Society who provided insight and expertise that greatly assisted the research.
We also thank the French Sentinel network for making their data publicly available.
7 References
[1] L. Brammer, A. Budd, N. Cox, Seasonal and pandemic influenza surveillance considerations for constructing multicomponent systems, Influenza Other Respir. Viruses. 3 (2009) 51–58. doi:10.1111/j.1750-2659.2009.00077.x.
[2] J. Ginsberg, M.H. Mohebbi, R.S. Patel, L. Brammer, M.S. Smolinski, L. Brilliant, Detecting influenza epidemics using search engine query data, Nature. 457 (2009) 1012–1014. doi:10.1038/nature07634.
[3] O.M. Araz, D. Bentley, R.L. Muelleman, Using Google Flu Trends data in forecasting influenza-like–illness related ED visits in Omaha, Nebraska, Am. J. Emerg. Med. 32 (2014) 1016–1023. doi:10.1016/j.ajem.2014.05.052.
[4] J.-P. Chretien, D. George, J. Shaman, R.A. Chitale, F.E. McKenzie, Influenza Forecasting in Human Populations: A Scoping Review, PLOS ONE. 9 (2014) e94130. doi:10.1371/journal.pone.0094130.
[5] W.W. Thompson, L. Comanor, D.K. Shay, Epidemiology of Seasonal Influenza: Use of Surveillance Data and Statistical Models to Estimate the Burden of Disease, J. Infect. Dis. 194 (2006) S82–S91. doi:10.1086/507558.
[6] A.J. Valleron, E. Bouvet, P. Garnerin, J. Ménarès, I. Heard, S. Letrait, J. Lefaucheux, A computer network for the surveillance of communicable diseases: the French experiment, Am. J. Public Health. 76 (1986) 1289–1292.
[7] P.M. Polgreen, Y. Chen, D.M. Pennock, F.D. Nelson, R.A. Weinstein, Using Internet Searches for Influenza Surveillance, Clin. Infect. Dis. 47 (2008) 1443–1448. doi:10.1086/593098.
[8] R. Chunara, S. Aman, M. Smolinski, J.S. Brownstein, Flu Near You: An Online Self-reported Influenza Surveillance System in the USA, Online J. Public Health Inform. 5 (2013). http://www.ncbi.nlm.nih.gov/pmc/articles/PMC3692780/ (accessed August 1, 2016).
[9] L. Josseran, J. Nicolau, N. Caillère, P. Astagneau, G. Brücker, Syndromic surveillance based on emergency department activity and crude mortality: two examples, Euro Surveill. Bull. Eur. Sur Mal. Transm. Eur. Commun. Dis. Bull. 11 (2006) 225–229.
[10] D.A. Broniatowski, M.J. Paul, M. Dredze, National and Local Influenza Surveillance through Twitter: An Analysis of the 2012-2013 Influenza Epidemic, PLOS ONE. 8 (2013) e83672. doi:10.1371/journal.pone.0083672.
ACCEPTED MANUSCRIPT
[11] S. Yang, M. Santillana, S.C. Kou, Accurate estimation of influenza epidemics using Google search data via ARGO, Proc. Natl. Acad. Sci. U. S. A. 112 (2015) 14473–14478. doi:10.1073/pnas.1515373112.
[12] A.F. Dugas, M. Jalalpour, Y. Gel, S. Levin, F. Torcaso, T. Igusa, R.E. Rothman, Influenza Forecasting with Google Flu Trends, PLOS ONE. 8 (2013) e56176. doi:10.1371/journal.pone.0056176.
[13] D.R. Olson, K.J. Konty, M. Paladini, C. Viboud, L. Simonsen, Reassessing Google Flu Trends Data for Detection of Seasonal and Pandemic Influenza: A Comparative Epidemiological Study at Three Geographic Scales, PLOS Comput Biol. 9 (2013) e1003256. doi:10.1371/journal.pcbi.1003256.
[14] M.J. Paul, M. Dredze, D. Broniatowski, Twitter Improves Influenza Forecasting, PLoS Curr. 6 (2014). doi:10.1371/currents.outbreaks.90b9ed0f59bae4ccaa683a39865d9117. [15] D.A. Broniatowski, M.J. Paul, M. Dredze, National and Local Influenza Surveillance
through Twitter: An Analysis of the 2012-2013 Influenza Epidemic, PLOS ONE. 8 (2013) e83672. doi:10.1371/journal.pone.0083672.
[16] K.S. Hickmann, G. Fairchild, R. Priedhorsky, N. Generous, J.M. Hyman, A. Deshpande, S.Y.D. Valle, Forecasting the 2013–2014 Influenza Season Using Wikipedia, PLOS Comput Biol. 11 (2015) e1004239. doi:10.1371/journal.pcbi.1004239.
[17] N. Generous, G. Fairchild, A. Deshpande, S.Y.D. Valle, R. Priedhorsky, Global Disease Monitoring and Forecasting with Wikipedia, PLOS Comput Biol. 10 (2014) e1003892. doi:10.1371/journal.pcbi.1003892.
[18] D.J. McIver, J.S. Brownstein, Wikipedia Usage Estimates Prevalence of Influenza-Like Illness in the United States in Near Real-Time, PLOS Comput Biol. 10 (2014) e1003581. doi:10.1371/journal.pcbi.1003581.
[19] D. Lazer, R. Kennedy, G. King, A. Vespignani, The Parable of Google Flu: Traps in Big Data Analysis, Science. 343 (2014) 1203–1205. doi:10.1126/science.1248506.
[20] D. Butler, When Google got flu wrong, Nature. 494 (2013) 155–156. doi:10.1038/494155a. [21] A.F. Dugas, Y.-H. Hsieh, S.R. Levin, J.M. Pines, D.P. Mareiniss, A. Mohareb, C.A.
Gaydos, T.M. Perl, R.E. Rothman, Google Flu Trends: Correlation With Emergency Department Influenza Rates and Crowding Metrics, Clin. Infect. Dis. 54 (2012) 463–469. doi:10.1093/cid/cir883.
[22] N.G. Weiskopf, C. Weng, Methods and dimensions of electronic health record data quality assessment: enabling reuse for clinical research, J. Am. Med. Inform. Assoc. 20 (2013) 144– 151. doi:10.1136/amiajnl-2011-000681.
[23] C. Saez, M. Robles, J.M. Garcia-Gomez, Stability metrics for multi-source biomedical data based on simplicial projections from probability distribution distances, Stat. Methods Med. Res. (2014). doi:10.1177/0962280214545122.
[24] W. Raghupathi, V. Raghupathi, Big data analytics in healthcare: promise and potential, Health Inf. Sci. Syst. 2 (2014) 3.
[25] S.-Y. Shin, W.S. Kim, J.-H. Lee, Characteristics Desired in Clinical Data Warehouse for Biomedical Research, Healthc. Inform. Res. 20 (2014) 109–116. doi:10.4258/hir.2014.20.2.109.
[26] J.-M. Pinon, S. Calabretto, L. Poullet, Document Semantic Model: an experiment with patient medical records., in: ELPUB, 1997. http://elpub.scix.net/data/works/att/97124.content.pdf (accessed April 21, 2015).
[27] D.A. Hanauer, EMERSE: The Electronic Medical Record Search Engine, AMIA. Annu. Symp. Proc. 2006 (2006) 941.
[28] S.N. Murphy, M.E. Mendis, D.A. Berkowitz, I. Kohane, H.C. Chueh, Integration of Clinical and Genetic Data in the i2b2 Architecture, AMIA. Annu. Symp. Proc. 2006 (2006) 1040.
ACCEPTED MANUSCRIPT
[29] J. Rogers, C. Puleston, A. Rector, The CLEF Chronicle: Patient Histories Derived from Electronic Health Records, in: 22nd Int. Conf. Data Eng. Workshop 2006 Proc., 2006: pp. x109–x109. doi:10.1109/ICDEW.2006.144.
[30] H.J. Lowe, T.A. Ferris, P.M. Hernandez, S.C. Weber, STRIDE – An Integrated Standards-Based Translational Research Informatics Platform, AMIA. Annu. Symp. Proc. 2009 (2009) 391–395.
[31] M. Cuggia, N. Garcelon, B. Campillo-Gimenez, T. Bernicot, J.-F. Laurent, E. Garin, A. Happe, R. Duvauferrier, Roogle: an information retrieval engine for clinical data warehouse, Stud. Health Technol. Inform. 169 (2011) 584–588.
[32] S.N. Murphy, G. Weber, M. Mendis, V. Gainer, H.C. Chueh, S. Churchill, I. Kohane, Serving the enterprise and beyond with informatics for integrating biology and the bedside (i2b2), J. Am. Med. Inform. Assoc. 17 (2010) 124–130. doi:10.1136/jamia.2009.000893. [33] R.W. Majeed, R. Röhrig, Automated realtime data import for the i2b2 clinical data
warehouse: introducing the HL7 ETL cell, Stud. Health Technol. Inform. 180 (2012) 270– 274.
[34] C. Jaglin-Grimonprez, Organiser, moderniser, innover : quelles avancées pour les patients, (2015). http://social-sante.gouv.fr/IMG/pdf/tr2_colloque-5_jaglin_20151016.pdf (accessed May 18, 2016).
[35] R.E. Serfling, Methods for current statistical analysis of excess pneumonia-influenza deaths, Public Health Rep. 78 (1963) 494–506.
[36] C. Pelat, P.-Y. Boëlle, B.J. Cowling, F. Carrat, A. Flahault, S. Ansart, A.-J. Valleron, Online detection and quantification of epidemics, BMC Med. Inform. Decis. Mak. 7 (2007) 29. doi:10.1186/1472-6947-7-29.
[37] R Core Team, R: A Language and Environment for Statistical Computing, R Foundation for Statistical Computing, Vienna, Austria, 2015. https://www.R-project.org.
[38] M. Muenchhoff, P.J.R. Goulder, Sex Differences in Pediatric Infectious Diseases, J. Infect. Dis. 209 (2014) S120–S126. doi:10.1093/infdis/jiu232.
[39] G.M. Weber, S.N. Murphy, A.J. McMurry, D. MacFadden, D.J. Nigrin, S. Churchill, I.S. Kohane, The Shared Health Research Information Network (SHRINE): A Prototype Federated Query Tool for Clinical Data Repositories, J. Am. Med. Inform. Assoc. 16 (2009) 624–630. doi:10.1197/jamia.M3191.
[40] G. Hripcsak, J.D. Duke, N.H. Shah, C.G. Reich, V. Huser, M.J. Schuemie, M.A. Suchard, R.W. Park, I.C.K. Wong, P.R. Rijnbeek, J. van der Lei, N. Pratt, G.N. Norén, Y.-C. Li, P.E. Stang, D. Madigan, P.B. Ryan, Observational Health Data Sciences and Informatics (OHDSI): Opportunities for Observational Researchers, Stud. Health Technol. Inform. 216 (2015) 574–578.