The Design of a Microfabricated Air Electrode for
Liquid Electrolyte Fuel Cells
Fritz Pierre, Jr.
S.B., Massachusetts Institute of Technology (2000) Submitted to the Department of Mechanical Engineering In partial fulfillment of the requirement for the degree of
Doctor of Philosophy at the
MASSACHUSETTS INSTITUTE OF TECHNOLOGY Septem ber 2007
© 2007 Massachusetts Institute of Technology All rights reserved
~
Signature redacted
IJAN
0
3 2008
ILIBRARIES
Signature of Author ---,1'. ---'ZJ"'7\---D--e-p.;;....~-rt-m-e-n-?of--:::z:of~M"----ec-h-a-n-ic-a-I E-n-g-i-ne-e-n-Ong August 24, 2007Signature redacted
Certifiedby _ _ _ _ ~ ___ ~~~~ ______________________ _ Ernest Cravalho Professor, Department of Mechanical Engineering.JI.
Signature redacted
Accepted by _ _ _ _ _ _ _ _ _ _ _ _ _ _ _ ----IL' ________ ---'", ________ _
Lallit Anand Chairman, Department Committee on Graduate Studies
The Design of a Microfabricated Air Electrode for Liquid Electrolyte Fuel cells
by
Fritz Pierre, Jr.
Submitted to the Department of Mechanical Engineering on August 24, 2007 in Partial Fulfillment of the Requirements of the Degree of Doctor of Philosophy in
Mechanical Engineering
ABSTRACT
In this dissertation, the microfabricated electrode (MFE) concept was applied to the design of an air electrode for liquid electrolyte fuel cells. The catalyst layer of the electrode is envisioned to be fabricated by using a microfabricated die to apply a three-dimensionally patterned macro-texture upon a microporous carbon matrix. The resulting dual porosity structure consists of an array of cylindrical holes that are formed from the die and micropores present in the carbon matrix. The holes are used for gas transport while the micropores are saturated with a liquid electrolyte for ion transport. The catalyst is loaded into the
microfabricated structure by electrodepositing thin catalyst films within the cylindrical holes. In this dissertation, three issues concerning the design of the MFE were investigated:
1) identification of the best material to use for the microporous carbon matrix, 2) the study of
electrokinetic parameters of electrodeposited Pt films, and 3) the study of oxygen transport behavior within a Pt film supported on the surface of a microporous carbon matrix.
Two types of polymer-bonded carbon materials have been identified as suitable materials for the carbon matrix. They are carbon black particles bonded into a microporous matrix either by polytetrafluoroethylene (PTFE) fibrils or by polyethersulfone (PES), which is a soluble polymer in common solvents. Experiments and modeling have indicated that these materials will allow the microfabricated catalyst layer to have an effective ionic
conductivity that is 4 to 5 times greater than the conventional catalyst layer.
Rotating disk electrode experiments on electrodeposited Pt films in 0.5 M sulfuric acid show that these films have an oxygen reduction reaction mass activity that is 2.5 times greater than that of Pt particles supported on carbon black. Furthermore, oxygen gain
experiments on electrodeposited Pt films supported on a microporous membrane indicate that these films experienced no oxygen transport losses in air, up to a current density of 130 mA/cm2. These results strongly support the use of thin catalyst film technology in catalyst
layers of fuel cells.
The experimental results presented this dissertation were used to develop a half-cell model of the MFE in concentrated phosphoric acid. The results of the model suggest that the MFE is capable of producing a current density 3.5 times greater than that of the conventional electrode. It is believed that such potential improvements in the performance of the air electrode support continued efforts to fabricate and test the MFE design concept presented in this dissertation.
Thesis Supervisor: Ernest G. Cravalho Title: Professor of Mechanical Engineering
Acknowledgments
"I can do all thing through Christ which strengtheneth me." Phillipians 4:13
I begin by recognizing that Jesus Christ made this doctoral thesis possible. I thank Professor Ernest G. Cravalho, my advisor, who provided me the
opportunity to pursue my doctoral studies at MIT. He began believing in me when I was a sophomore in college and remained supportive during the most challenging times of my doctoral studies.
I thank my committee members: Professor John G. Brisson, II and Professor Yang Shao-Horn. Professor Brisson was kind to provide me with several teaching assistant positions while I completed my work. Professor Shao-Horn allowed me the use of her lab space; without which many of my experiments would not have been possible.
I thank my friends. I am extremely grateful for their support, encouragement, and advice. I am especially grateful for my friends in the Fuel Cell and Cryogenic labs over the years: Derya, Franklin, Gunaranjan, Joanie, Justin, Matt, Rory, Sophie, Theresa, and Wayne. Over the years, they made old Building 41 tolerable. They made MIT a great place to work. My thanks also extend to students in the EEL Lab, especially G.J. and Simcha, who helped me with my SEM pictures that are presented in this dissertation. I thank my very best friends during my graduate years at MIT: Andre, Ayanna, Danielle, Denzil, Eric, Jeremy, Sean, and Todd. They made MIT fun and made me smile during the hardest of times.
I thank my family: my mom, sister, aunts, uncles, and cousins. I also thank my in-laws. They never stopped praying for and encouraging me.
Lastly, but certainly not the least, I thank my wonderful, beautiful wife Mrs. Brandice Pierre. Throughout my time at MIT, she helped me to become a better student, man, and husband. She kept me centered and focused. Without her strength, fearless support, patience, and love, I would not be the person I have become today. To her, I dedicate this dissertation.
Table of Contents
List of Figures... 10 List of Tables... 20 A cronym s... 21 Chapter 1: Introduction... 24 1.1 Motivation... 24 1.2 Research Objectives... 26 1.3 Thesis Organization... 29 References... 32Chapter 2: A Brief Review of Fuel Cell Technology... 33
2.1 What is a Fuel Cell... 33
2.2 Types of Fuel Cells... 38
2.2.1 High Temperature Fuel Cells (>600*C)... 39
2.2.2 Low Temperature Fuel Cells (<220*C)... 40
2.3 Advantages of Fuel Cells... 44
2.4 Disadvantages of Fuel Cells... 46
2.5 Thermodynamics of Fuel Cells... 48
2.5.1 Control Volume Analysis... 48
2.5.2 Efficiency of Fuel Cell System... 52
2.5.3 Reversible Electrode Potential... 55
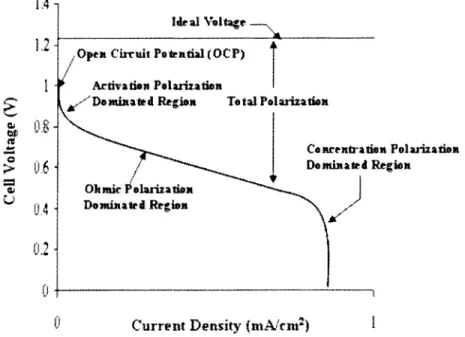
2.6 Performance of Fuel Cells... 59
2.6.1 Activation Polarization... 61
2.6.2 Ohmic Polarization... 64
2.6.3 Concentration Polarization... 66
Chapter 3: Review of Electrode Designs and Presentation of Microfabricated
Electrode Design Concept... 72
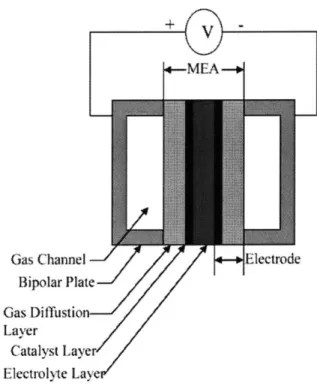
3.1 Membrane Electrode Assembly... 72
3.1.1 Introduction... 72
3.1.2 Catalyst Layer... 74
3.1.3 Gas Diffusion Lyaer... 75
3.2 Electrode Design for Liquid Electrolyte Fuel Cells... 77
3.2.1 Porous Carbon Electrode (PCE) Technology... 77
3.2.2 Advantages and Disadvantages of PCE Design... 80
3.2.3 Two Improved PCE Fabrication Concepts... 85
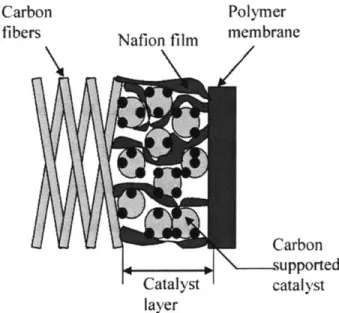
3.3 Electrode Design for Polymer Electrolyte Fuel Cells... 87
3.3.1 Thin Film Carbon Electrode (TFCE) Technology... 87
3.3.2 Gas Diffusion Layer... 89
3.3.3 Advantages of TFCE Technology... 91
3.3.4 Novel Catalyst Layer Fabrication Concepts... 92
3.4 Microfabricated Electrode (MFE) for Liquid Electrolyte Fuel Cells... 96
3.4.1 Novel Electrode Design Concept of this Dissertation... 96
3.4.2 Advantages of Microfabricated Electrode Design...102
3.4.3 Fabrication of MFE Catalyst Layer... 106
R eferences...11
Chapter 4: The Preparation and Characterization of Polymer-Bonded Microporous Membranes...115
4.1 Introduction...115
4.2 Membrane Preparation and Observations...118
4.2.1 PTFE-Bonded Microporous Membranes...118
4.2.2 PES-Bonded Microporous Membranes... 129
4.3 Experimental Procedure...138
4.3.1 Porosity...138
4.3.2 Breakthrough Capillary Pressure and Saturation...140
4.3.4 Ionic Conductivity... 147
4.3.5 Electronic Conductivity... 152
4.4 Results and Discussion... 154
4.4.1 Porosity... 154
4.4.2 Breakthrough Capillary Pressure and Saturation...159
4.4.3 Permeability... 167
4.4.4 Ionic Conductivity... 177
4.4.5 Electronic Conductivity... 184
4.5 Conclusion... 187
R eferences...191
Chapter 5: A Rotating Disk Electrode Study of the Oxygen Reduction Reaction on Thin Platinum Films Electrodeposited on Glassy Carbon... 196
5.1 Introduction...196
5.2 Theory and Background...199
5.2.1 The Kinetics of Oxygen Reduction Reaction (ORR) on Pt...199
5.2.2 Electrochemistry of Pt Electrodeposition... 210
5.2.3 Rotating Disk Electrode (RDE)...217
5.2.4 Cyclic Voltammetry (CV) and Linear Sweep Voltammetry (LSV)...223
5.3 Experimental Procedure and Setup...231
5.3.1 Cleaning of Glassware and Electrode...231
5.3.2 Electrodes and Instruments...232
5.3.3 Electrodeposition of Pt Films...235
5.3.4 Voltammetry...236
5.3.5 Rotating Disk Electrode (RDE)...237
5.4 Results and Discussion... 238
5.4.1 Electrodeposition of Pt Films onto a Glassy Carbon Substrate...238
5.4.2 Cyclic Voltammograms of DPS Deposited Pt Films...252
5.4.3 Specific Area of Electrodeposited Pt Films...256
5.4.4 Oxygen Reduction Reaction on DPS Deposited Pt Films...262
5.5 Conclusion...287
References...290
Chapter 6: Oxygen Gain Measurements on Thin Platinum Films Electro-deposited on PTFE-Bonded Microporous Membranes...298
6.1 Introduction...298
6.2 Theory of Oxygen Gain... 300
6.3 Experimental...304
6.3.1 Experimental Setup...304
6.3.2 Experimental Procedure...307
6.4 Results and Discussion... 292
6.4.1 Electrodeposition of Pt Films onto Porous Carbon Membrane... 315
6.4.2 Cyclic Voltammograms of Membranes...324
6.4.3 Cyclic Voltammograms of Pt Films... 328
6.4.4 Specific Area of Electrodeposited Pt Films...332
6.4.5 Oxygen Gain of Pt Films... 335
6.5 Conclusion... 346
References... 349
Chapter 7: 1-D Model of the Microfabricated Electrode (MFE)...351
7.1 Introduction...351
7.2 Description of System...351
7.3 Mathematical Model...354
7.3.1 Backing Layer and Diffusion Layer... 354
7.3.2 Catalyst Layer...358
7.3.3 Matrix Layer... 365
7.3.4 Method of Solution... 366
7.4 Results and Discussion... 368
7.4.1 Catalyst Layer Optimization...368
7.4.2 Electrode Performance...376
R eferences...380
Chapter 8: Summary and Recommendations for Future Work...381
8.1 Identification of the Best Material to use for the Porous Carbon Matrix of the Catalyst Layer... 382
8.1.1 Summary...382
8.1.2 Future Work...384
8.2 The Study of the Electrokinetic Behavior of Electrodeposited Pt Films...384
8.2.1 Summary...384
8.2.2 Future Work... 387
8.3 The Study of Oxygen Transport Behavior Within a Pt Film Supported on a Microporous Membrane...387
8.2.1 Summary...387
8.2.2 Future Work...389
Appendix A:...390
Appendix B: The Preparation and Characterization of Carbon Aerogel Membranes and the Preparation of Carbon Aerogel Catalyst Layers...394
B.1 Carbon Aerogel Background... 394
B.2 Surfactant in Aerogel Fabrication... 399
B.3 Carbon Aerogel Membrane Preparation... 401
B.4 Carbon Aerogel Membrane Properties...403
B.5 Microfabricated Carbon Aerogel Catalyst Layer... 408
R eferences...411
Appendix C: Oxygen Gain Model's MATLAB Scripts... ... ..412
List of Figures
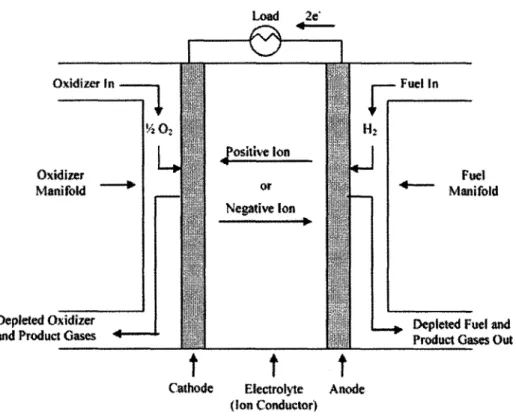
Figure 2-1: Figure 2-2: Figure 2-3: Figure 2-4: Figure 2-5: Figure 2-6: Figure 2-7: Figure 2-8: Figure 2-9: Figure 2-10: Figure 3-1: Figure 3-2: Figure 3-3: Figure 3-4: Figure 3-5: Figure 3-6: Figure 3-7:Fuel cell diagram... 34
Fuel cell stack... 36
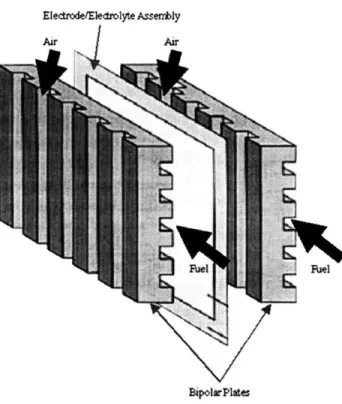
Fuel cell assembly with bipolar plates... 37
UTC's "ribbed substrate" stack design... 38
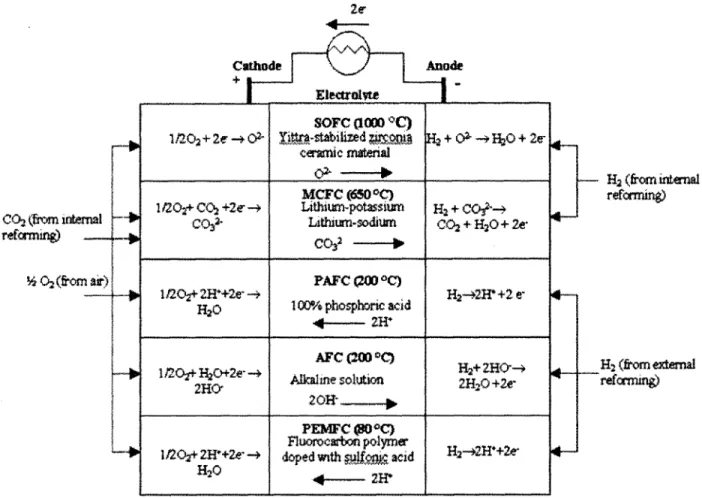
Types of fuel cells... 39
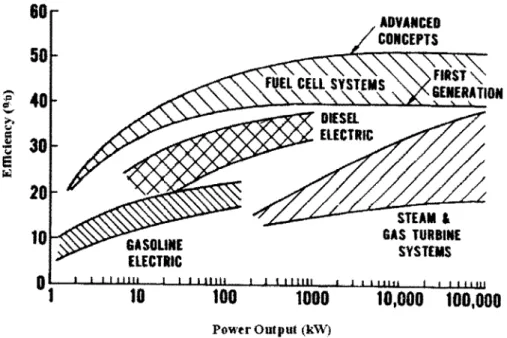
A comparison of the efficiency of power systems... 46
Control volume boundary of fuel cell... 49
Reversible fuel cell and reversible heat engine... 52
The dependence of reversible fuel cell potential on temperature... 58
Fuel cell performance curve... 59
Schematic of a typical membrane electrode assembly (MEA)... 73
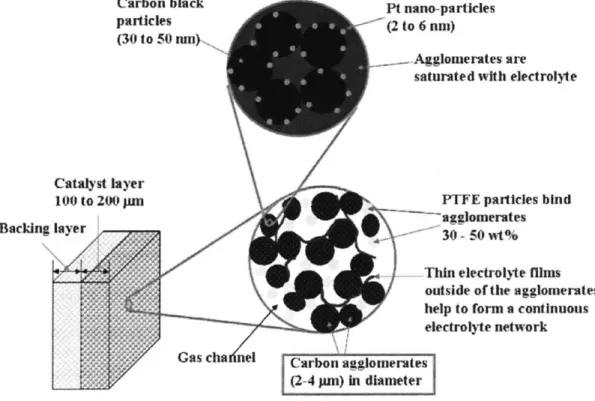
Polymer-bonded electrode: a) gas side, b) hydrophobic backing layer, c) catalyst layer, d) electrolyte, e) PTFE-bonded catalyst support, f) diffusion sublayer, g) PTFE particle, h) gas channels, I) electrolyte film, K) catalyst, 1) micro- and mesopores... 77
Illustration of carbon agglomerates within catalyst layer of PCE... 82
Simulated performance curve of air-electrode for PAFC. Parameters of the model were obtained from referenced. The ideal electrode performance curve is simply the Tafel plot. Ideal electrode operates only under kinetic control... 84
Schematic of an MEA for a PEMFC... 88
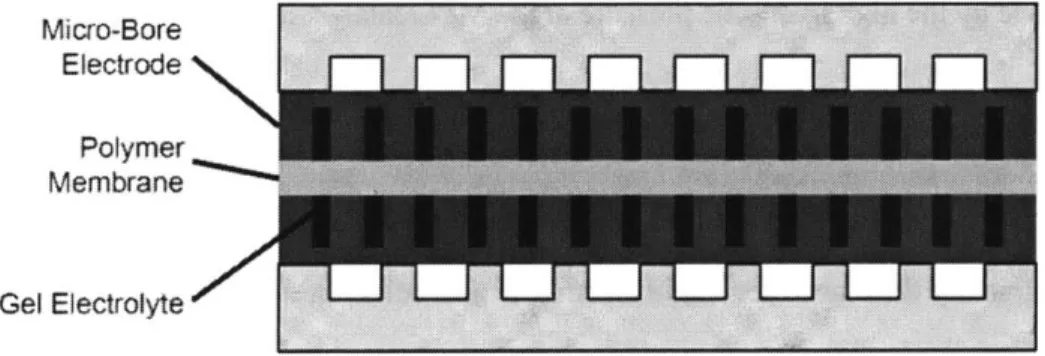
Micro-bore electrodes with gel electrolyte... 92
SEM images of typical NSTF catalyst as fabricated on microstructured catalyst transfer substrate, seen (left) in cross-section with original magnification of x10,000, and (right) in plane view with original magnification of x50, .. ... 94
Figure 3-8: Figure 3-9: Figure 3-10: Figure 3-11: Figure 3-12: Figure 3-13: Figure 3-14: Figure 3-15: Figure 4-1: Figure 4-2: Figure 4-3: Figure 4-4: Figure 4-5: Figure 4-6: Figure 4-7: Figure 4-8:
SEM image of an NSTF catalyst electrode layer after transfer to the surface of the PEM. The image shows the catalyst layer
thickness is less than 0.3 pm... 95
Front view of MFE catalyst layer. The porous carbon matrix can be made from carbon black bonded with a polymer... 97
Side view of MFE design concept along with other cell components. Illustration is not drawn to scale... 98
Transport in MFE catalyst layer of an acid-type fuel cell... 101
Illustration of one possible fabrication process for MFE...106
Silicon die made by deep reactive ion etching...108
(a) Image of "nanocandles" produced by Prof. Kim's group here at MIT. Nanocandles are 20 gm in diameter and 110 pm in height. SU-8 2075 with oxygen plasma etching was used to fabricate nanocandles. (b) Image of square poles with a square dimension of 10 pm and a height of 50 pm. SU-8 2000 was used to make these poles...109
SEM of pillars formed by the microreplication process of the Avery Dennison Company...109
Carbon black powder and dough... 123
SEM image of the surface of a slice from the dough (XC72/15 wt% PTFE)... 124
SEM image of the surface of a 15 wt% PTFE-bonded membrane...125
SEM images of the surface of membranes with 5, 10, and 15 wt% PTFE ... 127
Flexible PTFE-bonded membrane...128
Polyethersulfone fundamental repeating unit... 129
SEM images of PES-bonded membranes with 20, 25, 30, 40 wt% of PE S... 136
Schematic of half-cell apparatus for breakthrough pressure Experim ents... 141
Figure 4-9: Figure 4-10: Figure 4-11: Figure 4-12: Figure 4-13: Figure 4-14: Figure 4-15: Figure 4-16: Figure 4-17: Figure 4-18: Figure 4-19: Figure 4-20: Figure 4-21: Figure 4-22: Figure 4-23: Figure 4-24: Figure 4-25: Figure 4-26: Figure 4-27:
Schematic of half-cell membrane holder... 142
Picture of the falling-head permeameter...145
Schematic of the membrane holder of the permeameter... 146
Schematic and picture of ionic conductivity experimental setup... 148
Schematic of the conductivity cell...150
Pictures of the four-point electronic conductivity tester...153
Plots of the porosity of polymer-bonded membranes made from XC72 carbon black verses their polymer wt%... 155
Plots of the porosity of the PTFE-bonded membranes made with XC72 and XC72R carbon black. Plot of the porosity of PES-bonded membranes made with XC72 carbon black... 156
Initial breakthrough pressure (IBP) and repeating breakthrough pressure (RBP) of polymer-bonded membranes...161
Saturation of polymer-bonded membranes after repeating breakthrough pressure...166
A plot ln
(h/h
0)vs.t
from the falling-head permeameter for a 15 wt% PTFE membrane (volume fraction: 77.8%)... 169Permeability of PTFE-bonded membranes...169
Permeability of PES-bonded membranes... 170
SEM image of the microporous layer of the GDL LT 1400-W layer from E-TEK ... 175
Potential vs. time plots for ionic conductivity experiments (solid line: with membrane, dash line: without membrane)...177
Potential vs. current plots from ionic conductivity experiment...181
Effective ionic conductivity of polymer-bonded membranes...182
Current vs. potential plot from electronic conductivity experiment, 10 wt% PTFE-bonded membrane with XC72 carbon black...185
Figure 5-1: Figure 5-2: Figure 5-3: Figure 5-4: Figure 5-5: Figure 5-6:: Figure 5-7: Figure 5-8: Figure 5-9: Figure 5-10:
Catalytic activity of Pt nanoparticles versus the Pt specific area in concentrated phosphoric acid...206 TEM image of Pt particle and an illustration of the cubo-octahedral Shape...208 Graph (A) superimposed plots of specific area for oxygen
reduction and SAD(1 00) as function of particle size: (Solid line) SAD(100); (a) (shaded circles), 98% H3PO4 at 180*C; (b) (open
circles), 0.5 M H2S04 at 25*C; and (c) (open squares), 97% H3P04 at 177*C. Graph (B) Superimposed plots of mass activity and MAD(100) as function of particle size: (Solid line) MAD(100); (a) (shaded circles), 98% H3PO4 at 180*C; (b) (open circles), 0.5 M
H2S0 4 at 250C; and (c) (open squares), 97% H3PO4 at 177*C...209
Plots of specific area of Pt films vs. Pt loading from various
published references...212 Cyclic voltammograms recorded on a graphite substrate in a 1 mM
solution of H 2PtCl6... .. . .. . . .. . . . .. . .. . ... . . . .. . . .214
Schematic of a typical rotating disk electrode setup...218 Cyclic voltammogram of polycrystalline Pt in 0.5 M H2SO4... . . . . ...224
Cyclic voltammograms of polycrystalline Pt in pure 0.5 M H2SO4
and in 0.5 M H2SO4+ 10-5 M KCL, the CV in the KCL containing
solution is referred to as the contaminated CV...229 Cyclic voltammograms of polycrystalline Pt in pure 0.5 M H2S04
at a rotation rate of 0 and 2000 rpm, the figure shows negligible
difference between the two voltammograms...230 Glassy carbon working electrode in E4 Series ChangDisk RDE tip from the Pine Instrument Company...233 Figure 5-11: Current vs. time transient response for Pt film electrodeposited by
Figure 5-12:
Figure 5-13: Figure 5-14:
a single potential step from the 0.8 V to 0.1 V... 239 (i / ,, versus t /t,,, analysis of transient response shown in
Figure 5-11, im= 6.96 x 1 0-4 A/cm2 and tm= 10.54 sec...242 SEM image of Pt particles produced during the SPS deposition...243 SEM image of Pt particles produced during the SPS deposition,
Figure 5-15: Figure 5-16: Figure 5-17: Figure 5-18: Figure 5-19: Figure 5-20: Figure 5-21: Figure 5-22: Figure 5-23: Figure 5-24: Figure 5-25: Figure 5-26: Figure 5-27: Figure 5-28:
Current vs. time transient response recorded after the second step
of the DPS deposition... 248 Plot of current vs. time-0.5 for the transient response given in
Figure 5-15...248 SEM image of Pt film produced from the DPS deposition...250 Cyclic voltammograms of glassy carbon surface freshly polished
with no Pt (Titled: Clean glassy carbon) and the glassy carbon electrode after a potential hold at -0.2 V for 1 second in the
deposition solution (Titled: Nucleation layer)...251 Cyclic voltammograms for different loadings of DPS
electrodeposited Pt films. The loadings are 9.89, 19.2, 39.97, and 60.54 pLg/cm2. A larger loading produced larger hydrogen
adsorption/desorption charge...253 Plots of the specific area vs. Pt loading for films electrodeposited by the DPS and SPS deposition techniques. Included is the
specific area vs. Pt loading plot for sputter deposited films... 256 Plots of Ap, vs. Pt I for Pt films deposited by the DPS and SPS
deposition techniques of this work and the sputter deposited films... 260 Potentiodynamic curves for the 39.97 jig/cm2 Pt film deposited by
the DPS deposition technique. The potentiodynamic scans were taken during electrode rotation at 500, 750, 1000, 2000, 2500, and 3500 rpm. The limiting current increases with an increase in the
rpm ... 263 Levich plot of the potentiodynamics scans shown in Figure 5-22...265 Koutechy-Levich plots of some of the data from the
potentiodynamics scans shown in Figure 5-22...266 Diffusion-corrected Tafel slope of 39.97 pg/cm2 Pt film with and
without adsorbed chloride atoms...268 Plot of kinetic current density at 0.9 V versus Pt loading for DPS electrodeposited Pt films...272 Mass activity at 0.9 V versus Pt loading for DPS electrodeposited Pt film s...274
The open circuit potential versus Pt loading for DPS electrodeposited
Figure 5-29: Figure 5-30: Figure 5-31: Figure 5-32: Figure 6-1: Figure 6-2: Figure 6-3: Figure 6-4: Figure 6-5: Figure 6-6: Figure 6-7: Figure 6-8:
(a) Plot of exchange current density vs. the angle of the surface with respect to the Pt(1 11) surface in (shaded squares) 0.5 M H2SO4 and
(open circles) 0.1 M HC10 4. (b) Plot of E12 for oxygen reduction vs.
step density at rotation rates of 1600rpm in (shaded
squares) 0.5 M H2SO4 and (open circles) 0.1 M HC104... . .. . . . .. . ..279
The ORR specific activities of polycrystalline Pt (shown at "0 m2/gpt"), Pt-black (data at ca. 5 m2/gpt), and Pt/C catalysts at 0.9 V and 60 *C. Activities determined via RDE measurements in 02
saturated 0.1 M HC104. The potentiodynamic curves were obtained from positive-going sweeps at 20 mV/s, going from 0 to
1.0 V (RH E)...281 Linear sweep voltammograms of the DPS electrodeposited Pt films.
Pt loading: 9.89, 19.2, 30.36, 39.97, and 60.54 pg/cm2, peak
increases with increase in loading...285 Hydroxyl atom coverage versus the Pt loading for DPS
electrodeposited films...286 Porous electrode of arbitrary shape with a thin Pt film deposited on a portion of the electrode surface...301 Picture of half-cell experimental setup... 305 Schematic of half-cell electrode holder... 306 Schematic of how the membrane is placed in electrode housing for
the electrodeposition and cyclic voltammetry experiment... 308 Schematic of how the membrane is placed in electrode housing for
the oxygen gain experiments... 313 Representative current vs. time transient responses recorded for the three different types of deposition techniques... 315 Image (a): surface image of Pt seed layer. Pt was sputtered for 90
seconds producing a Pt loading of21.2 Pg/cm2. Image (b) surface image of Pt film deposited by the SPS-S deposition technique. Pt
loading of 61.25 pg/cm2... . .. . . .. . . .. . . . .. . . .. . . .. . . . .. . ..317
Plots of the current versus time-0.5 (Cottrell plots) for all three
transient responses. The data point at short times, <5 seconds, and at long times, > 45 seconds, are omitted from the plots. A least square linear regression was applied to the
Figure 6-9: Figure 6-10: Figure 6-11: Figure 6-12: Figure 6-13: Figure 6-14: Figure 6-15: Figure 6-16: Figure 6-17: Figure 6-18: Figure 6-19: Figure 6-20: Figure 6-21:
(i/ i. ) versus t /t,,, analysis of the DPS experimental data,
i, =8.7 x10⁻⁴ A /cm2 and t, = 3.62sec ... 322
Image (a) surface image of Pt film deposited by the DPS deposition technique. Pt loading of 19.1 gg/cm2. Image (b)
surface image of Pt film deposited by the DPS deposition
technique. Pt loading of 79.2 pg/cm2... . . .. . .. . . . .. . . .. . . . ....323
Voltammograms of glassy carbon electrode and 15 wt%
PTFE-bonded membrane in 0.5 M H2SO4 solution...325
Voltammogram of 15 wt% PTFE-bonded membrane fully saturated w ith 0.5 M H2SO4... . . . 326
Voltammograms of 15 wt% PTFE-bonded membrane with no Pt and with Pt nucleation layer...327 Cyclic voltammograms for Pt films deposited by the three
deposition techniques. The Pt loadings are 58.9, 59.8, and 61.3 pg/cm2 corresponding to the Pt film deposited by the SPS, DPS,
and SPS-S techniques, respectively...329 Cyclic voltammogram of Pt film taken without the Pt foil on the backside of the membrane. The Pt film was deposited by the DPS
technique and the Pt loading is 29.7 pg/cm2... .... . . .. . . . ...330 Cyclic voltammogram of Pt film deposited on 10 wt%
PTFE-bonded membranes. The Pt loading is 20.1 pg/cm2... .. .. . . .. . . . .. 331
Plots of the specific area vs. Pt loading for films electrodeposited
by the DPS, SPS, and SPS-S deposition techniques...332
Plots of A, vs. PtL -1 for Pt films deposited by the DPS and
SPS-S deposition techniques... 334 Potential vs. time curves for 40.2 jg/cm2 Pt film deposited by the
DPS deposition technique. Electrode was in 100% oxygen at 0.07
bar gauge pressure... 336 Illustration of the iterative scheme for oxygen gain model... 340 Model predictions for liquid electrolyte pressure at the Pt film vs.
Figure 6-22: Figure 6-23: Figure 6-24: Figure 7-1:: Figure 7-2: Figure 7-3: Figure 7-4: Figure 7-5: Figure 7.6: Figure 7-7: Figure 7-8: Figure A-1: Figure A-2:
Oxygen gain vs. current density for DPS deposited films. Low pressure: 20% oxygen and 80% nitrogen at 0.07 bar gauge pressure and high pressure: 100% oxygen at 0.07 bar gauge pressure... 343 Oxygen gain vs. current density for DPS deposited films. The two
sets of data are: (a) oxygen gain from a low pressure of 100% oxygen at 0.07 bar gauge to a high pressure of 100% oxygen at 0.05 bar gauge, and (b) oxygen gain from a low pressure of 100% oxygen at 0.07 bar gauge to a high pressure of 100% oxygen
at 1 bar gauge...344 Experimental data and model predictions for oxygen gain on 40.2 pig/cm2 Pt film deposited by the DPS deposition technique. Low pressure: 20% oxygen and 80% nitrogen at 0.07 bar gauge pressure
and high pressure: 100% oxygen at 0.07 bar gauge pressure... 345 Schematic of half-cell system. Dimensions are in microns... 352 Schematic of proton-switching mechanism (Grotthus mechanism)
for proton transport in concentrated phosphoric acid. The
phosphoric acid molecules and phosphate anions are associated by hydrogen bonds...360 Illustration of the methodology for solving the differential equations of this m odel... 367 Current density of the half-cell vs. the ratio s / r for several r
values. The electrode potential is 0.675 V...370 Plot of current density vs. Pt loading for several cylindrical hole
radii. The Electrode potential is 0.675 V...373 Plot of the Pt loading that maximizes current (PtLQm) vs. r for
several electrode potentials...374 Performance curve of MFE with a catalyst parameters of
r = 10 pm,s = 2pum, PtL = 50 pg /cm2. Performance curve of PCE
using the parameters from Fuller et al... 376 Electrolyte pressure at position x = 250 vs. the current density of
the electrode...378 Images of silicon die microfabricated by deep reactive ion etching...390 Nafion-bonded microfabricated catalyst layer (top view)... 391
Figure A-3: Figure A-4: Figure A-5: Figure B-1: Figure B-2: Figure B-3: Figure B-4: Figure B-5: Figure B-6: Figure B-7: Figure B-8: Figure B-9:
Nafion-bonded microfabricated catalyst layer (top view) at
higher m agnification...392 Nafion-bonded microfabricated catalyst layer (side view)...392 Nafion-bonded microfabricated catalyst layer (side view) at
higher M agnification... 393 The addition and condensation reactions involved in the forming of
an organic aerogel...395 Image of carbon aerogel (RC = 50). Note the fibrous appearance... 398
Image of Carbon Aerogel (R/C = 200). Note the "string of pearls" appearance and larger particle size...398 Depiction of the micelle created by the surfactant within the pore.
The micelle braces the pore and reduces the effect of the water
surface tension... 400 Image of carbon aerogels prepared using cyclohexane during the air drying process. Image (a) is the cleaved surface of the aerogel prepared with 200 R/C ratio. Image (b) is the cleaved surface of the aerogel prepared with 50 R/C ratio...403 Image of carbon aerogels prepared by air drying with the aid of the CTAC surfactant. Both Images are of aerogels prepared with 200 R/C ratio. Image (a) is the cleaved surface of the aerogel prepared with 0.06 CTAC/R ratio. Image (b) is the cleaved surface of the
aerogel prepared with 0.10 CTAC/R ratio...404 Image of carbon aerogels prepared by air drying with the aid of the CTAC surfactant. Both images are of aerogels prepared with 200 R/C ratio and 0.10 CTAC/R .Image (a) is the membrane skin of aerogel membrane prepared by casting on Lexan surface. Image (b) is the membrane skin of aerogel membrane prepared by
casting on Teflon surface...405 Plot of ionic conductivity of membranes saturated with 3.7 M
H2SO4. The carbon aerogel data points are for the both the 0.06 and 0.10 CTAC/R ratio prepared membranes and the 200 R/C ratio membrane prepared with no surfactant. The plot also includes the measured conductivity of the PES-bonded membranes and the
theoretical conductivity of the porous carbon electrode (PCE)...407 Image of the Silicone Die created using DRIE...409
Figure B-10: SEM images of aerogel cast on silicon die after air drying. The casting mixture contained a 200 R/C ratio and 0.10 CTAC ratio. Image (a) shows the breaking of the die caused by aerogel shrinking when air dried. Image (b) shows the cracking of the
List of Tables
Table 3.1: The effects that PTFE content has on agglomerate radius, effective conductivity and electrode performance. The agglomerate radius and effective ionic conductivity were obtained by fitting the
performance curve to flooded agglomerate model... 83 Table 5.1: Specific activity of polycrystalline Pt compared to that of dispersed
Pt nanoparticles...210 Table 5.2: Parameters of deposition model...260 Table 5.3: Electron transfer number, n, and ik'im -APt for the Pt disk
(0 pg/cm2) and electrodeposited Pt films...268 Table 5.4: List of Tafel slopes for Pt films deposited by the DPS technique...269 Table 6.1: Parameters of deposition model...335 Table B-1: Material properties for carbon aerogel samples for different R/C
ratios and CTAC/R ratios. The surfactant samples have a lower
Acronyms
AFC Alkaline Fuel Cell
BCP Breakthrough Capillary Pressure
CE Counter Electrode
CK Carmen-Kozeny
CV Cyclic Voltammetry
DCDPS 4,4'-dichlorodiphenyl sulfone DHDPS 4,4'-dihydroxydiphenyl sulfone
DPS Double Potential Step
DRIE Deep Reactive Ion Etching
GDL Gas Diffusion Layer
IBP Initial Breakthrough Pressure
KIMM Korea Institute of Machinery & Materials
LSV Linear Sweep Voltammetry
MCFC Molten Carbonate Fuel Cell
MEA Membrane Electrode Assembly
MFE Microfabricated Electrode
MIT Massachusetts Institute of Technology
MPL Microporous Layer
MTL Microsystems Technology Lab
NHE Normal Hydrogen Electrode
NMP N-methyl-2-pyrrolidone (NMP)
OCP ORR PAFC PBI PCE PEMFC PES PMMA Pt/C PTFE RBP RDE RE RF RRDE SCE SEM S-H SOFC SPS SPS-S TFCE UME
Open Circuit Potential
Oxygen Reduction Reaction
Phosphoric Acid Fuel Cell Polybenzimidazole
Porous Carbon Electrode
Proton Exchange Membrane Fuel Cell
Polyethersulfone
Polymethylmethacrylate
Platinum Particles Supported on Carbon Black
Polytetrafluoroethylene
Repeating Breakthrough Pressure Rotating Disk Electrode
Reference Electrode
Resorcinol-Formaldehyde
Rotating Ring Disk Electrode
Saturated Calomel Electrode
Scanning Electron Microscopy
Scharifker and Hills Solid Oxide Fuel Cell
Single Potential Step
Single Potential Step with Seed Layer
Thin Film Carbon Electrode
UTC United Technology Company
WE Working Electrode
Chapter 1
Introduction
1.1 Motivation
In the 2 1s" century, the practical attainment and conversion of energy will play an
increasingly important role in the continued improvement of mankind's standard of living. However, fossil fuels, which were responsible for the remarkable technological
advancements of the past two centuries, are now seen by many to have disadvantages that call into question a continued dependence on them. The adverse effects of fossil fuel combustion on the environment are now well known. For example, scientists now see global warming as a real threat, and if not addressed, will have catastrophic effects on our environment. Furthermore, a growing number of knowledgeable scientist and engineers believe that the continued widespread use of certain fossil fuels will eventually result in a
depletion of the reserves of these fuels in this century.
On the dangers of the continued use of fossil fuel, there is no middle ground. For some experts, the disadvantages of fossil fuels are so great that they foresee a future in which the energy security of nations is ensured through forced energy savings as well as armed conflicts. More optimistic views consider the positive effects of new technologies leading to better utilization of fossil fuels, renewable energy forms, and atomic energy [1]. In this spirit, the fuel cell is seen as a technology that has the potential to help with the world's energy needs of the future. This technology has been known for over 160 years. Sir William Robert Grove demonstrated the first operating fuel cell in 1839. The
technology is now in its fourth cycle of attempts to penetrate the energy market. In the past, fuel cells had proven themselves to be too complex, too expensive, and too
unreliable to compete with the simple oxidation of fuels in power plants and combustion engines [1]. However, in this present cycle, the outlook for the implementation of the technology is much more favorable. It now appears that the technological, political, and
market conditions are appropriate for the introduction of fuel cell into the global energy market in one form or another.
Fuel cells convert hydrogen or hydrocarbon fuels directly into electricity. No other energy-generation technology offers the combination of benefits that fuel cells do. In addition to low or zero emissions, benefits include high efficiency and reliability, multi-fuel capability, site flexibility, durability, scalability, and ease of maintenance.
Since fuel cells operate silently, they reduce noise pollution, and the waste heat from a fuel cell can be used to provide hot water or space heating for a home or office.
At present, despite vast amounts of capital dedicated to R&D, only a few
commercial applications can be found. The production cost of fuel cells remains too high for them to contend with traditional power sources, such as batteries and combustion engines, without significant market drivers. Lowering cost is, therefore, an important task for the emerging fuel cell industry. The economy-of-scale effects in production will lead to cost reductions. Yet, this alone will not enable fuel cells to reach their target cost. Reductions must also come by improved fabrication techniques, development of new materials, and more efficient use of existing materials. In particular, cost saving can be realized in low temperature fuel cells, such as proton exchange membrane fuel cells (PEMFC) and phosphoric acid fuel cells (PAFC), by more efficient use of the materials
that make up their electrodes. This can be accomplished by improving the electrode structure to allow for improved catalyst utilization and the reduction in mass-transport losses particularly at high current densities.
1.2 Research Objectives
The performance of low temperature fuel cells, like proton exchange membrane fuel cells (PEMFC) and phosphoric acid fuel cells (PAFC), is largely controlled by the microstructures that make up the catalyst layer of the air/oxygen electrode. In state-of-the-art fuel cells, the catalyst layer is formed by conventional thin-film fabrication techniques. These techniques include the rolling, printing, or spraying the catalyst ink onto a gas backing layer or onto an electrolyte membrane. Conventional fabrication techniques provide little control over the geometry and distribution of microstructures within the catalyst layer. For this reason, conventional fuel cell electrodes suffer from low catalyst utilization and contain microstructures that are not optimal for transport of reactants and products. An ideal electrode is limited solely by the rate of the
electrochemical reaction.
In this dissertation, microfabrication is introduced as a new method for constructing electrodes that addresses the limitations posed by existing fabrication techniques. The advantage of microfabrication comes from the technique's ability to provide greater control over the geometry and distribution of the microstructures that make up the catalyst layer of the electrodes. This added control allows for a more
Microfabrication techniques are currently being used in research labs to fabricate micro-scale fuel cells [2, 3, 4]. In these designs, microfabrication techniques are used to construct micro-scale flow channels for the cell and/or the auxiliary components of the fuel cell system. The techniques are not used to fabricate the electrode itself. Prinz's research group at the Rapid Prototyping Laboratory at Stanford University has proposed the use of microfabrication to apply a three-dimensionally patterned macro-texture upon the microporous electrodes of polymer exchange membrane fuel cells[5, 6]. Prinz's group is the only other known research group who has proposed using microfabrication to construct the electrode itself.
In this research, the microfabricated electrode concept was applied to the design of an air electrode for liquid electrolyte fuel cells. The catalyst layer of the electrode is envisioned to be fabricated by using a microfabricated die to shape, either by casting or embossing, a porous carbon matrix into the reverse pattern of the die. The resulting dual-porosity layer consists of an array of cylindrical holes (10 to 50 pm in diameter) that were formed due to the pattern transfer and the "micropores" ( pore size < 1 pm) of the carbon matrix.' The cylindrical holes are used for gas transport while the micropores are saturated with a liquid electrolyte for ion transport. The catalyst (Pt or Pt alloy) is loaded into the microfabricated structure by depositing thin catalyst films on the surfaces of the cylindrical holes. These films are less than 50 nm thick, and they should have a high density of triple-phase boundaries.
The objectives of the research presented in this dissertation were: 1) to propose a design for an air electrode that can be fabricated using existing microfabrication
'In the lexicon of porosimetry, micropores refer to pore sizes <2 nm, mesopores to pore sizes from 2 to 50
nm and macropores to pore sizes > 50 nm. However, in this dissertation, micropores refer to the pores of 1
technologies and 2) to evaluate if such an electrode has the potential to improve the performance of liquid electrolyte fuel cells. To accomplish these objectives, the research was divided into four major areas of study. These research areas are discussed below.
1. Identification of the best material to use for the porous carbon matrix of the catalyst layer.
Two types of polymer-bonded carbon materials were identified as materials that may be suitable for the catalyst layer matrix, the polytetrafluoroethylyne (PTFE) bonded membrane and the polyethersulfone (PES) bonded membrane. These materials were
formed into thin membranes in order to characterize them. The properties of the
materials that would directly affect the performance of the catalyst layer were measured. These property values were used in a l-D electrode model to simulate the performance of the microfabricated electrode and optimize its structure.
The actual fabrication of the microfabricated catalyst layer was beyond the scope of the research presented in this dissertation. Preliminary work in this area was
conducted by our colleague Dr. Chang Rae Lee at the Korea Institute of Machinery & Materials (KIMM). Some the results of his work are described briefly in Appendix A and Appendix B.
2. Measurement of the electrokinetic parameters of electrodeposited Pt films.
In the microfabricated electrode design, the catalyst is deposited as thin films in the catalyst layer rather than highly dispersed catalyst particles. The use of thin catalyst films in the catalyst layer is an essential characteristic of the microfabricated electrode design. Unfortunately, the kinetic data of the oxygen reduction reaction (ORR) on electrodeposited Pt films are scarce in the literature. In this part of the research, the
electrodeposition of thin Pt film on glassy carbon was studied. The electrokinetic parameters of these Pt films were measured using the rotating disk electrode technique and voltammetry.
The mass activity of the Pt film is the parameter that will most affect the
microfabricated electrode design. The results of this work allow for an assessment of this important parameter.
3. Measurement of oxygen transport within the Pt film supported on a porous matrix that is saturated with electrolyte.
In the microfabricated electrode design, the catalyst is deposited as thin films in the belief that such films will lead to a significant reduction oxygen transport losses within the active region of the electrode. In this part of the research, Pt films were electrodeposited on the porous carbon membranes. The specific areas of these films were measured for different electrodeposition techniques. The oxygen transport characteristics within the deposited films were studied by conducting oxygen gain experiments on the Pt films.
4. Simulation of electrode performance.
The experimental results from research areas (1), (2), and (3) were incorporated into a 1 -D model of a microfabricated electrode operating as the cathode in a phosphoric acid fuel cell. The model was used to optimize the geometry of the catalyst layer and predict the performance of the air-fed cathode operating at the typical conditions of state-of-the-art phosphoric acid fuel cells.
1.3 Thesis Organization
The main body of this dissertation comprises of 8 chapters. In Chapter 2, a survey of existing fuel cell technology and a brief review of the electrochemistry underlying fuel cells are provided. A more detailed discussion on fuel cell technology and fundamentals can be found in the following recommended books [1, 7, 8] and review articles [9, 10, 11, 12,]. For readers that are familiar with the basics of fuel cell
technology and fundamentals, Chapter 2 may be skipped without loss of continuity with the remaining chapters of this dissertation.
In Chapter 3, a review of fuel cell electrode design methodology and a description of the state-of-the-art in electrode design for low temperature fuel cells are provided. The advantages and disadvantages of these electrodes are discussed and some published novel fabrication techniques employed to improve the electrode performance are introduced. Chapter 3 concludes with Section 3.4, which provides the description and discussion of the microfabricated electrode design concept of this research.
In chapters 4, 5, and 6, the experimental work of this dissertation is presented.
The details and results of the preparation and characterization of the polymer-bonded membranes are presented in Chapter 4. The experimental procedures and results of the
study of Pt electrodeposition on glassy carbon and the study of the ORR on these
deposited films are given in Chapter 5. Lastly, in Chapter 6, the experimental procedures
and results of the study of Pt films electrodeposited on the polymer-bonded membranes and the study of oxygen transport within these films are presented. These three chapters can be read in any order. However, the reader may find it helpful to review the
In Chapter 7, the 1 -D model of the microfabricated air electrode is developed. The predictions of the model for various catalyst layer geometries are presented. Chapter 7 concludes with recommendations for an optimal electrode design. In Chapter 8, a summary of the research results presented in this dissertation as well as recommendations for future research possibilities are given.
References
[1] K. Kordesch and G. Simader, Fuel Cells and Their Applications, VCH Publishers, New York, 1993.
[2] K. Shah, W.C. Shin, and R.S. Besser, "A PDMS micro proton exchange membrane fuel cell by conventional and con-Conventional microfabrication techniques", Sensors and Actuators B, Vol. 97, p. 157, 2004.
[3] S.S. Hsieh, J.K. Kuo, C.F. Hwang, and H.H. Tsai, "A novel design and
microfabrication for micro PEMFC", Microsystems Technologies, Vol. 10, p. 121, 2004
[4] R. O'Hayre, PhD Thesis, Department of Material Science and Engineering, Stanford University, 2004
[5] S.J. Lee, S. Cha, R. O'Hayre, A. Chang-Chien, and F.B. Prinz, "Miniature fuel cells with non-planar interface by microfabrication", Proceeding of
Electrochemical Society - Power sources for the new millennium, pp. 67-76, 2000.
[6] S.J. Lee, S. Cha, Y. Liu, R. O'Hayre, and F.B. Prinz, "High power-density polymer-electrolyte fuel cells by microfabrication", Proceeding of
Electrochemical Society, Spring 2000.
[7] A.J. Appleby and F.R. Foulkes, Fuel Cell Handbook, Van Nostrand Reinhold, 1996.
[8] J. Newman and K.E. Thomas, Electrochemical Systems, Third Edition, John Wiley & Sons, Inc., Hoboken, New Jersey, 2004.
[9] L. Carrette, K.A. Friedrich, and U. Stimming, "Fuel Cells: Principles, Tyes, Fuels, and Applications", CHEMPHYSCHEM, Vol. 1, p. 162, 2000.
[10] G.J.K Acres, "Recent advances in fuel cell technology and its applications", Journal ofPower Sources, Vol. 100, p. 60, 2001.
[11] B.C.H. Steele, "Material science and engineering: The enabling technology for the commercialization of fuel cell systems", Journal ofMaterial Science, Vol. 36, p. 1053, 2001.
[12] A.Z. Weber and J. Newman, "Modeling Transport in Polymer-Electrolyte Fuel Cells", Chem. Rev. Vol. 104, p. 4679, 2004.
Chapter 2
A
Brief Review of Fuel Cell Technology
2.1 What is a fuel Cell
A fuel cell is an electrochemical device that continuously changes the chemical energy of a fuel and oxidizer to electrical energy by a process involving an invariant electrode-electrolyte system. Its operation is similar to that of a battery since chemical energy is directly converted to low voltage DC electricity. However, unlike a battery, fuel cells do not use chemicals that form part of their structure or are stored within their
structure as the source of chemical energy. Instead, the reactants are supplied from an external source. For this reason, a fuel cell will continue to operate as long as the fuel and oxidizer are supplied and the products of the electrochemical reaction are removed from the cell.
Figure 2-1 illustrates the basic components and operation of a fuel cell. The components include two manifolds, a porous negative electrode (anode), a porous positive electrode (cathode), and an electrolyte that separates the two electrodes. The reactant gases are distributed via the manifolds. One manifold directs the fuel, typically hydrogen, to the anode while the other directs the oxidizer (air or oxygen) to the cathode. The fuel is electrochemically oxidized on the anode surface, and the oxidizer is
electrochemically reduced on the cathode surface. Both electrodes are designed to be a thin, porous structure with a large surface area that provides the reactants with numerous reaction sites and an efficient means of accessing them.
Oxidizer In Fuel In 1/ 02 | H2 Positive Ion Oxidizer Fuel Manifold or Manifold Negative Ion
Depleted Oxidizer Depleted Fuel and
and Product Gases Product Gases Out
Cathode Electrolyte Anode
(Ion Conductor)
Figure 2-1: Fuel cell diagram
The ions created by the electrochemical reactions flow between the anode and cathode through the electrolyte. The type of fuel cell determines the type of ions
produced and transported through the electrolyte. If the electrolyte is a cation conductor, positive ions are produced at the anode and migrate to the cathode. For the case of anion conductor, negative ions are produced at the cathode and are transported via the
electrolyte to the anode. Like the electrodes, the electrolyte region is constructed to be as thin as possible in order to minimize the length of the path traveled by the ions and, hence, minimize the resistive losses associated with ion transport. The electrolyte must also be impermeable to both the reactants and the electrons produced at the anode. This assures that the maximum number of electrons is made to flow through the external load before getting to the cathode where they reduce the oxidizer.
Most, but not all, fuel cells use both gaseous fuel and oxidizer. Hydrogen is the preferred fuel because of its high reactivity in the oxidizing environment of the anode. Hydrocarbon fuels can be used, but they are typically reformed into hydrogen and other components prior to entering the fuel cell for lower temperature fuel cells (<220*C) and within the fuel cell for higher temperature fuel cells (> 600'C). Direct electrochemical oxidation of hydrocarbons is problematic even at high temperatures since carbon deposits tend to form on the catalytic surface. Alcohols, such as methanol and ethanol, are
currently being investigated as possible fuels that can be directly introduced into the anode without a reforming process. These fuels can be used in either a liquid or a gaseous phase. Since the activity of these alcohols is much lower than that of hydrogen, they have thus far found limited application. Due to their high activity, Borohydrides (MBH4, where M is Li, Na, or K) have emerged as a promising alternative to
carbon-based fuels. These fuels, at present, are only suitable in alkaline fuel cells since borohydrides are unstable at low pH values. In the cathode, oxygen is the preferred oxidizer because of its availability in the atmosphere. One company, Neah Power Systems, uses peroxide as the oxidizer in their portable fuel cell [1].
A single fuel cell, such as that illustrated in Figure 2-1, is capable of producing only 0.5 to I volts under operating condition. For this reason, fuel cell designs link
together many individual cells in series to produce a more useful voltage. The most popular method for connecting cells in series is the stack configuration. Figure: 2-2 illustrates a fuel cell stack. This stack can then be configured in series and/or in parallel with other fuel cell stacks to further tailor the voltage, current, and power produced. The
number of individual cells contained within one stack is typically greater than fifty and varies significantly depending on the type of fuel cell [2].
BipolarPlates
Electrodeidrlyte assaernaly
End Rites
Figure: 2-2: Fuel cell stack
In a stack configuration each electrode is in electrical contact with the adjacent electrode via the bipolar plate as shown schematically in Figure 2-3. In addition to the electrode/electrolyte assembly itself, the bipolar plate is the most important component of the fuel cell stack. It performs several functions, each crucial to the proper operation of the stack. Each bipolar plate acts as a current collector for both the anode and cathode in contact with it. It also provides the electrical series connections between cells, and it physically separates the oxidizer flow of one cell from the fuel flow of the adjacent cell. The flow channels of the bipolar plates serve as distribution pathways for the fuel and oxidizer. Often these flow channels have complex configurations in order to distribute the fuel or oxidizer uniformly over the face of the electrode. The typical width of each
channel is 1mm or less. The performance of the cell tends to increase with a decrease in the width of the channels [2].
Eledr4Me/dolyte Asserbly
AirAir
BipoIrPlates
Figure 2-3: Fuel cell assembly with bipolar plates
In liquid electrolyte fuel cells, the electrolyte originally in the electrodes and matrix evaporates over time. This leads to a reduction in the performance of the fuel cell stack over the lifetime of the fuel cell system. The evaporation problem was solved by replacing the impermeable bipolar plates with porous bipolar plates. The porous bipolar plates store excess electrolyte in some of their pores. During the long-term operation of the stack, capillary forces slowly drive the electrolyte from the pores of the bipolar plates to the pores of the electrodes and matrix as the electrolyte evaporates. In 1979 the
so-called "ribbed substrate" design, shown in Figure 2-4, was introduced by United
Technologies. The ribs are formed on the reactant gas side of the electrode backing. An electrode is directly applied on the non-ribbed (flat) side of the substrate. The ribbed
substrate is a dual-porosity structure that has its small pores filled with electrolyte and its large pores providing the gas channels needed for the rapid diffusion of the reactants to the electrode. An impermeable flat graphite sheet serves as the gas separator plate contacting the substrate ribs for the anode and cathode of adjoining cells. The
combination of the anode and cathode ribbed substrates and a separator plate comprises one bipolar plate. The ribbed substrate design allows for five-fold increase in effective electrolyte volume compared to the case where no electrolyte is stored in the bipolar plates [3].
Anode
substrate
Porous plates
Cathode
store acid.
substrate
One
rib
Senarator
olate
pattern
Figure 2-4: UTC's "ribbed substrate" stack design 131
2.2 Types of Fuel Cells
Five principle types of fuel cells are currently in various stages of
commercialization or are undergoing research, development, and demonstrations: solid oxide fuel cells (SOFC), molten carbonate fuel cells (MCFC), phosphoric acid fuel cells (PAFC), alkaline fuel cells (AFC), and proton exchange membrane fuel cells (PEMFC). These fuel cells types are characterized by their electrolyte, though the operation is fundamentally the same from one type to another. Figure 2-5 shows the electrochemical
CO2 (from intermal reformng -Z 02 (from a) Cathade e Anode Eleotrolvte I SorC (1000 C) 1/202+ 2e -+ 02- DtP.stabilized R2+ 0+ --+H2O + 2e ceramc merial MCFC (650 OC) 1/202+ C02 +2e -+ Lithium-potassiurn H2 + -+
CO3 Lithium-sodiurn COX+ H20 +
2e-Cc2 --- +
PAFC (200 *C)
1/202+ 211+2e- -+ 2+H+
-H20 210% phosphoric acid H2--+2]r+2 e 4--- 2H*
1/202 120+2e- AFC (M OC H2+21O--+
2HO- Alkaline solution
2H2C+2e-20__._..._..2.H .___011..
PEMFC (0C)
Fluomcabn polymer
120,,+2H+2e -+ doped with ;pjfo acid H2-+2H'+2r
H20 2H*
Figure 2-5: Types of fuel cells
2.2.1 High Temperature Fuel Cells (> 600*C):
The high temperature fuel cells, SOFC and MCFC, are seen as the most
appropriate type of fuel cell for large power generation (> 200 kW). Their high operating temperatures allow easier and less complicated fuel reforming compared to the low temperature cells. Reforming can also take place in the fuel cell itself, where waste heat from the electrochemical reaction is directly available for the conversion of the fuel to hydrogen. Internal reforming typically leads to a significant increase in plant efficiency and decrease in system cost. Furthermore, the high temperature operation makes expensive catalyst unnecessary, and carbon monoxide is sufficiently oxidized at those
H2 (from itenal
refnng)
H2(from extemal
temperatures that it is considered a fuel and not a poison to the catalyst. These fuel cells are also well suited for applications where high quality waste heat is needed in industrial cogeneration.
Solid Oxide Fuel Cells:
The SOFC operates at high temperatures, ~ 500 - 1 000*C, with an electrolyte comprising a ceramic oxygen conductor. The most common electrolyte currently used in
SOFC is ZrO2 (zirconia) doped with 8-10 mole-% of Y203 (yttria). At high temperatures,
02- ions move across the electrolyte via vacant lattice sites. Since there is no liquid phase within the cell, pore flooding is not a problem and there is no electrolyte migration problem under cell operating conditions. The solid electrolyte is also very stable. Molten Carbonate Fuel Cells:
The MCFC operates at high temperatures, - 650*C, with an electrolyte
comprising a mixture of molten carbonates (M2C0 3, M: Li, Na, K). The liquid
electrolyte is held within a mixture of ceramic particles that form the electrolyte matrix. The MCFC relies on a balance of capillary pressures to establish the electrolyte
interfacial boundaries in the porous electrodes and to keep the matrix flooded. Electrolyte management, that is, the control over optimum distribution of molten carbonate electrolyte within the cell components, is critical for achieving high performance and endurance with MCFCs [4].
2.2.2 Low Temperature Fuel Cells (<220*C):
These types of fuel cells appear best suited for mobile and light-duty residential applications because of their relatively fast start up times and compact size. Their low
operating temperatures make corrosion and sealing problems much more manageable than those problems in the high temperature fuel cells.
Due to their low temperatures, the electrochemical kinetics are slow in these fuel cells. For this reason, an expensive catalyst, like Pt, is required in both electrodes. In the case of AFCs, non-noble metal electrocatalysts are feasible since the electrochemical reactions are more rapid in an alkaline electrolyte than an acid electrolyte. However, Pt remains the catalyst of choice in most AFC electrodes. In most applications, the
electrodes of these fuel cells are formed with carbon black particles that are bounded into a porous network with the aid of a polymer binder. Teflon is used as a binder in certain regions of the electrode to provide appropriate electrolyte and/or liquid water
management. The carbon black particles act as high surface area supports for the catalyst nano-particles (2 nm-10 nm). Keeping the catalyst particles size in the range of 2 - 10 nm allows for high catalyst mass activity which lowers required catalyst loading. Phosphoric Acid Fuel Cells:
The PAFC operates at medium temperatures, ~ 150 -220*C, with a liquid electrolyte comprising concentrated phosphoric acid. The electrolyte is retained in a microporous (- 1p m) silicon carbide matrix, and it is at a concentration of approximately 100% H3PO4. Phosphoric acid offers many advantages as a fuel cell electrolyte. It has
excellent thermal, chemical, and electrochemical stability at the operating conditions of the fuel cell. It also has a relatively low vapor pressure at temperatures above 150 *C. Other inorganic acids such as HCLO4, H2SO4, and HCl were evaluated in
laboratory-scale fuel cells. Compared to H3PO4, these acids have lower chemical stability and
-220*C). Phosphoric acid does have some serious disadvantages. Among them are poor ionic conductivity near room temperature, low oxygen solubility, and lower oxygen kinetic rates compared to other acids. Despite these disadvantages, no alternative acid has been identified that offers any significant advantages over phosphoric acid.
Thus PAFC was the first to be commercialized for terrestrial applications. It is well suited for medium-scale cogeneration, such as office building and schools. Although the PAFC design currently represents the largest installed base of fuel cells worldwide, current development interest in this type of fuel cell has waned since they are now seen to be less promising than PEMFC. However, the phosphoric acid doped polybenzimidazole (PBI) membrane fuel cell, a hybrid between the PAFC and solid membrane fuel cell, is presently being considered as a higher temperature alternative to the PEMFC. The electrodes in this type of fuel cell are very similar to those of the PAFC
since a portion of the phosphoric acid within these electrodes is in the liquid phase. Alkaline Fuel Cells:
The AFC operates at low to medium temperatures, ~ 60 -220*C, with a liquid electrolyte comprised of hydroxyl ions. Potassium hydroxide is the most common alkaline solution used in these fuel cells. Oxygen reduction kinetics is more rapid in alkaline electrolytes than in acid electrolytes; consequently, these fuel cells can operate satisfactorily with the use of non-noble metal electrocatalysts. A major disadvantage of AFCs is that alkaline electrolytes form carbonates in the presence of CO2. For this reason,
AFCs have traditionally been considered for specialized application where pure H2 and
02 are utilized. For example, this type of fuel cell was first used in the Apollo space crafts where pure H2and 02 were available from the propulsion system of the spacecraft.
![Figure 2-9: The dependence of reversible fuel cell potential on temperature [17].](https://thumb-eu.123doks.com/thumbv2/123doknet/14685000.560017/58.918.318.641.592.910/figure-dependence-reversible-fuel-cell-potential-temperature.webp)