HAL Id: inserm-00593975
https://www.hal.inserm.fr/inserm-00593975
Submitted on 18 May 2011
HAL is a multi-disciplinary open access
archive for the deposit and dissemination of
sci-entific research documents, whether they are
pub-lished or not. The documents may come from
teaching and research institutions in France or
abroad, or from public or private research centers.
L’archive ouverte pluridisciplinaire HAL, est
destinée au dépôt et à la diffusion de documents
scientifiques de niveau recherche, publiés ou non,
émanant des établissements d’enseignement et de
recherche français ou étrangers, des laboratoires
publics ou privés.
Thierry Poynard, Mona Munteanu, Olivier Deckmyn, Yen Ngo, Fabienne
Drane, Djamila Messous, Jean Castille, Chantal Housset, Vlad Ratziu,
Françoise Imbert-Bismut
To cite this version:
Thierry Poynard, Mona Munteanu, Olivier Deckmyn, Yen Ngo, Fabienne Drane, et al.. Applicability
and precautions of use of liver injury biomarker FibroTest. A reappraisal at 7 years of age.. BMC
Gastroenterology, BioMed Central, 2011, 11 (1), pp.39. �10.1186/1471-230X-11-39�. �inserm-00593975�
R E S E A R C H A R T I C L E
Open Access
Applicability and precautions of use of liver injury
biomarker FibroTest. A reappraisal at 7 years of
age
Thierry Poynard
1*, Mona Munteanu
2, Olivier Deckmyn
2, Yen Ngo
2, Fabienne Drane
2, Djamila Messous
1,
Jean Marie Castille
2, Chantal Housset
1, Vlad Ratziu
1and Françoise Imbert-Bismut
1Abstract
Background: FibroTest (FT) is a validated biomarker of fibrosis. To assess the applicability rate and to reduce the risk of false positives/negatives (RFPN), security algorithms were developed. The aims were to estimate the prevalence of RFPN and of proven failures, and to identify factors associated with their occurrences. Methods: Four populations were studied: 954 blood donors (P1), 7,494 healthy volunteers (P2), 345,695 consecutive worldwide sera (P3), including 24,872 sera analyzed in a tertiary care centre (GHPS) (P4). Analytical procedures of laboratories with RFPN > 5% and charts of P4 patients in with RFPN were reviewed.
Results: The prevalence of RFPN was 0.52% (5/954; 95%CI 0.17-1.22) in P1, 0.51% (38/7494; 0.36-0.70) in P2, and 0.97% (3349/345695; 0.94-1.00) in P3. Three a priori high-risk populations were confirmed: 1.97% in P4, 1.77% in HIV centre and 2.61% in Sub-Saharan origin subjects. RFPN was mostly associated with low haptoglobin (0.46%), and high apolipoproteinA1 (0.21%). A traceability study of a P3 laboratory with RFPFN > 5% permitted to correct analytical procedures.
Conclusion: The mean applicability rate of Fibrotest was 99.03%. Independent factors associated with the high risk of false positives/negatives were HIV center, subSaharan origin, and a tertiary care reference centre, although the applicability rate remained above 97%.
Background
Due to the limitations of liver biopsy biomarkers are widely used as a non-invasive alternative in patients with chronic liver disease to assess fibrosis stage and necroin-flammatory activity [1-3]. One of the most validated serum biomarkers, Fibrotest-Actitest (FT-AT), was intro-duced on the market in September 2002 and has been widely prescribed since then [2-4]. The French Heath Authorities (HAS) have recommended the following pre-cautions of use for FT: (1) the laboratory that performs the test must use the appropriate assay technique and ensure proper quality control (e.g. with regard to sample storage), and (2) the person who prescribes the test must consider confounding factors when interpreting test results. Patients should have no intercurrent illness, in
particular acute inflammation, hemolysis, or Gilbert’s syndrome, and should be taking no medications that are known to cause elevated bilirubin levels [3].
The aim of the “precautions of use” is to reduce the number of false positive/false negative. The purest defi-nition of false positive/negative for a biomarker of liver injury can be obtained only by large surgical biopsy [5,6]. Therefore there is no perfect reference test for the definition of false positive/negative in a large population. From several studies of discordances results between biopsy (the classical reference) and FT, the prevalence of discordant results is around 25%, half of the cases being due to biopsy failure and half being due to FT failure [4,5,7-9].
Due to these limitations of the classical definition of false positive/false negative, we propose to use the con-cept of “high risk profile of false positive/false negative results” (RFPN) and to use it for the definition of FT
* Correspondence: tpoynard@teaser.fr 1APHP UPMC Paris Liver Center, Paris, France
Full list of author information is available at the end of the article
© 2011 Poynard et al; licensee BioMed Central Ltd. This is an Open Access article distributed under the terms of the Creative Commons Attribution License (http://creativecommons.org/licenses/by/2.0), which permits unrestricted use, distribution, and reproduction in any medium, provided the original work is properly cited.
applicability for the identification of deviance from recommended pre-analytical and analytical procedures [10-15].
“Security algorithms” were elaborated in order to identify subjects with RFPN. These algorithms were initially derived from the first validation of FT-AT [8,16-20]. FT-AT are calculated through a centralized website http://www.biopredictive.com after entering the results of the panel’s components [4]. Therefore it has been possible to identify RFPN during this step and the suspected RFPN components are indicated on the results sheets.
In order to improve the medical service, the specific aims of the present study were to estimate the applic-ability of FT using prevalence of RFPN and of proven failures, to identify factors associated with their occur-rence and to identify new causes. The integrated data-base of 354,143 tests, which is the accumulation of the first seven years of FT-AT prescription, was used.
Methods
Populations included
Four prospective populations were included (Figure 1): 954 blood donors between January 2003 and March 2004 (P1); 7,494 healthy volunteers from a general population without previous history of liver disease between June 2006 and September 2008 (P2); 345,695 consecutive FT-AT (P3) analyzed on the dedicated website between October 2002 and June 2009, includ-ing 24,872 patients with clinical characteristics seen in a tertiary care reference centre, Groupe Hospitalier Pitié Salpêtrière, Paris, France (reference population P4), for which the detailed clinical characteristics were easier to retrieve. The components of FT-AT were analyzed on fresh samples; the same laboratory (refer-ence center) was used for P1, P2 and P4; the P3 com-ponents of FT-AT were analyzed prospectively in 449 labs in 35 countries.
Device description
The FibroTest is comprised of two parts: 1) biomarker assays (components of the panel) measuring alpha2-macroglobulin (A2M), apolipoprotein A1 (ApoA1), haptoglobin, gamma-glutamyl-transpeptidase (GGT) and total bilirubin (bilirubin); and 2) a software con-taining a fixed, pre-determined algorithm to generate the FibroTest score from the components, adjusted for age and gender.
To be validated and interpretable, the components assays of FT must follow the pre-analytical and analytical recommendations: measurements are calibrated and per-formed according to standardized reagents against refer-ence materials; expression in multiples of the upper limit of reference values should not be employed [10-15]; and
company-approved analyzers and kits are used to generate quantified values of the individual markers [4]. Since the first study, 157 peer-reviewed publications including sev-eral meta-analyses, have consistently validated the accu-racy of FT-AT for assessing the stages of liver fibrosis when these technical recommendations have been utilized and when the area under the receiver operating character-istics curve has been standardized according to stage spec-trum. [Additional file 1].
Endpoints
The main endpoint was RFPN, the percentage of patients with values outside the reference ranges (abnor-mal values) and in whom the switch to the median value of the given abnormal variation component induced a variation of at least 0.30 of the FT value. This variation was considered clinically significant, as a varia-tion of 0.30 in FT is equivalent to 1.5 histological METAVIR score of fibrosis [21]. Abnormal values of each component were defined as those beyond the 98% percentile of the normal distribution (one lower percen-tile or one upper percenpercen-tile). The reference ranges for each component were established from the normal dis-tribution observed in the reference laboratory (Biochem-istry Department, Groupe Hospitalier Pitié Salpêtrière, Paris France) during the first studies in patients with HCV [16], HBV [17], alcoholic liver disease [18], and non-alcoholic fatty liver disease [19] [Additional file 2 Table S1, Additional file 2 Table S2, Additional file 2 Table S3, Additional file 2 Table S4]. These “security” algorithms were previously validated using analyses of discordances versus liver biopsy [7] and discordances with liver stiffness measurements [8,9].
The specificity of FT-AT was checked using the P1 and P2 control populations after the exclusion of cases with a previous history of liver diseases and exclusion of RFPN. In these controls, the prevalence of presumed advanced fibrosis (FT > 0.48, equivalent to METAVIR stage F2F3F4) or advanced activity (AT > 0.52, equiva-lent to METAVIR grade A2A3) [21] was assumed to be lower than 5% in both groups. P2 subjects with FT sug-gesting advanced fibrosis were prospectively retested in the reference center [22].
High-risk related factors analyzed
The risk factors associated with RFPN were assessed in each population. Two categories of factors were consid-ered: analytical, and non-analytical.
Charts of the RFPN in the P4 group were re-analyzed retrospectively by three experts (TP, MM and YN) in order to identify new possible causes of component errors and to validate the positive predictive value of high-risk profiles. In each case the cause of failure was attributed to FT or not according to the a priori
(pre-determined) following rules: the disease was advanced fibrosis (METAVIR stage F2F3F4); biopsy was the refer-ence if performed less than 5 years apart; when no biopsy had been performed but an LSM was interpreta-ble (at least 10 measures, success rate greter than 60% and interquartile range lower than 30%), it was taken as reference (advanced fibrosis if greater than 7.1 kPa); when esophageal varices or ascites were present, it was interpreted as advanced fibrosis; for low haptoglobin, if there was no reference but a cause of hemolysis was identified, the FT > = 0.48 was considered a false posi-tive. When no reference presented with a clear cause of component error (such as hemolysis for haptoglobin or severe undernutrition for A2M or ApoA1), the case was stated to be indeterminate.
Analytical factors
The impact of analytical factors was assessed using three methods, as performed on the P3.
First, we tested the a priori hypothesis that the analyti-cal procedures improved with time, with a decrease in RFPN in the last 3 years of this cohort (median).
Second, we tested the a priori hypothesis that the pre-valence of RFPN could be lower in laboratories that per-formed more FTs than those that perper-formed less, the cut-off being chosen as 10,000 for the 7 years of follow-up, as these 6 laboratories represented 50% of the over-all assays.
Thirdly, the analytical procedures of laboratories with a prevalence of RFPN > 5% were reviewed prospectively during the follow-up to check whether the pre-analytical and analytical recommendations had been followed.
Non-analytical factors
Known risk factors were those mentioned by Health Authorities: acute inflammation, hemolysis, Gilbert’s syndrome and medications associated with elevated bilirubin [3]. Suspected risk factors were those men-tioned in publications: ethnicity, HIV (including chole-static anti viral drugs), large ascite and undernutrition [3,4,8,22-24].
We therefore predetermined 3 types of populations concerning RFPN: a low-risk group (P1 blood donors and P2 healthy volunteers), an intermediate-risk group
(P3 patients investigated for chronic liver diseases, and three high risk groups: tertiary care reference centre (P4), HIV centre and patients from sub-Saharan origin.
In the P2, P3 and P4 groups, we tested the hypothesis that component variability could be associated with eth-nicity. We therefore analyzed the association between RFPN and the following areas of residency: Western Europe, the Middle East, Eastern Europe, North Africa, North America, Central America, and the Far East. In the P2 group we tested the pre-determined hypothesis that subjects living in SubSaharan Africa should have an increased risk of RFPN associated with abnormally low haptoglobin levels (haptoglobin polymorphism with ana-haptoglobinemia) [24].
In the P3 group, the impact of coinfection with HIV was assessed by comparing one center that assess FT-AT almost exclusively in coinfected patients with HIV and HCV or HBV with other centers that were not spe-cialized in HIV [23].
The reference centre is a tertiary care centre where very high-risk RFPN patients were screened for FT, such as patients with severe undernutrition and sepsis. In the P4 group, charts were reviewed for the usual causes of RFPN: extra-hepatic cholestasis patients (abnormal increase in GGT and bilirubin); hemolysis (abnormal decrease in haptoglobin); Gilbert’s syndrome (abnormal increase in bilirubin); acute inflammation, i.e. acute sep-sis (abnormal increase in haptoglobin); and severe undernutrition with total proteins < 50 g/L.
Patients at high-risk related to acute hepatitis were supposed to be detected by extreme values of ALT, greater than 622 IU/L (1% upper percentile observed in first publications), and were excluded in this study, which focused on chronic liver diseases.
Statistical methods
Comparisons used the Student’s t-test for univariate analysis and logistic regression analysis for multivariate analysis. NCSS statistical software was used [25].
To reduce the risk of type 1 error due to multiple testing (five pre-determined risk factors, two covariates, four populations and five FT components) only p-values less than or equal to 0.0001 were considered to be sig-nificant. Multivariate analysis included age and gender as covariates.
The present study was in compliance with the Helsinki Declaration, was an epidemiological study, not an inter-ventional study and did not require the approval of an ethical committee. For the population 4, patients hospita-lized in the “Groupe Hospitalier Pitié Salpêtrière”, and for which we looked to the possible causes of false posi-tives or false negaposi-tives, the protocol was recognized as not interventional by the Ethical Committee (November 25th 2005). All the data were strictly anonymous data,
the database was declared to the French authorities “Commission Informatique et Liberté”, in accordance with the French law on information processing,
Results
Populations included
The characteristics of the included populations are given in Table 1. As expected, the P1 population, made up of blood donors, was younger than the others. The P2 group, a population representative of the French popula-tion older than 40 years [22], was older than the P3 group, the worldwide population. The majority of FT-AT assays were performed in Western Europe (86%), followed by the Middle East (8.10%). The P4 population, the reference centre, had more males, more residents of Western Europe and longer laboratory experience in FT-AT testing compared with the P3 population.
Normal values
In comparison with initial studies, FT references values were confirmed in the two populations without a history of liver disease: the mean FT in P1 = 0.11 (98% percen-tiles 0.01-0.41); in P2, FT = 0.17 (0.02-0.52). Only 2.75% (3/109; 95% CI 0.57-7.8) of P2 subjects that were rein-vestigated for FT > 0.48 were proven to be false positive, i.e., 0.04% (3/7, 554; 0.01-0.12) proven false positive rate.
Prevalence of RFPN
According to the populations, the prevalence of RFPN was 0.52% (5/954; 95% CI 0.17-1.22) in P1 and 0.51% (38/7494; 95% CI 0.36-0.70) in P2 (blood donors and general population, two usually low-risk populations); 0.97% (3349/345695; 95% CI 0.94-1.00) in P3 (inter-mediate risk); and 1.97% (491/24872; 95% CI 1.80-2.15) in P4, a high-risk population (Table 1). This RFPN pre-valence in P4 was significantly higher (P < 0.0001) than in the P3 worldwide population, confirming the a priori high-risk of a tertiary care reference centre. There was also a higher RFPN prevalence versus P3 (P < 0.0001) in the two other high-risk populations: in patients of the HIV centre, the RFPN prevalence was 1.77% (46/2606; 95% CI 1.30-2.35), and in subjects of sub-Saharan origin it was 2.61% (6/230; 95% CI 0.96-5.59).
RFPN per components
In all populations, low haptoglobin was the most fre-quent cause of RFPN, ranging from 0.41% to 1.30%.
Blood donors (P1)
Among the five (0.52%) tests with RFPN (Table 1), four (0.42%) were related to low haptoglobin and one to low A2M.
General population (P2)
Among the 38 (0.51%) tests with RFPN, 31 (0.41%) were related to low haptoglobin, five to high ApoA1, two to
Table 1 Characteristics of included populations
Name of Population P1 Blood donors P2 Healthy volunteers P3 Worldwide patients P4 Reference Center patients
Consecutive cases (n) 1,037 7,554 361,096 24,872
Included cases (n) n = 954 n = 7,494 n = 345,695 n = 24,872
Age mean year (SD; range) 35.75 (12.24;18-67) 56.97 (6.77; 40-90) 49.73 (13.87; 0-101) 49.36 (13.60;0-101) Gender
Male 483 (50.63%) 4138 (55.22%) 198612 (57%) 15530 (62.44%)
Female 471 (49.37%) 3356 (44.78%) 147083 (43%) 9342 (37.56%)
Country of residency/ancestry Residency Ancestry Residency Residency Western Europe 1037 (100%) 6705 (89.47%) 295685 (85.53% 24,872 (100%) Middle East 0 (0%) 0 (0%) 28001 (8.10%) 0 (0%) Eastern Europe 0 (0%) 0 (0%) 5209 (1.51%) 0 (0%) North Africa 0 (0%) 467 (6.23%) 6464 (1.87% 0 (0%) North America 0 (0%) 0% (0%) 7726 (2.23% 0 (0%) Central America 0 (0%) 0% (0%) 1436 (0.42%) 0 (0%) Far East 0 (0%) 92 (1.23%) 993 (0.29%) 0 (0%) South America 0 (0%) 0% (0%) 181 (0.05%) 0 (0%) Sub-Saharan Africa 0 (0%) 230 (3.07%) 0 (0%) 0 (0%) Laboratory experience > 10,000 tests (n = 6) 954 (100%) 7494 (100%) 143772 (41.49%) 24,872 (100%) < 10,000 tests (n = 443) 0 (0%) 0 (0%) 201923 (58.41%) 0 (0%) HIV positive patients
Yes 0 (0%) 2 (0.003%) 2602 (0.75%)3 NA
Negative 954 (100%) 1012/1014 (13.50%) 0 (0%) NA
Unknown 0 (0%) 6443 (66.50%) 343093 (99.25%) NA
Liver Disease Risk Unknown Only known for high risk
profile
Non Alcoholic Fatty Liver 105 (11.01%) 2930 (39.29%) NA NA
Alcoholic Liver Disease 82 (8.59%) 883 (11.84%) NA NA
NAFLD/ALD 19 (1.99%) 1036 (13.89%) NA NA Hepatitis C Virus 0 (0%) 31 (0.42%) NA NA Hepatitis B Virus 0 (0%) 3 (0.04%) NA NA Other 0 (0%) 2 (0.03%) NA NA No Risk 748 (78.41%) 2572 (34.49%) NA NA FibroTest FibroTest mean (SD; 1%-99% percentiles) 0.11 (0.08;0.01-0.41) 0.17 (0.12;0.03-0.60) 0.42 (0.27;0.03-0.97) 0.40 (0.28;0.03-0.98) F0 or F0-F1 908 (95.18%) 6302 (84.09)% 131658 (38.09%) 10526 (42.32%) F1 or F1-F2 42 (4.40%) 927 (12.37)% 77974 (22.56%) 5302 (21.32%) F2 0 (0%) 151 (2.01%)2 31646 (9.15%) 2059 (8.28%) F3 or F3-F4 3 (0.31%)1 76 (1.01%)2 46021(13.31%) 2979 (11.98%) F4 1 (0.10%)1 38 (0.51%)2 58396 (16.89%) 4006 (16.11%) Actitest Actitest mean (SD; 1%-99% percentiles) 0.08 (0.07;0.01-0.40) 0.11 (0.10;0.02-0.52) 0.37 (0.26;0.02-0.95) 0.30 (0.24;0.02-0.93) A0 or A0-A1 935 (98.01%) 7060 (94.52%) 166068 (48.05%) 14823 (59.72%) A1 or A1-A2 16 (1.68%) 347 (4.46%) 84102 (24.33%) 5207 (20.98%) A2 or A2-A3 1 (0.10%) 39 (0.48%) 26714 (7.73%) 1455 (5.86%) A3 2 (0.21%) 48 (0.64%) 68741 (19.89%) 3334 (13.43%)
high GGT, one to low ApoA1 and one to high bilirubin with proven Gilbert’s syndrome.
Worldwide population (P3) (Table 2)
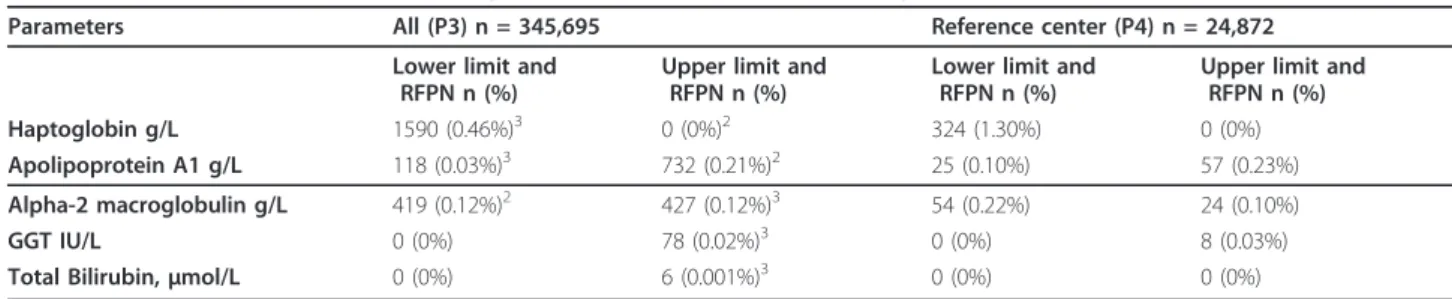
Among the 3,349 (0.97%) tests with RFPN, the most fre-quent were false positives due to low haptoglobin (0.46%), false negatives due to high ApoA1 (0.21%), false positives due to high A2M (0.12%), and false negatives due to low A2M (0.12%). The prevalence of other RFPN profiles (low apoA1, high GGT and high bilirubin) all together was 0.05%. No RFPN were related to high haptoglobin.
Reference centre patients (P4) (Table 2)
Among the 491 (1.97%) tests with RFPN, the most fre-quent were due to low haptoglobin (1.30%), and the others were similar to P3: high ApoA (0.23%), low A2M (0.22%), low ApoA1 (0.10%), high A2M (0.10%), high GGT (0.03%), and none for bilirubin.
Factors associated with RFPN General population (P2)
Sub-Saharan origin was the only factor associated with false positive due to low haptoglobin in multivariate analysis (OR = 8.0; 95% CI 3.2-20.0; P < 0.0001).
Worldwide patients (P3)
Factors associated in multivariate analysis with RFPN in the worldwide population (P3) are described in Table 3. Low A2M (Table 3 and Additional file 3, Table S5) There was more risk of false negative in Eastern Europe residents.
High A2M (Table 3 and Additional file 3, Table S5) There was more risk of false positives in Eastern Europe residents.
High Apolipoprotein A1 (Table 3 and Additional file 3, Table S6)Both analytical and non-analytical factors were associated with a risk of false negative due to high ApoA1 in multivariate analysis. There was less risk in subjects assessed in laboratories with more experience, having performed over 10,000 FT-AT tests. There was more risk in subjects from the reference centre.
Low ApoA1 (Table 3 and additional file 3, Table S6) Both analytical and non-analytical factors were asso-ciated with a risk of false positive due to low ApoA1 in multivariate analysis. There was more risk in labora-tories with more experience (over 10,000 FT-ATs) and in the reference centre.
High GGT (additional file 3, Table S7), or high bilir-ubin No risk factors were identified for false positive due to high GGT or high bilirubin.
Low haptoglobin (Table 3 and additional file 3, Table S7) Both analytical and non-analytical factors were associated with the risk of false positive due to low haptoglobin in multivariate analysis. There was less risk in subjects assessed during the last 3 years of testing in laboratories with a high level of experience (more than 10,000 FT-AT), and in residents of Western Europe, North Africa and North America. There was more risk in HIV co-infected patients and in those from the refer-ence centre.
Table 2 Prevalence of FibroTest with high-risk profile of false positive/negative (RFPN1)
Parameters All (P3) n = 345,695 Reference center (P4) n = 24,872 Lower limit and
RFPN n (%)
Upper limit and RFPN n (%)
Lower limit and RFPN n (%)
Upper limit and RFPN n (%)
Haptoglobin g/L 1590 (0.46%)3 0 (0%)2 324 (1.30%) 0 (0%)
Apolipoprotein A1 g/L 118 (0.03%)3 732 (0.21%)2 25 (0.10%) 57 (0.23%) Alpha-2 macroglobulin g/L 419 (0.12%)2 427 (0.12%)3 54 (0.22%) 24 (0.10%)
GGT IU/L 0 (0%) 78 (0.02%)3 0 (0%) 8 (0.03%)
Total Bilirubin, μmol/L 0 (0%) 6 (0.001%)3 0 (0%) 0 (0%)
1Defined as a change > 0.30 in Fibrotest (at least 1.5 fibrosis METAVIR stage) when switching to the median value of the given parameter. Overall at least one
parameter out of limits with significant impact was observed in 3349 cases (0.97%).
2Risk of false negative 3Risk of false positive
Table 1 Characteristics of included populations (Continued)
FibroTest-ActiTest Interpretable 949 (99.48%; 98.78-99.83) 7456 (99.49%; 99.30-99.64) 342,346 (99.03%; 99.00-99.06) 24381 (98.03%; 97.95-98.20) High risk False Positive/Negative
(95% CI)
5 (0.52%; 0.17-1.22) 38 (0.51%; 0.36-0.70) 3349 (0.97%; 0.94-1.00) 491 (1.97%; 1.80-2.15)
1All four cases with Fibrotest greater than 0.48 had a high-risk profile of components which were detected by security algorithms (one low A2M and 3 low
haptoglobin).
2
31 cases out of the 265 cases with FibroTest greater than 0.48 had a high-risk profile of components which were detected by security algorithms. NA = not available
Identification of analytical errors The high rate of RFPN in Eastern Europe residents could be traced to one lab (#1517). This laboratory had a rise in RFPN pre-valence from 1/65 (1.54%) in 2005, 12/166 (6.74%) in 2006 and 119/650 (18.31%) in 2007. The cause identified was an improper calibration that mistakenly settled the starting-point of the A2M calibration curve. After cor-rection, the RFPN significantly decreased compared to previous years (P < 0.001): 58/1340 (4.33%) in 2008 and 26/1295 (2.01%) in 2009.
Reference centre patients (P4) (Table 4)
Out of the 491 RFPN identified in the P4 population, 331 (67%) charts were prospectively reviewed (range 59-100%). Of these, 118 (36%) were proven false positives of FT, due to 1) low haptoglobin in 114 (mostly hemoly-sis) (Table 4 and additional file 4, Table S8); 2) high GGT in two (chronic pancreatitis) (Table 4 and addi-tional file 5, Table S9); and 3) low ApoA1 in two (severe undernutrition) (Table 4 and additional file 5, Table S10). No specific cause of high A2M was found (addi-tional file 5, Table S11). There were eight proven false negatives of FT: 5 due to low A2M (large ascites or severe undernutrition) (additional file 5, Table S12), and three due to high ApoA1 (additional file 5, Table S13).
No specific cause of the ApoA1 increase was found, but two repeated assessments in two patients found a nor-mal value, suggesting either an unknown transient factor or an analytical error for the first assay.
In 41/2602 (1.58%) HIV positive patients with hapto-globin RFPN, 14 (0.54%) were proven false positives, 18 proven true positives (0.69%) and in the remaining 9 (0.35%), the attributability of error was indeterminate.
Biopsies was the reference in 38 cases for suspected RPFN, including 5 for a FibroTest value stage F1 or F2 and an interval greater than one year between FibroTest and biopsy. LSM was the reference in 15 cases.
Discussion
The present study assesses the applicability rate of FT-AT, using the definition of high-risk profiles of false positive/negative induced by each component. The pre-valence of the most frequent proven causes of high-risk profiles was assessed, and new causes of high-risk pro-files were identified. This study aim was to better define the applicability of such composite biomarkers. This study was not designed for the assessment of the classi-cal false positive/false negative rate. Analysis of discor-dances between imperfect reference tests should be
Table 3 Factors associated in multivariate analysis with RFPN in the worldwide population (P3)
Low haptoglobin Low ApoA1 High ApoA1 Low A2M High A2M
Risk for FibroTest False Positive False Positive False Negative False Negative False Positive Number of
patients
1,590 118 732 419 427
Range 0.01-0.08 g/L 0.10-0.41 g/L 2.51-6.97 g/L 0.10-0.80 g/L 5.90-9.68 g/L
Factor (n) Odds Ratio (95% CI) P value1 Analytical factor
Last 3 years of test 0.76 (0.68-0.84) P < 10-5 NS NS NS NS
> 10,000 tests 0.44 ((0.39-0.50) P < 10-5 NS 0.48 ((0.39-0.50) P < 10-5 NS NS Non analytical factor Residency Western Europe NS NS NS NS NS North Africa NS NS NS NS NS North America 0.05 (0.01-0.20) P = 0.00005 NS NS NS NS Eastern Europe NS NS NS 22.44 (5.55-90.85) P < 10 -4 NS HIV center 3.97 (2.88-5.48) P < 10-5 NS NS NS NS Age > 50 years 0.63 (0.57-0.70) P < 10-4 NS 1.86 (1.60-1.86) P < 10-5 NS 1.56 (1.29-1.90) P = 10-4 Male gender 1.30 (1.18-1.45) P < 10-4 NS 0.34 (0.29-0.40) P < 10-5 2.6 (2.07-3.28) P < 10 -5 NS Reference center 5.35 (4.67-6.13) P < 10-5 2.61 (1.66-4.13) P = 0.00003 1.84 (1.39-2.45) P < 10-5 1.83 (1.36-2.47) P = 0.00008 NS
performed only among applicable results, and this speci-fic topic has been discussed elsewhere [9]. We acknowl-edge that there is no ideal rule for the attribution of the cause of failure. That is why we use the simplest model one, that is a two classes discordances model, for the diagnosis of advanced fibrosis versus non advanced fibrosis with the predetermined standard threshold for FibroTest, biopsy and LSM. Due to the slow fibrosis progression rate, the risk of large variability is small in a two classes model (discordant patients were classified in a two classes model: F0F1 vs F2F34). Even for a rapid fibrosis progressor untreated (0.20 METAVIR stage per year), the mean change in 5 years is 1 stage. Therefore only patients in those patients stage F1 or in F2 patients sustained responders with a rapid regression, there was a risk of discordance due to an interval of 5 years or greater.”
Applicability
One criteria of efficiency of a diagnostic test is its applicability, defined as no test failure and reliable results. In the present study there was no FT failure and the applicability rate (reliable results) ranged from 99.49% in the general population to 98.03% among patients of the tertiary care reference centre. In
comparison, the applicability of another validated mar-ker of fibrosis, elastography, was much lower, with an 81.9% applicability rate assessed in 13,369 examinations, including 3.1% failure and 15.8% unreliable results [26].
High-risk factors
The usual causes of RFPN were observed [4], but 3 new items of information were obtained. The RFPN preva-lence in the general population, as well as their risk fac-tors, was estimated, and in the reference centre the prevalence of proven specific causes was assessed.
Haptoglobin
Despite a limited rate (0.46%), low haptoglobin was clearly the most frequent cause of false positives. A sig-nificant independent risk (OR = 3.6) of haptoglobin false positive in patients with HIV was observed. The most frequent proven causes of low haptoglobin with RFPN were hemolysis due to cardiac prosthesis 25/114 (22%) and association with hemoglobin disease in 15/114 (13%), and HIV coinfection in 14/114 (12%).
A very low haptoglobin level had already been observed prospectively in 249 consecutive samples from HIV-infected subjects without any known cause of hemolysis [27] and was significantly associated with nucleoside analogues treatment. The accuracy of FT for
Table 4 Review of high risk FibroTest using charts in the reference center (P4)
Components of FibroTest with
high risk profile
Number of Tests Identified Reviewed (Traceability) 1
Correctly classified Indeterminate Incorrectly classified
True Positive True Negative False positive False negative Haptoglobin < = 0.08 g/L 324 214 (66%) 58 (27%) 0 (0%) 42 (20%) 114 (53%)2 0 (0%) > = 3.20 g/L 0 0 (100%) 0 0 0 0 0 Apolipoprotein A1 < = 0.56 g/L 25 17 (68%) 15 (88%) 0 0 (0%) 2 (12%)3 0 (0%) > = 2.50 g/L 57 38 (67%) 1 (3%) 30 (79%) 4 (10%) 0 (0%) 3 (8%)4 Alpha-2 macroglobulin < = 0.80 g/L 54 32 (59%) 3 (10%) 24 (75%) 0 (0%) 0 (0%) 5 (15%)5 > = 5.90 g/L 24 24 (100%) 22 (92%) 0 2 (8%) 0 (0%) 0 (0%) GGT IU/L > = 1140 IU/L 8 6 (75%) 1 (16%) 1 (16%) 2 (33%) 2 (33%)6 0 (0%)
Total Bilirubin, μmol/L > = 50 0 0 (100%) 0 0 0 0 0
Total 491 331 (67%) 100 (30%) 55 (17%) 50 (14%) 118 (36%) 8 (2%)
1Inpatients with detailed charts reviewed by 3 experts. (Supplement file S3)
When biopsy was performed (5 years apart) it was taken as a reference; when no biopsy had been performed but an LSM was interpretable it was taken as a reference (advanced fibrosis if greater than 7.1 kPa); when oesophageal varices or ascites were present it was taken as advanced fibrosis; for low hapto, if no reference and a cause of hemolysis was identified FT > = 0.48 was considered false positive. When no reference was present without a clear cause of component error (such as hemolysis for hapto or severe undernutrition for A2M and apoA1, the case was stated to be indeterminate.
2Low haptoglobin, already known causes: hemolysis with patent cause: cardiac prosthesis (n = 25), drepanocytosis (n = 13), ribavirin (n = 8), thalassemia (n = 2),
autoimmune (n = 2); anahaptoglobinemia (n = 1). Two new possible causes were HIV co-infection (n = 14) and splenectomy (n = 4)
3
Low ApoA1 already known cause: severe undernutrition (n = 2 total serum proteins < = 50 g/L)
4
High ApoA1 suspected analytical error or an unknown transient factor as in 2 cases, 2 repeated ApoA1 assays were in normal range
5Low A2M already known causes: large ascites (n = 3), severe undernutrition (n = 1 total serum proteins < = 50 g/L); a new possible cause was macrophage
activation syndrome (n = 1)
the diagnosis of fibrosis remained highly significant in HIV patients coinfected with HCV [28] or HBV [29] and was similar to non-HIV patients. This is explained in the present study, as this profile rate which induced a significant change (more than one METAVIR fibrosis stage) is rare (1.58%), with only 0.54% proven false positives.
Only one case of anhaptoglobinemia was identified with RFPN. FT has not been prescribed widely in West African countries, a region which may have a higher pre-valence of anahaptoglobulinemia. However a study in Burkina Faso did not observe such cases in a validation study of FT in patients with chronic hepatitis B [30].
Splenectomy was observed in four cases without other overt causes; we did not find any cases or ratio-nale in the literature directly linking splenectomy and haptoglobin levels. The hypothesis could be that of a confounding disease (hemolytic anemia treated by sple-nectomy), or the consequences of splenectomy on red blood cell aging and destruction [31]. Therefore RFPN can not be directly attributed to splenectomy at this time. However this should be mentioned in the pre-cautions of use.
We did not observe any cases of RFPN due to high haptoglobin, even in the tertiary care reference center. This is reassuring for patients with associated inflamma-tory disease and confirms the high applicability rate of FT already observed in patients with cryoglobulinemia and vasculitis [32].
ApoA1
High ApoA1 was the most frequent cause (0.21%) of false negative risk and was associated with the tertiary care reference center. The direct causality was uncertain. Among the three cases that indeed had a false negative result since advanced fibrosis was proven, the repeated apoA1 returned to “normal” values in two cases with true positives of repeated FT, suggesting a transient unknown factor or an analytical error. Among transient factors, a dietary cause was not identified, and we had already observed previously that there were no differ-ences between fasting and non-fasting results [33].
Low ApoA1 was rarely (0.03%) associated with false positive risk. The only factor that was identified as being associated with this profile was the tertiary care refer-ence center. Most of these patients had severe undernu-trition with serum total protein concentrations lower than 50 g/L.
Alpha 2 macroglobulin
The reference center was associated both with false positive and false negative A2M RFPN results. The causes of low A2M proven false negatives were patients with large ascites or severe undernutrition with total proteins lower than 50 g/L. One new cause was a
proven macrophage activation syndrome with a very high total protein count (112 g/L). The rationale could be an increase of IFN gamma [34], which down-regu-lates the A2M-activated receptor [35].
There were no cases of high A2M with false positive RFPN which were proven to be true false positives. Therefore it is possible that this profile could be an excessive security warning.
GGT
A very low prevalence of elevated GGT RFPN (0.02%) was observed. In the reference center, the only proven causes identified were two cases with chronic pancreati-tis, an already well known cause of FT false positive.
Total bilirubin
The prevalence of bilirubin RFPN was very low, 0.001 in the worldwide database and none in the reference cen-ter. Only one case of Gilbert’s syndrome was associated with a proven false positive among the general popula-tion. Overt Gilbert’s syndrome has a prevalence of around 4%, but in the usual range of bilirubin levels, there was no significant impact on FT presumed fibrosis stage. These global results are reassuring, with a likely reliable physician selection for the exclusion of extra-hepatic cholestatic diseases.
Overall recommendations for precautions of use
As a comparison with the first HAS recommendations [3], this study estimated the prevalence of the pre-viously identified intercurrent illnesses acting as con-founding factors when interpreting test results: 0.46% for hemolysis, and less than 0.001% for Gilbert’s syn-drome. It was reassuring that there were no cases of acute inflammation identified through extreme values of haptoglobin or A2M. Despite a still high applicabil-ity rate, greater than 97%, the following at-risk popula-tions must be mentioned: HIV infected patients and those of sub-Saharan origin. The following rare but proven causes must be added: severe undernutrition, pancreatitis, and macrophage activation syndrome. In addition, though it is not proven, splenectomy should be mentioned.
Conclusion
This type of study should improve the benefit-risk assessment of non-invasive strategies in the forthcoming new standards of care of patients with chronic liver dis-eases [36]. Such studies must be performed in suspected high-risk populations as well as in apparently healthy volunteers which are representative of the general popu-lation. As for the approved drugs’ labeling, the new diagnostic tests should describe the proven and sus-pected risk factors of false positive and negative with estimates of the prevalence of very high risk profiles, defining not applicable results.
Additional material
Additional file 1: Publications concerning FibroTest. Comprehensive list of publications concerning FibroTest performance.
Additional file 2: Prevalence of samples out of the initial reference range limits (P1, P2, P3). Table S1: Initial reference range for the parameters of FibroTest and ActiTest: Derived from first population definitions (Imbert-Bismut et al Lancet 2001, Myers HBV J Hep, Naveau ALD CGH and Ratziu NAFLD BMC Gastro). Table S2: Normal ranges in apparently healthy volunteers. Blood donors (P1). Distribution using initial references ranges in HCV, HBV, ALD and NAFLD. Table S3: Normal ranges in apparently healthy volunteers. General population P2, FibroTest components performed in the reference center. Table S4: Prevalence of samples out of the initial reference range limits, among global population (P3)
Additional file 3: Factors associated with high risk profile in patients’ global population (P3). Tables S5: Alpha2 macroglobulin. Table S6: Apolipoprotein A1. Table S7: High haptoglobin and High GGT Additional file 4: Patients details among patients of the reference tertiary care center (P4).
Additional file 5: Patients details among patients of the reference tertiary care center (P4) other than low haptoglobin. Table S8: Low haptoglobin (< = 0.08 g/L) among 214 inpatients of reference center (P4). Table S9: High GGT > = 1140. Table S10: Low Apoa1 < = 0.56. Table S11: High A2M > = 5.90. Table S12: Low A2M (< = 0.80 g/L). Table S13: High Apoa1 > = 2.50.
Acknowledgements
Biopredictive has supported this study as well as the “Association pour la Recherche sur les Maladies Virales et Hépatiques”.
Author details
1APHP UPMC Paris Liver Center, Paris, France.2Biopredictive, Paris, France. Authors’ contributions
TP conceived of the study, write the article, performed the statistical analyses and participated in its design and coordination; MM and YN participated in the data management and statistical analyses; OD, FD and JMC participated in the data management; DM, CH and FIB participated in the biochemical assessments and the false positive/negative discussion; VR drafted the manuscript. All authors read and approved the final manuscript. Competing interests
Thierry Poynard is the inventor of patented FibroTest and has a capital interest in Biopredictive the company marketing these tests. The patent belong to the French Public Organization “Assistance Publique Hopitaux de Paris”. Mona Munteanu, Olivier Deckmyn, Yen Ngo, Fabienne Drane and Jean Marie Castille are full employee of Biopredictive.
Received: 15 September 2010 Accepted: 14 April 2011 Published: 14 April 2011
References
1. Manning DS, Afdhal NH: Diagnosis and quantitation of fibrosis. Gastroenterology 2008, 134:70-81.
2. Castera L, Denis J, Babany G, Roudot-Thoraval F: Evolving practices of non-invasive markers of liver fibrosis in patients with chronic hepatitis C in France: time for new guidelines? J Hepatol 2007, 46:528-9.
3. Fontaine H, Petitprez K, Roudot-Thoraval F, Trinchet JC: Guidelines for the diagnosis of uncomplicated cirrhosis. Gastroenterol Clin Biol 2007, 31:504-9. 4. Halfon P, Munteanu M, Poynard T: FibroTest-ActiTest as a non-invasive
marker of liver fibrosis. Gastroenterol Clin Biol 2008, 32:22-38. 5. Bedossa P, Dargère D, Paradis V: Sampling variability of liver fibrosis in
chronic hepatitis C. Hepatology 2003, 38:1449-1457.
6. Ratziu V, Charlotte F, Heurtier A, Gombert S, Giral P, Bruckert E, Grimaldi A, Capron F, Poynard T, LIDO Study Group: Sampling variability of liver
biopsy in nonalcoholic fatty liver disease. Gastroenterology 2005, 128:1898-1906.
7. Poynard T, Munteanu M, Imbert-Bismut F, Charlotte F, Thabut D, Le Calvez S, Messous D, Thibault V, Benhamou Y, Moussalli J, Ratziu V: Prospective Analysis of Discordant Results between Biochemical Markers and Biopsy in Patients with Chronic Hepatitis C. Clin Chem 2004, 50:1344-1355.
8. Poynard T, Muntenau M, Morra R, Ngo Y, Imbert-Bismut F, Thabut D, Messous D, Massard J, Lebray P, Moussalli J, Benhamou Y, Ratziu V: Methodological aspects for the interpretation of liver fibrosis non-invasive biomarkers: a 2008 update. Gastroenterol Clin Biol 2008, 32:8-21. 9. Poynard T, Ingiliz P, Elkrief L, Munteanu M, Lebray P, Morra R, Messous D,
Imbert Bismut F, Roulot D, Benhamou Y, Thabut D, Ratziu V: Concordance in a world without a gold standard: A new non-invasive methodology for improving accuracy of fibrosis markers. PlosOne 2008, 3:e3857. 10. Halfon P, Imbert-Bismut F, Messous D, Antoniotti G, Benchetrit D,
Cart-Lamy P, Delaporte G, Doutheau D, Klump T, Sala M, Thibaud D, Trepo E, Robert P, Myers RP, Poynard T: A prospective assessment of the inter-laboratory variability of biochemical markers of fibrosis (FibroTest) and activity (ActiTest) in patients with chronic liver disease. Comparative Hepatology 2002, 2:3-7.
11. Imbert-Bismut F, Messous D, Thibaut V, Myers RB, Piton A, Thabut D, Devers L, Hainque B, Mercadier A, Poynard T: Intralaboratory analytical variability of biochemical markers of fibrosis (Fibrotest) and activity (Actitest) and reference ranges in healthy blood donors. Clin Chem Lab Med 2004, 42:323-333.
12. Ferard G, Imbert-Bismut F, Messous D, Piton A, Ueda S, Poynard T, Lessinger JM: A reference material for traceability of aspartate aminotransferase (AST) results. Clin Chem Lab Med 2005, 43:549-53. 13. Ferard G, Piton A, Messous D, Imbert-Bismut F, Frairi A, Poynard T,
Lessinger JM: Intermethod calibration of alanine aminotransferase (ALT) and gamma-glutamyltransferase (GGT) results: application to Fibrotest and Actitest scores. Clin Chem Lab Med 2006, 44:400-6.
14. Imbert-Bismut F, Messous D, Raoult A, Poynard T, Bertrand JJ, Marie PA, Louis V, Audy C, Thouy JM, Hainque B, Piton A: Results transferability on RXL, ARX, X-Pand, BN2 (Dade Behring) and modular DP (Roche Diagnostics) analysers: application to component assays of fibrotest and Actitest. Ann Biol Clin (Paris) 2005, 63:305-13.
15. Piton A, Messous D, Imbert-Bismut F, Berges J, Munteanu M, Poynard T, Hainque B: Alpha 2 macroglobulin immunoturbidimetric assays (DakoCytomation reagents) on Roche Diagnostic analysers (Modular P, Cobas Integra). Application to FibroTest-ActiTest. Ann Biol Clin (Paris) 2005, 63:385-95.
16. Imbert-Bismut F, Ratziu V, Pieroni L, Charlotte F, Benhamou Y, Poynard T: Biochemical markers of liver fibrosis in patients with hepatitis C virus infection: a prospective study. Lancet 2001, 357:1069-75.
17. Myers RP, Tainturier MH, Ratziu V, Piton A, Thibault V, Imbert-Bismut F, Messous D, Charlotte F, Di Martino V, Benhamou Y, Poynard T: Prediction of liver histological lesions with biochemical markers in patients with chronic hepatitis B. J Hepatol 2003, 39:222-30, 12.
18. Naveau S, Raynard B, Ratziu V, Abella A, Imbert-Bismut F, Messous D, Beuzen F, Capron F, Thabut D, Munteanu M, Chaput JC, Poynard T: Biomarkers for the prediction of liver fibrosis in patients with chronic alcoholic liver disease. Clin Gastroenterol Hepatol 2005, 3:167-74. 19. Ratziu V, Massard J, Charlotte F, Messous D, Imbert-Bismut F, Bonyhay L,
Tahiri M, Munteanu M, Thabut D, Cadranel JF, Le Bail B, De Ledinghen V, Poynard T, LIDO Study Group and the CYTOL Study Group: Diagnostic value of biochemical markers (FibroTest-FibroSURE) for the prediction of liver fibrosis in patients with non-alcoholic fatty liver disease. BMC Gastroenterology 2006, 6:6.
20. Poynard T, Morra R, Halfon P, Castera L, Ratziu V, Imbert-Bismut F, Naveau S, Thabut D, Lebrec D, Zoulim F, Bourliere M, Cacoub P, Messous D, Munteanu M, de Ledinghen V: Meta-analyses of Fibrotest diagnostic value in chronic liver disease. BMC Gastroenterology 2007, 7:40. 21. Bedossa P, Poynard T, METAVIR group: An algorithm for the grading of
activity in chronic hepatitis. Hepatology 1996, 24:289-93. 22. Poynard T, Lebray P, Ingiliz P, Varaud A, Varsat B, Ngo Y, Norha P,
Munteanu M, Drane F, Messous D, Imbert Bismut F, Carrau JP, Massard J, Ratziu V, Giordanella JP: Prevalence of liver fibrosis and risk factors in a general population using non-invasive biomarkers (FibroTest). BMC Gastroenterol 2010, 10:40.
23. Halfon P, Carrat F, Bédossa P, Lambert J, Penaranda G, Perronne C, Pol S, Cacoub P: Effect of antiviral treatment on serum markers of liver fibrosis in HIV-hepatitis C virus-coinfected patients: the Fibrovic 2 Study - ANRS HC02. Antivir Ther 2009, 14:211-9.
24. Allison AC, Blumberg BS, Rees W: Haptoglobin types in British, Spanish Basque and Nigerian African Population. Nature 1958, 181:824. 25. Hintze JL: NCSS 2007 User Guide. Number Cruncher Statistical Systems
software NCSS. Kaysville, Utah 2007.
26. Castera L, Foucher J, Bernard PH, Carvalho F, Allaix D, Merrouche W, Couzigou P, de Lédinghen V: Pitfalls of liver stiffness measurement: a 5-year prospective study of 13,369 examinations. Hepatology 2010, 51:828-35.
27. Diop ME, Bastard JP, Meunier N, Thevenet S, Maachi M, Capeau J, Pialoux G, Vigouroux C: Inappropriately low glycated hemoglobin values and hemolysis in HIV-infected patients. AIDS Res Hum Retroviruses 2006, 22:1242-7.
28. Cacoub P, Carrat F, Bedossa P, Lambert J, Penaranda G, Perronne C, Pol S, Halfon P: Comparison of non-invasive liver fibrosis biomarkers in HIV/ HCV co-infected patients: the fibrovic study–ANRS HC02. J Hepatol 2008, 48:765-73.
29. Bottero J, Lacombe K, Guechot J, Serfaty L, Miailhes P, Bonnard P, Wendum D, Molina JM, Lascoux-Combe C, Girard PM: Performance of 11 biomarkers for liver fibrosis assessment in HIV/HBV co-infected patients. J Hepatol 2009, 50:1074-83.
30. Bonnard P, Sombié R, Lescure FX, Bougouma A, Guiard-Schmid JB, Poynard T, Calès P, Housset C, Callard P, Le Pendeven C, Drabo J, Carrat F, Pialoux G: Comparison of elastography, serum marker scores, and histology for the assessment of liver fibrosis in HBV-infected patients in Burkina Faso. Am J Trop Med Hyg 2010, 82:454-8.
31. Schloter K, Drenckhahn D: Co-clustering of denatured hemoglobin with band 3: its role in binding of autoantibodies against band 3 to abnormal and aged erythrocytes. Proc Natl Acad Sci USA 1986, 83:6137-41. 32. Sène D, Limal N, Messous D, Ghillani-Dalbin P, Charlotte F, Halfon P,
Thiollière JM, Piette JC, Imbert-Bismut F, Halfon P, Poynard T, Cacoub P: Biological markers of liver fibrosis and activity as non-invasive alternatives to liver biopsy in patients with chronic hepatitis C and associated mixed cryoglobulinemia vasculitis. Clin Biochem 2006, 39:715-21.
33. Munteanu M, Messous D, Thabut D, Imbert-Bismut F, Jouys M, Massard J, Piton A, Bonyhay L, Ratziu V, Hainque B, Poynard T: Intra-individual fasting versus postprandial variation of biochemical markers of liver fibrosis (FibroTest) and activity (ActiTest). Comp Hepatol 2004, 3:3.
34. Mazodier K, Marin V, Novick D, Farnarier C, Robitail S, Schleinitz N, Veit V, Paul P, Rubinstein M, Dinarello CA, Harlé JR, Kaplanski G: Severe imbalance of IL-18/IL-18BP in patients with secondary hemophagocytic syndrome. Blood 2005, 15; 106:3483-9.
35. LaMarre J, Wolf BB, Kittler EL, Quesenberry PJ, Gonias SL: Regulation of macrophage alpha 2-macroglobulin receptor/low density lipoprotein receptor-related protein by lipopolysaccharide and interferon-gamma. J Clin Invest 1993, 91:1219-24.
36. Castera L, Pinzani M: Non-invasive assessment of liver fibrosis: are we ready? Lancet 2010, 375:1419-20.
Pre-publication history
The pre-publication history for this paper can be accessed here: http://www.biomedcentral.com/1471-230X/11/39/prepub
doi:10.1186/1471-230X-11-39
Cite this article as: Poynard et al.: Applicability and precautions of use of liver injury biomarker FibroTest. A reappraisal at 7 years of age. BMC Gastroenterology 2011 11:39.
Submit your next manuscript to BioMed Central and take full advantage of:
• Convenient online submission
• Thorough peer review
• No space constraints or color figure charges
• Immediate publication on acceptance
• Inclusion in PubMed, CAS, Scopus and Google Scholar
• Research which is freely available for redistribution
Submit your manuscript at www.biomedcentral.com/submit