• Aucun résultat trouvé

Accurate reactivity effects of pwr control rods using apollo3 advanced solvers

N/A
N/A
Protected

Academic year: 2021

Partager "Accurate reactivity effects of pwr control rods using apollo3 advanced solvers"

Copied!
13
0
0

Texte intégral

(1)

HAL Id: hal-02415315

https://hal.archives-ouvertes.fr/hal-02415315

Submitted on 17 Dec 2019

HAL is a multi-disciplinary open access

archive for the deposit and dissemination of

sci-entific research documents, whether they are

pub-lished or not. The documents may come from

teaching and research institutions in France or

abroad, or from public or private research centers.

L’archive ouverte pluridisciplinaire HAL, est

destinée au dépôt et à la diffusion de documents

scientifiques de niveau recherche, publiés ou non,

émanant des établissements d’enseignement et de

recherche français ou étrangers, des laboratoires

publics ou privés.

apollo3 advanced solvers

Jm. Palau, V. Jouault, G. Rimpault

To cite this version:

Jm. Palau, V. Jouault, G. Rimpault. Accurate reactivity effects of pwr control rods using apollo3

advanced solvers. PHYSOR 2018, Apr 2018, Cancun, Mexico. �hal-02415315�

(2)

ACCURATE REACTIVITY EFFECTS OF PWR CONTROL RODS USING

APOLLO3

®

ADVANCED SOLVERS

Jean-Marc Palau

1

, Valentin Jouault

1

and Gérald Rimpault

1

1

CEA, DEN, DER/SPRC/LEPh, Cadarache, F-13108, Saint-Paul-lez-Durance, France

Contact: jean-marc.palau@cea.fr

jean-marc.palau@cea.fr

, valentin.jouault@cea.fr, gerald.rimpault@cea.fr

ABSTRACT

In this paper, the most advanced features of the APOLLO3® new deterministic neutron

transport code are being used to calculate accurately control rod reactivity effects. In order to

illustrate the advantage of the proposed scheme, two models are being used: a model in

which the control rod assembly is surrounded by standard assemblies, calculated using 2D

TDT-MOC solver and fine structure self-shielding method with 281 groups at the lattice

calculation level; and a semi-heterogeneous model (3x3 zones) of the control rod assembly at

the core calculation level. Compared to the traditional single assembly and homogeneous

core calculation usually associated with an equivalence method such as SPH, these new

models take advantage of the possibility of subdividing an assembly with the MINARET

transport core solver through unstructured conforming triangular spatial mesh

(Discontinuous Galerkin Finite Elements), to represent explicitly the control rod shadowing

effects within the control rod assembly. Tests to demonstrate the ability of such an approach

have been carried out on a standard UOX fuel PWR reactor. The new APOLLO3

®

scheme

has been checked against TRIPOLI-4

®

Monte-Carlo calculation and has been found

extremely accurate without requiring any equivalence method. This calculation scheme lays

down the foundations for a new upgrading approach for deterministic calculations to study

PWR cores.

KEYWORDS: APOLLO3

®

, V&V, PWR, Control Rod

1. INTRODUCTION

In order to meet new industrial’s expectations in terms of neutronic calculation accuracy and versatility,

CEA launched the APOLLO3

®

project [1]. The project’s main purpose is to develop the deterministic

multi-spectral neutron transport code APOLLO3

®

. This is being done at CEA with the support of EDF

and AREVA, with the aim of having a better modeling of physical phenomena of existing reactor cores

(until 3rd generation) but also of future reactor concepts (4th generation). APOLLO3

®

is aiming at

replacing the previous 2nd generation of deterministic codes like APOLLO2, CRONOS2 and

ECCO/ERANOS.

The APOLLO3

®

-PWR package built with APOLLO3

®

solvers defines reference calculation schemes

associated with several multigroup nuclear data library to calculate all neutron parameters together with

certified biases and uncertainties derived from the VV&UQ (Verification/Validation and Uncertainty

Quantification) process. This VV&UQ process incorporates numerical verification and validation as well

(3)

as experimental validation leading to uncertainty quantification. The purpose of this paper is to present

the recent developments in the PWR calculation scheme of APOLLO3

®

, mostly focusing on the effect of

control rod assemblies representation on reactivity. After presenting the standard two-steps APOLLO3

®

reference calculation scheme the new control rod assemblies’ representation will be introduced and its

benefits will be shown on a 900 MWe PWR core.

2. APOLLO3

®

CALCULATION SCHEME

2.1. Two-steps Calculation Scheme

The use of a scientific calculation code to run a simulation requires, from the user, many choices among

the calculation models and options of the code. Those choices should match design specification of

different nature (grid, solver type …), accounting the main physics phenomena to reach the target

accuracies. The typical calculation scheme for APOLLO3

®

is presented in Figure 1. It is based on the

separation of the cell/lattice calculation (orange) from the core calculation (green).

Figure 1. : APOLLO3

®

calculation scheme.

First, the code sets the nuclear data multi-group libraries, associated with probability tables, following the

energy grid chosen by the user (1). Then shielding calculations (2) are performed to generate

self-shielded cross sections of the most relevant resonant isotopes in different regions. These cross sections are

used in the assembly flux calculation (3), and this process can be repeated (4 and 4’) with eventually

updating of fission and slowing-down sources (needed for FBR applications). By using ad-hoc leakage

and homogenization/condensation models we get self-shielded, condensed and homogenized (5) cross

sections which are stored in a Multi-Parametric Output library (MPO). Finally, we use the different MPOs

(processed for each kind of assembly) to perform the core calculation with appropriate flux solver (6).

2.2. Current PWR Calculation Scheme

(4)

Table I. : APOLLO3

®

-PWR Calculation Scheme.

Calculation Step

Functionality

Value

Lattice Calculation

(2D)

Scattering Anisotropy (1)

P

3

Energy Grid (1)

281 Groups

Self-shielding (2)

Fine-structure method for the

core

group method for the reflector

Self-shielding solver (2)

Multicell

Flux Solver (3)

TDT-MOC

Core Calculation

(3D)

Energy Grid (5)

20 Groups

Flux Solver (6)

MINARET (S

N

)

The 2D lattice calculation scheme is based on the SHEM-MOC [2] reference calculation scheme of

APOLLO2. The energy mesh is the optimized SHEM-281 groups, and the self-shielding calculation is

performed with a fine-structure (Livolant-Jeanpierre) equivalence method, using a P

ij

multicell model and

subgroup method for the steel reflector, while 2D flux calculations is based on the long-characteristics

method solver TDT-MOC [3]. In this validation study, no leakage model is used for lattice calculations

(to make the TRIPOLI-4

®

comparison easier). The only difference between APOLLO3

®

and APOLLO2

calculation schemes lies in the spatial meshing of cells (cf. Figure 2). The reference scattering anisotropy

is chosen as P

3

Legendre polynomial expansion of scattering cross-sections which is requested to treat

accurately absorber assemblies, as shown in [4].

Figure 1 : APOLLO2 (a) and APOLLO3

®

(b) spatial meshes for PWR fuel cells

Fissile and control rod assemblies are treated directly with this calculation scheme, in an infinite lattice

representation. For steel/water reflectors, a different representation is needed, since there are no fissile

isotopes in these media.

To calculate axial reflectors self-shielded cross sections, we first perform a calculation of a fissile

assembly and generate its homogenized (but not collapsed) cross sections. Then, we perform an axial 1D

calculation with TDT-MOC on a half-assembly (for the upper and lower part of the reflector) with the

previously generated cross sections. We thus homogenize and collapse to broad energy mesh the resulting

self-shielded cross sections of the reflector.

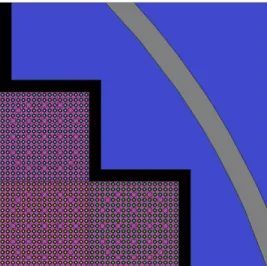
To calculate the radial reflector self-shielded cross sections, we defined a pattern including fissile

assemblies and an exact geometric description of the radial reflector (an example is provided in Figure 3).

The self-shielding calculations are carried out for the fissile assembly and the reflector separately, the

reflector self-shielded cross-sections being processed by using a 1D description at this step (following

recommendations from SHEM-MOC calculation scheme). Then, a 2D TDT-MOC calculation is

performed on the pattern (considered as an infinite lattice), and the self-shielded, homogenized and

condensed cross sections for the radial reflector are generated.

(5)

Figure 3. : Representation of the radial reflector for the studied PWR core.

All the core calculations are done with MINARET S

n

transport flux solver [5] which solves the

time-independent first-order form of the Boltzmann equation using the DGFEM method (Discontinuous

Galerkin Finite Element Method) for the spatial discretization. This solver enables us to deal with spatial

triangular and unstructured – but conform – spatial mesh in 2D and semi-unstructured in 3D (cylindrical)

geometries. It should be noted that no equivalence method is used in this calculation scheme since the

homogenization involves only one single assembly zone.

3. NEW CONTROL ROD REPRESENTATION

The treatment of critical heterogeneous assemblies is an important challenges for deterministic codes.

Existing neutrons mostly come from the fissile zones are transported through absorbers assemblies. Since

a straightforward one-step 3D core transport calculation is not possible yet (see paper [9] this conference),

we need to define intermediate calculations with a reduce impact of approximations and well suited

spectral representations in order to produce representative self-shielded cross sections for critical media.

More specifically, this may require the description of part of the core (several assemblies called clusters

as we shall see further), in order to have an energy spectrum similar to the one established in the core.

This kind of representation has been used for axial and radial reflectors and we will investigate in the

following section the performance of this model for control rod assemblies.

3.1. Lattice Representation

In the current PWR reference calculation scheme, the calculation of the control rod assembly is performed

using the same model as fissile assemblies, i.e. the infinite lattice model, based on the fundamental mode

assumption (Isolated representation). However, this representation is not realistic when we consider the

whole core heterogeneous geometry (in terms of different assembly types). It can be assessed that a new

representation is necessary to describe more precisely physical phenomena occurring at whole core level.

In classical PWR reactor cores, control rods assemblies are surrounded by a lattice of fissile assemblies.

This configuration permits to avoid power peaks by smoothing the power radial distribution.

In order to reproduce this configuration, we propose a new representation of control rods for the lattice

step of the calculation (cf. Figure 4). The calculation is performed on a 3x3 cluster, with one control rod

assembly surrounded by 8 fissile assemblies. We use a refined spatial mesh on the central (rodded)

(6)

assembly, to have an accurate description of the local spatial phenomena in this assembly, but we don’t

refine the surrounding fissile assemblies, since we don’t need to have a so high accuracy on the incoming

spectrum (this would require large time and memory consumptions for a poor accuracy gain at the end).

The calculation is performed according to the reference calculation scheme (SHEM-MOC)

recommendations in terms of fine structure self-shielding and TDT-MOC flux solver options [2]. The two

kinds of assemblies are self-shielded separately, with fine structure method and the multicell model with

reflective boundary conditions. Then, the TDT-MOC calculation is performed on the cluster, with the

same boundary conditions. Finally, the control rod is homogenized and we generate the homogenized

condensed self-shielded cross sections for the central zone.

Figure 4. : Cluster-type representation for PWR control rod calculation (a). The central part corresponds

to the control rod assembly with a refine spatial mesh (b), and peripheral zones are fissile assemblies.

3.2. Core Representation

In the current APOLLO3

®

-PWR calculation scheme, at the core calculation step, all assemblies are

homogenized radially without requiring equivalence, and only axial heterogeneities are considered

(depending on control-rod insertion). In the nominal configuration, this representation is acceptable since

the fissile assemblies’ local effects have an insignificant impact on the core reactivity. However, in the rod

inserted assembly configurations, this is not necessarily the case, especially with thermal/epithermal

strong absorbers (B4C/AIC/Gd) control rod assemblies.

In the classical PWR control rod assemblies, there are around twenty control rods. In Figure 4b for

example, those control rods are distributed regularly all over the assembly. With this distribution, we can

distinguish two regions: a central zone, delimited by the eight central control rods, and a peripheral one.

Because of this division control rod shadowing (or screening) effects varying from the periphery to the

central part occur.

When a neutron enters a control rod assembly, it has a great chance of being absorbed by the peripheral

control rods. Only few neutrons pass through the peripheral zone and are absorbed by central control rods.

Hence, central control rods “see” a different neutron spectrum than peripheral ones, in other words,

central control rods are shadowed by peripheral ones.

When control rod assemblies are homogenized, these phenomena aren’t taken into account in the core

calculations. To fix this problem, we propose a partial homogenization of the control rod assemblies,

which will consist on dividing them into nine regions, including the central zone as shown in Fig. 5.

(7)

Figure 5. : Partial Homogenization of a control rod assembly (control rods are in orange).

4. PWR CORE CALCULATIONS WITH APOLLO3®

4.1. Presentation of the PWR Core

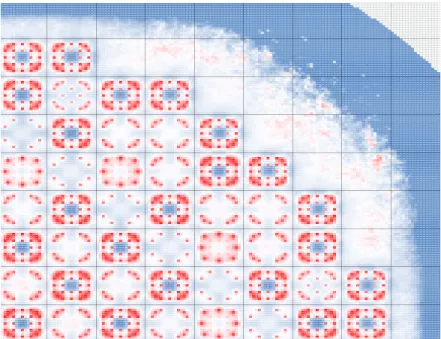
The studied reactor core is a typical 900 MWe PWR as represented in Fig. 6a.

Figure 6.a : PWR reactor core, modelled with TRIPOLI-4

®

(a) or APOLLO3

®

(b)

In the reactor core there are seven types of Uranium oxides fissile assemblies, differing by their

enrichments, the number of Pyrex rods and the type of control rod (black or gray ). In total, there are three

types of control rod assemblies, named U1B, U1G and U3B. U1B and U1G are the same assemblies, but

U1G contains gray control rods, whereas U1B has black control rods.

The two steps lattice (2D)/core (3D) calculations are performed as follows: first, the self-shielded

homogenized and collapsed cross sections are produced for each assembly, with control rod inserted or

withdrawn. Then, the core calculation is launched using the MINARET flux solver. It is performed with a

radial mesh of 7 cm and an axial mesh of 5 cm, and lasts 725h (30h on 24 processors ), for a memory cost

of 7 Go (21 Go on 24 processors). The radial reflector is represented as a cartesian lattice of homogenized

assemblies (cf. Fig. 6b) consistent with the cluster model used in the lattice calculation (cf. Fig. 3).

(8)

The reference Monte-Carlo calculation is performed on the full heterogeneous core (cf. Fig. 6a) with

TRIPOLI-4®, following 1 billion neutrons histories and reaching a precision better than 4 pcm (1σ) on

k_∞. The calculation lasts 328h (14h on 24 processors).

Table II. : APOLLO3-PWR calculation scheme results (keff and control rod efficiency).

Nominal

Rod inserted

Efficiency

∆𝝆

TRIPOLI-4

®

1.06740

0.90549

-16752 pcm

APOLLO3

®

1.06848

0.89759

-17819 pcm

∆𝝆 (pcm) or 𝜹(∆𝝆) (%)

+ 95pcm

- 973pcm

6.4 %

In the nominal configuration, the APOLLO3

®

reference calculation scheme is accurate against

TRIPOLI-4

®

, even if there is still room for improvement. For example, we could advantageously replace the fine

structure self-shielding method by the subgroup method with 361 energy groups or use the MOC-3D o

generate axial reflector cross sections as shown in papers [6][7] .

In the rod inserted configuration, the bias is not satisfying and the reactivity is significantly (clearly)

underestimated by APOLLO3®. In order to seek the origin of this bias, we will use the bias

decomposition.

4.2. The bias decomposition method

The bias decomposition method consists of dividing the global bias (resulting of the comparison of

APOLLO3

®

and TRIPOLI-4

®

) into separate biases, all of which represent an approximation. This method

requires the use of multi-group TRIPOLI-4

®

calculations using homogenized self-shielded cross-sections

coming from APOLLO3

®

lattice calculations (details of this decomposition/breakdown of model biases

can be found in paper [8]). This type of calculation will be noted T4 XS AP3.

In this part, we will consider two kinds of approximation for the core calculation: the flux solver and the

impact of lattice approximations on core results. To evaluate the impact of flux solver, a comparison of

calculations with identical self-shielded cross sections is required. Thus, the flux solver bias is determined

by measuring the discrepancy between the APOLLO3

®

calculation and T4 XS AP3. On the other hand, to

evaluate the impact of lattice approximations, a comparison with identical transport method is required.

This bias is calculated by comparing the TRIPOLI-4

®

calculation with T4 XS AP3.

Table III. : Bias decomposition of the studied PWR core for nominal and rod inserted configurations.

Nominal

Rod inserted

Global bias (pcm)

+ 95

- 973

MINARET (pcm)

+ 2

- 75

Lattice Approximations (pcm)

+ 93

- 898

Lattice approximations are the major contributors of the global bias (90 %). To determine which

assemblies are responsible of this discrepancy, we can separate the lattice approximations into assembly

biases, corresponding to the contribution of each assembly.

To do so, in the T4 XS AP3 calculation, we replace a homogenized assembly (with AP3 cross sections) by

a heterogeneous one, with its original material compositions. We then compare the result of this

calculation with the original T4 XS AP3. The measured bias is then the lattice approximation bias induced

by the replaced assembly.

(9)

Table IV. : Impact of each assembly on global bias for the studied PWR core in the rod inserted

configuration. Location for each assembly can be found in Fig. 6b.

assembly

Impact (pcm)

U1B

- 875

U1G

- 92

U3B

- 201

Others

+ 37

Axial Reflectors

+ 165

Radial Reflector

+ 15

Table 4 shows that control rod assemblies are responsible of the main discrepancy in reactivity between

APOLLO3

®

and TRIPOLI-4

®

in the rod inserted configuration. We also notice that the axial reflector bias

is non negligible due to the two-step calculation process (radial then axial calculation). The use of

MOC-3D [7] shall reduce this bias, permitting us to perform a direct calculation of both axial reflectors.

4.3. Validation of the new control rod assembly representation at lattice level

In order to validate the new representation, we need to assess its accuracy by comparing its results to

reference Monte-Carlo ones. To do so, we compare the infinite multiplication coefficient resulting from

an APOLLO3® assembly calculation for both representations defined consistently in Monte-Carlo

calculation. The reference Monte-Carlo calculation is performed with TRIPOLI-4

®

and 1 billion neutron

histories leading to a precision better than 4 pcm (1 sigma) on k infinity. The results are given in Table 5

for the three control rod assemblies with the new cluster type representation.

Table VI. : Reactivity discrepancies for control rod assembly calculations with the cluster-type

representation

U1B

U1G

U3B

TRIPOLI-4

®

1.05498

1.06990

1.21936

APOLLO3

®

1.05235

1.06852

1.21692

∆𝝆 (pcm)

- 236

- 121

- 165

The previous isolated representation gave poor results regarding reactivity discrepancies, especially with

black control rods. With the new cluster-type representation, reactivity biases are more acceptable.

However, the calculation cost increases significantly: the calculation time goes from 25 min to 4.5h, and

the memory cost goes from 2.1 Go to 25 Go.

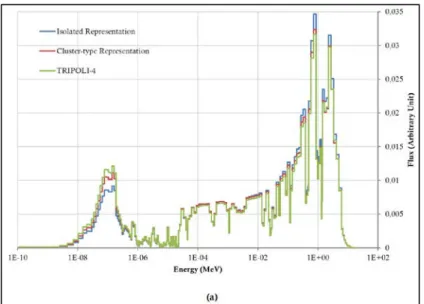
To measure the benefits of this new modeling regarding core calculations, we compare neutron flux

spectrum in the control rods. The reference flux spectrum results from a TRIPOLI-4

®

core calculation,

and is compared to the averaged flux spectrum measured in a U1B assembly (cf. Fig. 7).

The new cluster-type modeling is more representative of the core situation; especially in the thermal

bump (discrepancy to TRIPOLI-4

®

goes from -25 % to -10 % at 0.1 eV). Moreover, the global behavior

in the fast zone of the spectrum is improved. However, there are still some remaining biases in the

resonance domain, especially for

238

U resonance, at 6.63 eV and 20.8 eV.

4.4. Impact of control rod assembly representation on Core calculations

The final goal of this new representation is to improve APOLLO3

®

core calculation accuracy against

TRIPOLI-4® reference calculations, when control rods are fully inserted. Indeed, the control rod

(10)

representation has no effect in the nominal configuration where control rods are fully removed (bias of +

95 pcm with the reference calculation scheme).

In Table 7, we present the discrepancies between TRIPOLI-4

®

and APOLLO3

®

core calculations of the

studied PWR, with control rods fully inserted:

-

Calculation 2: we use the Cluster-type representation for lattice calculation, with a complete

homogenization of control rod assemblies for core calculation;

-

Calculation 4: we use the Cluster-type representation for lattice calculation, and the

semi-heterogeneous (3x3 zones) modeling of control rod assemblies for calculation.

Figure 7. : 281 groups control rod assembly spectra comparison

Table VII. : Impact of control rod assemblies representation in APOLLO3

®

for the studied PWR core

calculation (TRIPOLI-4

®

reference: k

eff

= 0.90549)

Calculation

Number

Assembly

Representation

Core

Representation

APOLLO3

®

∆𝝆 (pcm)

𝜹(∆𝝆) (%)

2

Cluster-Type

Homo.

0.90233

- 387

2.9

4

Cluster-Type

Semi-Het.

0.90533

- 20

0.7

Compared to the standard APOLLO3

®

-PWR reference calculation scheme (Table II), we see here a clear

improvement in the reactivity and reactivity effects predictions using cluster-type models. Thanks to the

semi-heterogeneous (3x3 zones) modeling, the accounting of the shadowing effects leads to a 700 pcm

reactivity gain and less than 1% remaining bias concerning the control rod efficiency.

In Figure 9a, we plot the macroscopic fission rate’s radial profile (see X-axis in Figure 8) in a control rod

assembly for core calculations 2 and 4 (calculations 1 and 3 correspond to isolated control rod assembly

representations leading to results quaoted in Table II and IV). We compare those profiles with

TRIPOLI-4

®

macroscopic fission rates radial profile in a control rod assembly placed in the center of the core.

(11)

Figure 8. : 2 Axes for fission rate plotting (cf. Fig. 9)

Figure 9. : X-axis fission rates profiles (a) and comparison between X-axis and diagonal profiles (b).

Plot (a) shows that the macroscopic fission rate profile shape for the lattice calculation is consistent with

the TRIPOLI-4

®

one. The values are different since the incoming flux is different for the two calculations.

Concerning the core calculations, we see that the macroscopic fission rate profile for Calculation 2 does

not fit with the TRIPOLI-4

®

profile, since the depression behind peripheral control rods (CR1) is not

observed. The semi-heterogeneous modeling fixes this issue. However, the increase of the fission rate in

the central zone is not described, since this part is homogenized (a representation cell by cell should be

useful to avoid this problem but leads to more demanding computer resources for the core calculations).

Plot (b) stresses the interest of dividing the assembly into 9 zones, rather than in 2 zones (a central one

and a peripheral one). The fission rate is higher in the corners than in the sides, since there is less

absorption in the corners. Moreover, the corners are surrounded by three fissile assemblies, whereas the

sides are only next to one fissile assembly. Finally, the fission rate profile in the central zone is the same

for every direction.

As shown in Table 8, the combination of the two representations (Calculation 4) offers the best accuracy

on k

eff

(and control rod reactivity effects), with a very low bias against TRIPOLI-4

®

(- 20 pcm).

Furthermore error compensations between lattice and core calculations are non-significant for this

calculation.

Figure

Figure 1. : APOLLO3 ®  calculation scheme.
Table I. : APOLLO3 ® -PWR Calculation Scheme .
Figure 3. : Representation of the radial reflector for the studied PWR core.
Figure 4. : Cluster-type representation for PWR control rod calculation (a). The central part corresponds  to the control rod assembly with a refine spatial mesh (b), and peripheral zones are fissile assemblies
+5

Références

Documents relatifs

En 2005, un peu plus de huit candidats sur dix visant un diplôme de niveau V se présentaient à des certifications dans le domaine sanitaire et social (tableau 1) : DPAS

Ten non-disabled subjects performed a reaching task, while wearing an elbow prosthesis which was driven by several interjoint coordination models obtained through different

Nous pouvons reconnaître que choisir 2 boules simultanément d’une urne de 4 boules est une appli- cation injective où l’ordre n’est pas important.. Donc l’ordre aura

À cet égard, les soins du développement constituent un regroupement d’interventions de soins qui visent à favoriser le développement du prématuré hospitalisé à

Abstract: This study reports the removal of amoxicillin (AMX) in aqueous media using the electro-Fenton process in the presence of a graphite cathode recovered from used

The first one is used to prove just one property, the second to prove a list of mutually dependent properties(like.. the proof of periodicity in the example below). Inputs of

This experiment allowed us to quantify order and disorder in a configuration, using a geometrical measure of stacking and a mechanical measure of effective suscep- tibility,

beginning of the polymerization; linear growth with conversion; lower polydispersities), additional experiments were carried out with this compound at higher temperatures