HAL Id: hal-01061241
https://hal-enac.archives-ouvertes.fr/hal-01061241
Submitted on 5 Sep 2014
HAL is a multi-disciplinary open access
archive for the deposit and dissemination of
sci-entific research documents, whether they are
pub-lished or not. The documents may come from
teaching and research institutions in France or
abroad, or from public or private research centers.
L’archive ouverte pluridisciplinaire HAL, est
destinée au dépôt et à la diffusion de documents
scientifiques de niveau recherche, publiés ou non,
émanant des établissements d’enseignement et de
recherche français ou étrangers, des laboratoires
publics ou privés.
Measuring the interactions between air traffic control
and flow management using a simulation-based
framework
Thibault Lehouillier, Jérémy Omer, François Soumis, Cyril Allignol
To cite this version:
Thibault Lehouillier, Jérémy Omer, François Soumis, Cyril Allignol. Measuring the interactions
be-tween air traffic control and flow management using a simulation-based framework. 2014.
�hal-01061241�
Measuring the interactions between air traffic control and flow management using a simulation-based framework
T. Lehouillier, J. Omer, F. Soumis, C. Allignol G–2014–51
July 2014
Les textes publi´es dans la s´erie des rapports de recherche Les Cahiers du GERAD n’engagent que la responsabilit´e de leurs auteurs.
La publication de ces rapports de recherche est rendue possible grˆace au soutien de HEC Montr´eal, Polytechnique Montr´eal, Universit´e McGill, Universit´e du Qu´ebec `a Montr´eal, ainsi que du Fonds de recherche du Qu´ebec – Nature et technologies. D´epˆot l´egal – Biblioth`eque et Archives nationales du Qu´ebec, 2014.
The authors are exclusively responsible for the content of their research papers published in the series Les Cahiers du GERAD. The publication of these research reports is made possi-ble thanks to the support of HEC Montr´eal, Polytechnique Montr´eal, McGill University, Universit´e du Qu´ebec `a Montr´eal, as well as the Fonds de recherche du Qu´ebec – Nature et tech-nologies.
Legal deposit – Biblioth`eque et Archives nationales du Qu´ebec, 2014.
GERAD HEC Montr´eal 3000, chemin de la Cˆote-Sainte-Catherine Montr´eal (Qu´ebec) Canada H3T 2A7
T´el. : 514 340-6053 T´el´ec. : 514 340-5665 [email protected] www.gerad.ca
between
air
traffic
control
and flow management using a
simulation-based framework
Thibault Lehouillier
aJ´
er´
emy Omer
aFran¸
cois Soumis
aCyril Allignol
ba GERAD & Polytechnique Montr´eal, Montr´eal (Qu´ebec)
Canada, H3C 3A7
b Ecole Nationale de l’Aviation Civile Campus Toulouse,´
31055 Toulouse Cedex 4, France
[email protected] [email protected]
[email protected] [email protected]
July 2014
Les Cahiers du GERAD G–2014–51
Abstract: Air traffic in Europe is predicted to increase considerably over the next decades. In this context, we present a study of the interactions between the costs due to ground-holding regulations and the costs due to en-route air traffic control. We describe a traffic simulator that considers the regulation delays, aircraft trajectories, and air conflict resolution. Through intensive simulations based on traffic forecasts extrapolated from French traffic data for 2012, we compute the regulation delays and avoidance maneuvers according to two scenarios: the current regulations and no regulations. The resulting cost analysis highlights the exponential growth in regulation costs that can be expected if the procedures and the airspace capacity do not change. Compared to the delay costs, the costs of the air traffic control are negligible with or without regulation. The analysis reveals the heavy controller workloads when there are no regulations, suggesting the need for regulations that are appropriate for large traffic volumes and an improved ATC system. These observations motivate the design of a third scenario that computes the sector capacities to find a compromise between the increase in the delay costs due to ground-holding regulations and the increase in the controller workload. The results reveal the sensitivity of the delay costs to the sector capacity; this information will be useful for further research into ATM sector capacity and ATC automated tool design. Finally, because of the growing interest in the free flight paradigm, we also perform a traffic and cost analysis for aircraft following direct routes. The results obtained highlight the fuel and time savings and the spatial restrictions that companies use to avoid congested areas.
1
Introduction
1.1
Context and main concepts
Delays in air traffic can arise from many sources, including the regulations required to avoid congestion on the network. In Europe in 2012, the average delay due to regulations reached 1.15 minutes per flight [1]. According to the latest long-term forecast issued by EUROCONTROL [2], traffic volumes are predicted to increase by 20% to 80% between 2012 and 2035, resulting in much higher congestion around and between airports and increased regulation delays. Joint European projects that are currently underway aim to remodel air traffic management (ATM) in Europe to adapt it to future traffic flow characteristics. Many of these projects are included in the SESAR (Single European Sky ATM Research) program [3]. One of SESAR’s main objectives is to set up trajectory-based management, where companies and regulation units negotiate trajectories that satisfy both their economic objectives and congestion constraints. Such a design would allow pilots to fly under the free flight rules [4], following paths that are more beneficial than predefined routes that form a network structure.
Currently, the European ATM system is composed of several layers with different time horizons, aiming to safely and efficiently handle the flow of aircraft. A few months in advance, the airspace management filter is triggered. It defines the structure of the route network and the navigation procedures. The airspace is divided into control sectors, which are three-dimensional regions that are each the responsibility of a pair of controllers.
To maintain the workload of the controllers at an acceptable level, each control sector has a capacity, defined as the maximum number of aircraft entering the sector in one hour (typically, between 20 and 40 aircraft per hour for a control sector in Europe). Airspace capacity estimation methods have already been developed. A study estimating the airspace capacity in Europe as a combination of different types of air traffic movement in different sectors has been performed [5]. More recently, a simulation-based approach has been designed by Steiner and Krozel [6]. They used ensemble-based weather forecasts to generate probability distributions of airspace capacities. Their model has been extended by Clarke et al. [7], who developed a more general model including an air traffic control (ATC) module and capturing traffic-related uncertainties. However, they did not analyze the costs incurred or the impact on the network.
From a few days to a few hours in advance, air traffic flow management (ATFM) regulates the traffic to enforce the sector capacities. This task is assigned to the Central Flow Management Unit (CFMU), whose work relies on traffic predictions, built on pilots’ flight plans. During peak periods, the CFMU issues ground-holding regulations for flights over congested areas of the airspace by automatically assigning take-off slots via the computer assisted slot allocation (CASA) algorithm, which works in a greedy first-planned, first-served fashion. The ground-holding problem (GHP) was defined in 1994 by Vranas et al. [8] and has been widely studied since. The techniques include stochastic models [9] and shortest path problems [10]. Since congestion in the United States is primarily related to important hubs whereas in Europe both airspace and airport capacities can cause congestion issues, most studies focus on European traffic. For instance, the difficulties and potential improvement points of European ATFM have been studied in [11].
ATC aims to manage air traffic on a short-term horizon. The main tasks of the controllers are to monitor the traffic and to keep the aircraft separated by at least 5 NM horizontally or 1000 ft vertically, as depicted in Figure1. To resolve conflict situations, i.e., to avoid predicted losses of separation between two or more aircraft, the controllers issue maneuvers to the pilots. These maneuvers involve changes in the speed, heading, or flight level, and they induce costs due to fuel consumption and delays.
A study of traffic complexity [12] states that if the traffic becomes twice as dense, no controller will be able to monitor and issue maneuvers without an automated tool, which indicates the need for optimization in this domain. Automated ATC has been thoroughly studied, and numerous algorithms have been developed. The literature on aircraft conflict detection and resolution is vast; the techniques applied include mixed integer linear programming [13, 14], nonlinear programming [15, 16], metaheuristics [17, 18], semidefinite programming [19], and force field models [20]. See [21] for a comprehensive survey.
T. Lehouillier et al. / Transportation Research Part B XX (2014) 1–20
2
5NM 1000 ft
Figure 1: Vertical and horizontal separation. No other aircraft can be inside the cylinder at the same time.
to adapt it to future traffic flow characteristics. Many of these projects are included in the SESAR (Single European
Sky ATM Research) program [3]. One of SESAR’s main objectives is to set up trajectory-based management, where
companies and regulation units negotiate trajectories that satisfy both their economic objectives and congestion
con-straints. Such a design would allow pilots to fly under the free flight rules [4], following paths that are more beneficial
than predefined routes that form a network structure.
Currently, the European ATM system is composed of several layers with different time horizons, aiming to safely
and efficiently handle the flow of aircraft. A few months in advance, the airspace management filter is triggered. It
defines the structure of the route network and the navigation procedures. The airspace is divided into control sectors,
which are three-dimensional regions that are each the responsibility of a pair of controllers.
To maintain the workload of the controllers at an acceptable level, each control sector has a capacity, defined as
the maximum number of aircraft entering the sector in one hour (typically, between 20 and 40 aircraft per hour for a
control sector in Europe). Airspace capacity estimation methods have already been developed. A study estimating the
airspace capacity in Europe as a combination of different types of air traffic movement in different sectors has been
performed [5]. More recently, a simulation-based approach has been designed by Steiner and Krozel [6]. They used
ensemble-based weather forecasts to generate probability distributions of airspace capacities. Their model has been
extended by Clarke et al. [7], who developed a more general model including an air traffic control (ATC) module and
capturing traffic-related uncertainties. However, they did not analyze the costs incurred or the impact on the network.
From a few days to a few hours in advance, air traffic flow management (ATFM) regulates the traffic to enforce the
sector capacities. This task is assigned to the Central Flow Management Unit (CFMU), whose work relies on traffic
predictions, built on pilots’ flight plans. During peak periods, the CFMU issues ground-holding regulations for flights
over congested areas of the airspace by automatically assigning take-off slots via the computer assisted slot allocation
(CASA) algorithm, which works in a greedy first-planned, first-served fashion. The ground-holding problem (GHP)
was defined in 1994 by Vranas et al. [8] and has been widely studied since. The techniques include stochastic models
[9] and shortest path problems [10]. Since congestion in the United States is primarily related to important hubs
whereas in Europe both airspace and airport capacities can cause congestion issues, most studies focus on European
traffic. For instance, the difficulties and potential improvement points of European ATFM have been studied in [11].
ATC aims to manage air traffic on a short-term horizon. The main tasks of the controllers are to monitor the
traffic and to keep the aircraft separated by at least 5 NM horizontally or 1000 ft vertically, as depicted in Figure 1. To
resolve conflict situations, i.e., to avoid predicted losses of separation between two or more aircraft, the controllers
issue maneuvers to the pilots. These maneuvers involve changes in the speed, heading, or flight level, and they induce
costs due to fuel consumption and delays.
A study of traffic complexity [12] states that if the traffic becomes twice as dense, no controller will be able to
monitor and issue maneuvers without an automated tool, which indicates the need for optimization in this domain.
Automated ATC has been thoroughly studied, and numerous algorithms have been developed. The literature on
aircraft conflict detection and resolution is vast; the techniques applied include mixed integer linear programming
[13, 14], nonlinear programming [15, 16], metaheuristics [17, 18], semidefinite programming [19], and force field
models [20]. See [21] for a comprehensive survey.
Direct routing has received little attention, although it has been shown to have economic advantages for airlines:
it leads to shorter flight times and reduced fuel costs [22].
1.2. Critical analysis and contribution statement
The performance of automated conflict solvers depends on the number and complexity of the conflicts, which
are related to the sector capacities. Despite the diversity of the literature, we have not found any work involving
2
Figure 1: Vertical and horizontal separation. No other aircraft can be inside the cylinder at the same time.
Direct routing has received little attention, although it has been shown to have economic advantages for airlines: it leads to shorter flight times and reduced fuel costs [22].
1.2
Critical analysis and contribution statement
The performance of automated conflict solvers depends on the number and complexity of the conflicts, which are related to the sector capacities. Despite the diversity of the literature, we have not found any work involving automated conflict resolution and the extrapolation of real traffic data to predict future traffic. The studies in [14, 23] base their computational tests on historical traffic data, but they do not provide a thorough analysis of the costs and the interactions with the other layers of ATM. A study involving an estimation of future traffic is fundamental for a better understanding of future situations and their inherent difficulties. It is also important to study the nature of the relationship between the costs incurred by airports and the en-route regulations. An understanding of the economic impact would allow us to take advantage of these interactions.
In this paper, we present a simulation framework that allows us to study the relationship between the ATFM and the ATC. We focus on the ground-holding and operational costs and the controller workload in a context of increasing traffic. Using the reference values of [2,24], we develop a procedure to forecast the traffic until 2035 using French data for 2012. Our model provides an excellent platform for the evaluation of automated tools for air conflict resolution, since it allows the evaluation of a variety of traffic scenarios, both independently and jointly. We apply three different ATFM regulation scenarios to the generated traffic, to study how the ground-holding affects the conflict resolution and to find a compromise between high regulation costs and heavy workloads. To this end, we perform a state-of-the-art estimation of the delay costs and identify relevant measures of the workload, each related to a different subtask: monitoring, coordination, or communications.
We also perform a study of direct routes. This provides important information on the ATM costs since longer, indirect routes are usually the result of the route network and the weather conditions. The network structure of the airspace becomes irrelevant when we consider direct routes. As a consequence, the current regulations no longer apply. Taking this into account, we use our simulation framework to study the conse-quences in terms of fuel gain and air conflict resolution. The results provide insight into how companies use restrictions to adapt to the traffic.
Moreover, our study highlights the geographic regulations that reduce congestion in some heavily loaded sectors. More precisely, we obtain insight into the effect of the number and complexity of conflicts.
2
Description of the simulation algorithms
The study of the interactions between planning and control requires several automated procedures: a trajec-tory simulator, a regulation algorithm, and a conflict solver. Figure2 provides an overview, with references to the sections in which we discuss each component.
Traffic increase procedure (2.1) Regulation algorithms (2.2) Real traffic data (3.3) Direct-route construction (2.4) Increase factors (3.1) Trajectory simulator Conflict resolution algorithm (2.5) Measures (3.5) Simulator (2.3)
Figure 2: Simulation modules.
2.1
Traffic increase
To increase the traffic to reflect the available forecasts, we used a procedure parametrized by a multiplying factor. Given an increase factor f (e.g., f = 0.4 for a 40% increase) and an initial set T of n flights, n+= f ×n
new flights are created. To create a new flight, we randomly choose a flight in T and create a copy with a small random modification to its departure time. The random shift typically lies in [−15, −1] ∪ [+1, +15] minutes to avoid the exact duplication of the flight. Excluding the interval (−1, 1) ensures aircraft separation, since an offset of one minute for aircraft taking off at 150 kts ensures a separation of 2.5 NM.
The main advantage of this method is that it maintains a similar distribution of the departure times over a day of traffic. Indeed, the random shift tends to broaden and flatten the peaks of the distribution, hence giving a conservative lower bound on the actual distribution. A more realistic forecast would be based on a market study carried out on a global scale, but such information is not yet available.
A drawback of duplicating flights in this fashion is the creation of conflicts with pursuing aircraft. De-pending on the random shift, the process may lead to flights that follow each other very closely. To overcome this, we impose a regulation at each airspace entry point to enforce the necessary separation between the flights.
2.2
Regulation
The regulations imposed by the CFMU affect the flights crossing regulated areas. These areas are determined on a daily basis by experts, depending mainly on the expected traffic. In a given regulated area, the departure slots are allocated following a first planned, first served scheme, meaning that there are no restrictions on the order in which aircraft enter the area.
Figure 3 gives a flowchart of the algorithm described in [25] for a given regulated area. For each such area, CASA maintains a slot allocation list, which is a series of consecutive slots of equal length covering the
Init: build an empty slot allocation list Pre-allocation phase: new flight
plan for flight f is received; Build the list S of temporarily allocated slots later than ET O(f )
Evaluate s as the slot of S closest to ET O(f ) s is already allocated to f0 Temporarily allocate s to f ET O(f ) ≤ ET O(f0) Temporarily allocate s to f Allocate the next available slot to f0
At a fixed time before depar-ture, definitely allocate s to f
S ← S \ s no
yes
yes
no
Figure 3: CASA procedure for a regulated area.
regulation period. For instance, a two-hour period with a capacity of 30 results in an allocation list with 60 two-minute slots. A flight crossing this area has a priority linked to its estimated time over (ETO) the point where it enters the area: the earlier the ETO, the higher the priority. It is important to notice the cascade effect of this mechanism. Reallocating slots to flights can have consequences for other flights that must also be reallocated, hence increasing the number of delays in the network. One limitation of this algorithm is the independent regulation of each area. If a given flight is regulated in two or more areas, its departure slot must satisfy the most restrictive regulation, which may violate constraints in the other areas.
We implement the CASA algorithm in our simulation engine. The exact regulation areas are unavailable, so they are assumed to coincide with the 2012 control sectors. This assumption differs from the CFMU’s procedure in which the areas are determined depending on factors such as weather conditions. Also, for the capacities we used nominal sector capacities from 2012, since we could not find more accurate data.
2.3
Trajectory simulation
The flight simulations are performed by the Complete Air Traffic Simulator (CATS) [26]. CATS is an en-route air traffic simulation engine based on a time-discretized execution model, i.e., the position and velocity vectors of every aircraft are computed at times separated by a period τ set by the user. The aircraft specifications and performance, such as the horizontal and vertical speeds and the fuel consumption, are extracted from the Base of Aircraft Data (BADA) summary tables based on the total energy model [27]. The simulation engine processes data corresponding to real flight plans and gives detailed outputs including traffic
statistics, sector occupation at any time, and a thorough examination of the conflicts: geometry, duration, and conflict-resolution statistics.
2.4
Direct routes
Our simulation engine includes a module transcribing a given traffic scenario into its equivalent in direct routing. The aircraft fly along the orthodromic path, i.e., they take the shortest path between origin and destination on the ellipsoidal Earth satisfying the World Geodesic System 84 (WGS84) standards. A more sophisticated approach to direct routing would be to choose the path that optimizes fuel consumption while considering weather conditions. However, the orthodromic path provides a good lower bound on the fuel gains.
For a realistic comparison between current traffic and direct routing, we start by increasing the current traffic and then we convert it into traffic with direct routes. This allows us to compare the same traffic under two different paradigms.
The use of direct routes introduces questions about the notion of an air sector. The network of predefined routes is designed to provide sectors that are manageable for air traffic controllers. With direct routes this network does not exist, making it difficult to consider sectors. As a consequence, the current ground-holding regulations, which rely on sector occupancy, no longer seem relevant. These observations lead us to simulate direct traffic without the ATFM regulations. It is still possible to get insight into the traffic physiognomy in terms of traffic flow and air conflicts.
2.5
Conflict resolution
Our goal is not to study the performance of a particular algorithm or to prove that it is suitable for practical implementation. The conflict resolution module is used only to estimate the costs incurred by the maneuvers that are necessary to maintain the aircraft separation. It is impossible to precisely correlate the costs of the maneuvers designed by an automated conflict solver with those selected by a controller, but the order of magnitude is the same.
The conflict resolution algorithm designed by Durand et al. in [17] is used in the simulations because it is already embedded in CATS. In the first step, conflicts are detected over a 20-minute horizon, and they are aggregated into independent clusters. For instance, if aircraft A conflicts with aircraft B and aircraft B conflicts with aircraft C, then aircraft A, B, and C are aggregated into the same cluster. Each cluster is then deconflicted independently, using a genetic algorithm.
The genetic algorithm is based on the concepts described by Goldberg [28]. The principle is to manipulate a population where each individual is a candidate solution to the problem. The population is composed of n possible trajectories, one per aircraft. For a given aircraft, the possible trajectories correspond to the discretized set of permissible maneuvers: 7 heading-change values between −30◦ and 30◦, 5 speed changes between −6% and +3%, and, incidentally, altitude maneuvers corresponding to climb interruptions and descent anticipations.
The population is initialized with randomly generated maneuvers for each aircraft. At each step, the quantity to optimize, called the fitness, is computed for each individual, and the best individuals are selected according to their fitness. These individuals are used as inputs to the cross-over and mutation operators that aim to generate new individuals in the current population.
3
Simulation input
3.1
Traffic predictions
Medium- and long-term traffic forecasts are regularly issued by EUROCONTROL. Based on a thorough study of current traffic trends and statistics and recent air-industry-related events, the latest mid-term forecast
provides predictions for 2013 to 2019 [24], while the long-term forecast extends the analysis to 2035 [2]. Since the predictions depend on the evolution of the global economic situation, several scenarios are considered, and annual growth rates are estimated for each. Table1 summarizes the long-term forecast [2].
Table 1: Summary of traffic forecast for Europe to 2035.
Annual growth
Scenario Global Regulated Happy Fragmented Growth Growth Localism World 2012–2019 3.4% 2.3% 2.3% 0.9% 2019–2020 3.7% 2.2% 1.5% 0.6% 2021–2025 2.5% 1.9% 1.5% 0.8% 2026–2030 2.2% 1.5% 1.2% 0.4% 2031–2035 1.9% 1.2% 1.1% 0.7%
The scenarios listed in Table 1 correspond to different assumptions about the future. Global Growth and Fragmented World depict two extremes situations in which the economic and political circumstances allow flourishing exchanges or cause a recession. In our computational tests, the increased traffic reflects the in-between Regulated Growth scenario, which is more likely. This scenario represents average economic growth along with regulations to address environmental and sustainability issues. A sufficient range of traffic-increase rates is then achieved by focusing on six specific years between 2014 and 2035. These years and the corresponding traffic rates are given in Table2.
Table 2: Traffic predictions with regulated growth.
Year 2014 2017 2020 2025 2030 2035 Increase +5% +12% +20% +32% +42% +50%
3.2
Airspace capacity
CASA needs the capacity of each regulated area. As noted earlier, we used the nominal capacities of the sectors covering the French territory. We found no complete study providing an estimation of the evolution of these capacities. Moreover, our goal is to estimate the impact of automated conflict resolution, and this should not have a strong dependence on the capacity. For simplicity, we run the simulations with the following three scenarios:
• S1– the capacities remain constant;
• S2– the capacities are deleted: there is no regulation;
• S3– the capacities satisfy a condition corresponding to a controlled growth in the delay costs.
S1and S2 correspond to two extreme situations: in S1nothing new is designed to handle greater traffic, and
in S2the traffic flows freely without any constraint. Our study of S1 will give a better understanding of the
need to modify the current procedures. Focusing on S2 will enable us to quantify the effect of a worst-case
scenario from the ATC point of view. Indeed, S2 should lead to the worst possible situation in terms of
conflicts and the controller workload. Since the design of S3 is motivated by the results given in Section4,
we describe this scenario in Section5.
3.3
Choice of the reference historical data
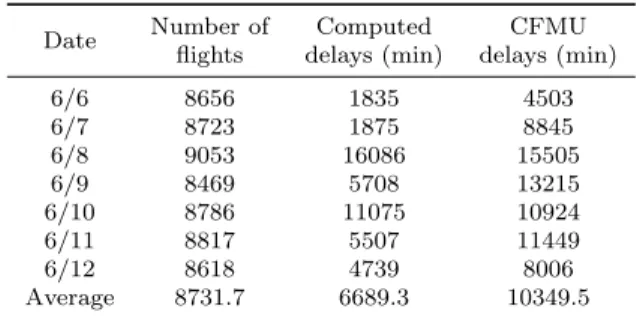
The study focuses on French traffic, because we were able to get traffic data and information on the sector capacities and geometry. Moreover, the French airspace is dense because it is a crossroads of various European hubs. We use data for the 2012 traffic over France in our tests. The simulations focus on Friday, June 8th because it was a busy day for which the actual delays were close to the delays that we computed with the nominal sector capacities. For illustration, Table 3 gives the number of flights, the computed delays, and
Table 3: Traffic statistics for 6/6/2012 to 6/12/2012.
Date Number of Computed CFMU flights delays (min) delays (min)
6/6 8656 1835 4503 6/7 8723 1875 8845 6/8 9053 16086 15505 6/9 8469 5708 13215 6/10 8786 11075 10924 6/11 8817 5507 11449 6/12 8618 4739 8006 Average 8731.7 6689.3 10349.5
the actual CFMU delays for the week of June 6th to 12th. Although the numbers vary considerably, the computed data is valid since there is no extreme behavior. The flight volumes per day are similar. June 8th is the day with the greatest number of flights and the most delay. We choose this day to explore the difficulties related to the management of dense traffic.
3.4
Delay and maneuver costs
A study performed by EUROCONTROL [1] estimates that in 2012, ATFM delays in Europe cost e0.85 billion. For a given flight, the costs depend on a variety of factors, such as the operational conditions, the phase of flight where the delay occurs, the type and size of the aircraft, and the load factor. As a consequence, we need a large quantity of data for a thorough study of the cost model.
We focus on two main types of costs. First, we consider delays induced by maneuvers issued by the ATC. These costs depend on the maneuver model and on the air conflict solver used, since its performance will impact the commands issued. We observe again that if the traffic becomes twice as dense, no controller will be able to monitor and issue maneuvers without an automated tool [12]. Thus, a conflict solver is a valid tool for addressing the ATC costs. The planned maneuvers lead to extra fuel consumption. We use the model described in the BADA user manual [29] to compute the consumption, which depends mostly on the type, speed, and altitude of the aircraft. It is computed for three maneuvers: speed, heading, and altitude changes. Second, delay costs are introduced when the regulations lead to allocated slots that differ from the airlines’ preferred slots. Modeling these costs properly is a complex task; the passenger, crew, and maintenance costs must be taken into account. It is also important to study the consequences of a delay on the whole network: one delay will lead to further delays in the rotation that includes the delayed flight.
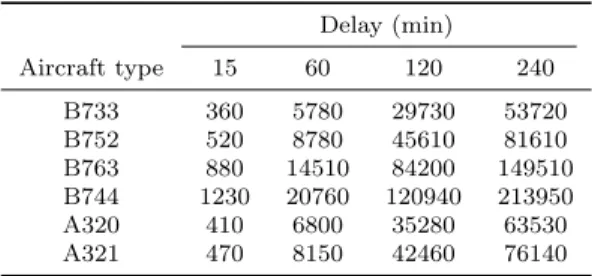
In the literature, passenger costs are usually divided into “hard” costs representing compensation costs such as the cost of rebooking passengers, and “soft” costs such as the cost of passengers switching to another airline because of recurring delays. Joint work on this topic between the University of Westminster and EUROCONTROL resulted in a series of articles published between 2004 and 2011. The cost per minute per passenger of ground and airborne delays due to ATFM is derived in [30]. In [31], Cook and Tanner estimate the airline delay costs as a function of the delay magnitude. This function is combined with fuel consumption and future emission charges to derive a cost-benefit trade-off during the ground and airborne phases. In [32], the authors focus on the costs related to delay propagation in the network. Those delays can be either rotational (i.e., related to flights within the rotation) or nonrotational. Using values extracted from [33], the authors derive cost values that depend on the rotation structure, the aircraft involved, and the magnitude of the delay. The results from the earlier articles are collected in [34], which gives reference values for the delay costs incurred at both the strategic and tactical levels. The report presents cost values for all the phases of a flight: at-gate, taxi, cruise extension, and arrival. The values are assigned under different scenarios (low, base, and high), for twelve different aircraft types. Sample costs are given in Table4 for the at-gate base scenario.
We use the costs that were computed under the base-case hypotheses in [34]. We also assume that companies ask for their preferred take-off slots. Thus, the slots allocated by CASA provide a valid estimate of the regulation-related delays.
Table 4: Tactical costs (euros, total) of ground-holding delay for different aircraft types. Delay (min) Aircraft type 15 60 120 240 B733 360 5780 29730 53720 B752 520 8780 45610 81610 B763 880 14510 84200 149510 B744 1230 20760 120940 213950 A320 410 6800 35280 63530 A321 470 8150 42460 76140
3.5
Measures of workload
The air traffic controllers’ workload primarily consists of four tasks: monitoring the sector, coordinating the traffic with adjacent sectors, communicating with pilots, and maintaining separation. These tasks are demanding, and it is crucial to determine the impact of increased traffic on the controller workload. We define several performance indicators for the scenarios described in Section3.2:
• the entering flow per hour for a sector, which is correlated with the monitoring and coordination; • the number of conflicts, which is related to the complexity of maintaining separation;
• the number of conflict-resolution maneuvers, which affects both the monitoring and communications; • a measure of the overcapacity per sector, OC(.), which impacts every indicator:
OC(s) = 24 X h=1 max {0; fs(h) − cs} 2 (1)
where csis a reference capacity value for sector s, and fs(h) is the entering flow of aircraft for sector s
in a given hour h.
OC(s) represents aggregated information on the overcapacity for sector s for a given regulation scenario. The greater the value of OC(s), the more effort required from the controller. Moreover, OC(s) tends to penalize situations with high peaks over a short period of time more than situations with lower peaks that last longer. This is consistent for a measure of the controller workload, because a short, high peak is much harder to handle than a lower, broad peak.
4
Impact of the ground-holding regulation
4.1
Impact on the entering flow per hour
The airspace surrounding Reims is particularly challenging in terms of traffic complexity: the control sectors are quite small, and they include routes that connect important European hubs such as London, Milan, Zurich, and Frankfurt. We focus on the KR sector, which is a busy sector in the Reims control zone. The entering flow is studied as a congestion measure for KR. Figure4displays this measure for different volumes of traffic, i.e., the current traffic and the traffic increased by 32%, 42%, and 50%. For each traffic volume, statistics are extracted for scenarios S1 and S2; in S1 the CASA regulation is based on the nominal sector
capacities of 2012, and in S2 there is no regulation. Another set of meaningful results related to OC(.) can
be found in Section5.
Figure 4 clearly indicates that the flow depends on the presence or absence of regulation. Without regulation, the entering flow distribution tends to aggregate into a peak over the period from 10 a.m. to 12 a.m., leading to a large overcapacity. A threshold on the controller workload may thus be distinguished. Indeed, for traffic volumes greater than +32%, the entering flow per hour may exceed the capacity by more than 12 flights without regulation. This would require a tremendous monitoring effort. This suggests that increased traffic needs to be handled with modified regulations or with automated tools that decrease the
12am 5am 10am 3pm 8pm 0 10 20 30 40 50 60 70 +0% with CASA (S1) +0% without CASA (S2) Capacity (a) +0%
12am 5am 10am 3pm 8pm
0 10 20 30 40 50 60 70 +32% with CASA (S1) +32% without CASA (S2) Capacity (b) +32%
12am 5am 10am 3pm 8pm
0 10 20 30 40 50 60 70 +42% with CASA (S1) +42% without CASA (S2) Capacity (c) +42%
12am 5am 10am 3pm 8pm
0 10 20 30 40 50 60 70 +50% with CASA (S1) +50% without CASA (S2) Capacity (d) +50%
Figure 4: Entering flow per hour for different traffic volumes in KR sector.
controller workload. On the other hand, if regulation is present, it controls the entering flow to prevent overcapacity. However, the capacity is still exceeded in several cases; this is because of the difficulties the CASA algorithm encounters when a flight is regulated in several sectors. A saturated capacity plateau can be seen, and increasing the traffic volume enlarges the plateau. Moreover, it is important to recall that CASA regulates the traffic by postponing flights. A drawback of this approach can be seen in the last blue column in Figure4(d): many flights are delayed between 9 p.m. and 10 p.m., leading to an entering flow of 40 flights, which is 5 flights over the declared capacity of 35 flights per hour.
4.2
Impact on the number of conflicts
In addition to the effects on the flow distribution, the regulation has an impact on the conflicts. Figure5
displays, for each traffic volume previously described, the total number of conflicts per day, along with the number of conflicts per day for different sectors, with and without CASA. The sectors represent different types of flow density: two dense sectors, three average sectors, and two sparse sectors.
Surprisingly, Figure 5(a)shows that the removal of the regulation does not imply a greater number of conflicts until a traffic volume of +20%. Beyond this approximate threshold, the number of conflicts without CASA increases faster than the number with CASA, leading to a 15% difference for a +50% traffic volume. This observation at the global scale can be paired with an observation at the sector level. The evolution of the number of conflicts with increasing traffic depends on the type of sector, as highlighted by Figures5(b)
+0% +5% +12% +20% +32% +42% +50% 0 1,000 2,000 3,000 With CASA (S1) Without CASA (S2) (a) Total +0% +5% +12% +20% +32% +42% +50% 0 50 100 ZU sector R4 sector R1 sector Y3 sector XH sector US sector KR sector (b) With CASA (S1) +0% +5% +12% +20% +32% +42% +50% 0 50 100 ZU sector R4 sector R1 sector Y3 sector XH sector US sector KR sector (c) Without CASA (S2) Figure 5: Comparison of the number of conflicts observed with and without CASA.
and 5(c). For the sparse and average sectors, the number of conflicts is similar whether or not CASA is applied. This observation suggests that the regulation has little effect on these sectors, except that it slightly reduces the minimum and maximum number of conflicts per day. Indeed, for low traffic densities, the nominal capacities are seldom saturated, so CASA has no effect on the flow distribution. On the other hand, for high-density sectors, the margin by which the number of conflicts without CASA exceeds the number with CASA grows with the traffic increase. This is because the nominal capacities are more saturated for high traffic densities. Thus, one of the regulation’s main benefits can be highlighted: to prevent overcapacity in different sectors, CASA smoothes the flow, spreading the number of conflicts over the day, as shown in Figure6. This also reduces the workload of the controllers, especially in monitoring and communications.
4.3
Cost analysis
The regulation delay and conflict-resolution costs are important aggregate indicators of the overall traffic complexity. These costs are computed as described in Section3.4and are displayed in Figures7(a)and7(b)
for scenarios S1 and S2. Clearly, there is no regulation cost in S2.
Figure7(a)suggests that the global costs resulting from the regulation algorithm vary exponentially with the traffic volume. This is a logical trend considering that the intensification of the traffic mainly affects the congested areas during peak periods. Moreover, the plateau effect highlighted in Figure4shows that the peak periods tend to be flattened and widened, which leads to larger and more expensive delays. This indicates that significant savings could be made by improving the regulation procedure, and it also emphasizes that this improvement is necessary to handle larger traffic volumes.
The expected disadvantage of suppressing the ground-holding regulations is that it would result in extra conflict-resolution costs. Without regulation, a larger traffic flow must be handled, which increases the number of conflicts and the resolution maneuvers issued in response. Figure 7(b) shows the deconfliction costs for scenarios S1and S2. These global costs are the sum of the costs of the different types of maneuvers
described in Section 3.4. Of these maneuvers, speed changes, which are seldom performed and relatively cheap, represent around 1% of the total cost. The remaining costs are equally divided between heading changes and altitude changes, which are more numerous and more expensive. The total costs are similar until the +32% traffic volume, where the conflict-resolution costs increase faster in S2 than in S1. This
results in 15% larger costs in S2 for a traffic volume of +50%. Although this is an important increase, the
conflict-resolution costs are much than the regulation-related costs: around e250 000 for conflict resolution versus e32 000 000 for ground-holding regulation. Thus, the extra costs necessary to handle the traffic are negligible compared to the potential savings made by removing the ground-holding policies.
4.4
Impact on the number of maneuvers
Section 4.3 shows that removing the ground-holding regulations induces small additional costs for ATC compared to the potential savings in regulation, but the impact on the number of maneuvers is major.
12am 5am 10am 3pm 8pm 0 2 4 6 8 10 12 14 16 18 20 22 24 26 28 30 +0% with CASA (S1) +0% without CASA (S2) (a) +0%
12am 5am 10am 3pm 8pm
0 2 4 6 8 10 12 14 16 18 20 22 24 26 28 30 +32% with CASA (S1) +32% without CASA (S2) (b) +32%
12am 5am 10am 3pm 8pm
0 2 4 6 8 10 12 14 16 18 20 22 24 26 28 30 +42% with CASA (S1) +42% without CASA (S2) (c) +42%
12am 5am 10am 3pm 8pm
0 2 4 6 8 10 12 14 16 18 20 22 24 26 28 30 +50% with CASA (S1) +50% without CASA (S2) (d) +50%
Figure 6: Number of conflicts per hour in KR for different traffic volumes.
+0% +5% +12% +20% +32% +42% +50%
5 × 10⁶
10 × 106
20 × 106
30 × 106
(a) Ground-holding regulation costs (e): 6/8/2012
+0% +5% +12% +20% +32% +42% +50% 1.5 × 10⁵ 2 × 10⁵ 2.5 × 10⁵ 3 × 10⁵ With CASA (S1) Without CASA (S2)
(b) Deconfliction costs (e): 6/8/2012
Indeed, as shown in Figure8, the number of maneuvers issued per hour in dense areas becomes much higher than the current value: up to 26 maneuvers are performed within one hour for a traffic volume of +50%, which represents approximately one command every 2.5 minutes. This corresponds to a considerable workload in addition to the monitoring workload, making the controllers’ task even more intensive.
12am 5am 10am 3pm 8pm
0 2 4 6 8 10 12 14 16 18 20 22 24 26 28 30 +50% +50% with CASA (S1) +50% without CASA (S2)
Figure 8: Maneuvers per hour for +50% traffic volume in KR sector.
5
Finding a compromise between costs and workload
5.1
Motivation
The previous section presented a traffic and cost analysis for scenarios S1 and S2, which correspond to two
extreme situations. The results show that retaining the current sector capacities induces an exponential growth in the ground-holding regulation costs. However, suppressing the regulation leads to a large increase in the controller workload that is unrealistic with today’s tools. It therefore seems worth investigating a scenario that offers a compromise between regulation costs and controller workload.
5.2
Design of the scenario
Figure 7(a) indicates that the ground-holding regulation costs grow exponentially with the traffic volume. The function linking these quantities can be described by a sequence of positive slopes denoted (si)i=1,...,6,
with each slope indicating the magnitude of the increase in the delay costs between two consecutive traffic volumes. In other words, a steep slope emphasizes that retaining the current capacities between two traffic volumes leads to a large increase in the regulation costs.
Scenario S3 represents a trade-off situation where the growth in the regulation costs is controlled with
an increase in the sector capacity. Figure 7(a)is used to determine the average slope s∗ for the next five years; this represents an indicator for short-term trends in the cost increase. This value is used as a ceiling growth rate for the future traffic, hence yielding a bounded increase in the regulation costs. To enforce this constraint, we determine the new capacity values for each traffic increase iteratively via Algorithm 1. Basically, the algorithm increases the sector capacities until the rate of the cost increase drops below s∗.
Applying Algorithm1 leads to the capacity-increase percentages listed in Table5. The sector capacities are obtained by rounding down to the nearest integer. These new capacity values represent an interesting indicator for future objectives in terms of continuous improvement of ATC with a fixed growth rate in ATFM costs.
Since the new sector capacities are determined iteratively, it is interesting to plot the regulation costs computed at each step of the algorithm; see Figure9.
Algorithm 1 Determining sector capacities for traffic volume increased by α%.
1: C: set of current sector capacities
2: D: cost of delays due to the ground-holding regulations for the current traffic 3: Cα: set of sector capacities for a traffic volume increased by α%
4: Rα: cost of delays due to the ground-holding regulations for a traffic volume increased by α% 5: Cα← C 6: while Rα− D α > s ∗ do 7: for c ∈ Cαdo 8: c ← c + 1 100c 9: end for 10: end while
Table 5: Increased capacities for scenario S3. Traffic volume Capacity increase
+5% +4% +12% +5% +20% +8% +32% +16% +42% +24% +50% +32% 0 +5% +10% +15% +20% 0 5 · 105 1 · 106 (a) +5% 0 +10% +20% +30% 0 1 · 106 2 · 106 3 · 106 (b) +20% 0 +20% +40% +60% 0 1 · 107 2 · 107 3 · 107 (c) +50%
Figure 9: Ground-holding costs for increasing capacities.
Figure 9 shows that the regulation costs are a decreasing step function of the increase in capacity. The increased capacities can be gathered into clusters corresponding to a given value for the regulation costs. Two consecutive steps are separated by a gap, indicating a large difference in the regulation costs between two sets differing by only 1% in capacities. For instance, for a +20% traffic volume,e700000 could be saved daily by increasing the sector capacities by 7% instead of 6%. This difference can be explained by observing the distribution of the magnitude of the delays assigned by CASA. Some capacity values, especially for dense sectors, can trigger a bottleneck effect on the traffic flow, inducing long and costly delays. This observation is supported by the expanding plateau effect seen in Figure4, where the flights are more and more delayed during peak periods. It is therefore possible to identify threshold capacity values that are critical with respect to the issued delays. Moreover, the shape of the curves indicates that one can expect stepwise improvements in the regulation costs.
5.3
Cost analysis
Figure10shows the ground-holding and conflict-resolution costs for the three scenarios. The results for the ground-holding costs suggest an almost linear growth for S3, as imposed by the constraints of Algorithm 1,
hence indicating considerable potential savings. The results provide evidence that S3represents a compromise
situation for ATC. It appears that S3 is closer to S2 than to S1 for high traffic volumes. This is because
the constraint on the controlled delay costs imposed in the design of S3 is strict. More precisely, since the
maximum increase rate allowed in the delay costs in S3 is small compared to the natural rate, the constraint
is closer to S2 than S1 for high traffic volumes.
+0% +5% +12% +20% +32% +42% +50% 5 × 10⁶ 10 × 106 20 × 106 30 × 106 With CASA (S1)
With increased capacities (S3)
(a) Ground-holding +0% +5% +12% +20% +32% +42% +50% 1.5 × 10⁵ 2 × 10⁵ 2.5 × 10⁵ 3 × 10⁵ With CASA (S1) Without CASA (S2)
With increased capacities (S3)
(b) ATC
Figure 10: Ground-holding and ATC costs for the three scenarios on 08/06/2012.
5.4
Workload analysis
To evaluate how S3 compares to S1 and S2 in terms of the workload, we use the metric OC(.) defined in
Section3.5. Figure11shows OC(KR) for the traffic simulated under the different scenarios. More precisely, • the blue curve with circles shows OC(KR) for S1with nominal capacities;
• the red curve with triangles shows OC(KR) for S2 with nominal capacities;
• the brown curve with squares shows OC(KR) for S3with increased capacities;
• the green curve with pentagons will be described later, for the sake of clarity.
+0% +5% +12% +20% +32% +42% +50%
500 1000
S1
S3with increased capacities
S2
S3with nominal capacities
Figure 11 shows that OC(KR) grows exponentially for S2 whereas it increases slowly for S1. This
observation corroborates our observations in Section4.1: localized high peaks appear in the entering flow distribution for S2, whereas broader but smaller overcapacity plateaus emerge for S1. Moreover, the values of
OC(KR) for S3with increased capacities and for S1 are similar. This indicates that CASA allows the effort
required in communications because of capacity overrun to be stable with the increase in capacity. Given this information, we introduce the green curve with pentagons as OC(KR) for S3 but with nominal rather
than increased sector capacities. S3 appears to be a compromise scenario for OC. The curve tends to grow
exponentially, but with a much gentler slope than that of S2, indicating that the traffic simulated with S3
would require less monitoring and management by the controllers.
The differences between the three scenarios in terms the number of resolution maneuvers are shown in Figure 12. The maximum number of conflict resolution maneuvers computed by the solver in sector KR is reduced from 27 to 20 during the busiest hour, leading to a less challenging situation. The number of maneuvers can be greater for S3 than for S2 for several hours after the high peak of S2. This can be
explained by the ground-holding regulation that is applied for S3: the flights are delayed after the busy peak
period, which leads to a greater flow entering the sector and more numerous conflict situations. However, this does not represent an unmanageable task for the controller. Indeed, the high peaks for the conflict-resolution maneuvers are the main challenge for the controllers. Therefore, S3 represents a situation with a relatively
high workload but where the peaks are more manageable than in S2.
12am 5am 10am 3pm 8pm
0 2 4 6 8 10 12 14 16 18 20 22 24 26 28 30 +50% +50% with CASA (S1) +50% without CASA (S2)
+50% with increased capacities (S3)
Figure 12: Maneuvers per hour for a +50% traffic volume in KR sector for the three scenarios.
5.5
Summary
The results presented here show that S3 is a satisfying alternative to S1 and S2. The ground-holding costs
increase reasonably with the traffic volume, while the expected controller workload remains manageable. Moreover, the cost analysis provides insights into possible future ATM network-design objectives: the capac-ities should find a trade-off between the costs and the workload. The sensitivity of the ground-holding costs to the sector capacity suggests that the regulations should be more robust to capacity variations in terms of the costs incurred.
6
Study of direct routes
The aircraft currently follow a constrained flight plan over a predefined route in a network, whereas direct routes could yield worthwhile savings. As mentioned in Section 2.4, there is no ground-holding regulation when direct routes are considered. Therefore, we compare the current traffic with direct traffic only for S2.
6.1
Differences in the entering flow
A first metric for the comparison is the aircraft flow in dense areas. Figure13shows the entering flows in the KR sector for both types of routes. The flight distribution during the day is similar. There is a noticeable difference in the peaks, which are between 5% and 10% higher for direct routes. The current flight plans can be designed to avoid loaded sectors where a time regulation is more likely to be issued. However, these detours are not considered by the solver that we used. Therefore, with a regulation such as CASA, we would need more time regulations to enforce the capacity constraint.
12am 5am 10am 3pm 8pm
0 10 20 30 40 50 60 70
+0% with current routes +0% with direct routes Capacity
(a) +0%
12am 5am 10am 3pm 8pm
0 10 20 30 40 50 60 70
+50% with current routes +50% with direct routes Capacity
(b) +50%
Figure 13: Comparison of the entering flow per hour for different traffic volumes in KR sector for current routes and direct routes.
6.2
Differences in the number of conflicts
Another interesting metric to investigate is the number of conflicts. Figure14 displays a comparison of the total number of conflicts during a single day for the two types of routes. There are between 20% and 27% fewer conflicts for direct routes. This difference can be explained by the underlying network structure of the current routes: the traffic must follow predefined routes, which leads to high traffic densities and more conflicts. +0% +5% +12% +20% +32% +42% +50% 0 1,000 2,000 3,000
With direct routes With current routes
Figure 14: Total number of conflicts for 06/08/2012.
The number of conflicts is higher for the current routes, but their location in the network is known beforehand. The controllers know where conflicts are likely. Moreover, their geometry makes them simpler to
solve, since they usually involve aircraft following paths that cross at a significant angle, and the continuous improvement performed by ATM eases the controller’s tasks. For direct routes, conflicts can be difficult to handle, since many of them involve situations of pursuit. A situation of pursuit occurs when two or more aircraft follow the same route or close parallel routes. The crossing angle is close to 0◦, and these conflicts require maneuvers that last longer as well as additional post-maneuver monitoring. Because they last longer, they create difficulties for solvers using a rolling-horizon loop, which is the case for the solver we use.
6.3
Differences in the number of ATC maneuvers
The conflict-resolution maneuvers issued per hour for the KR sector are shown in Figure15.
12am 5am 10am 3pm 8pm
0 2 4 6 8 10 12 14 16 18 20
Maneuvers per hour
(a) +0%
12am 5am 10am 3pm 8pm
0 2 4 6 8 10 12 14 16 18 20
Maneuvers per hour
(b) +50%
Figure 15: Conflict-resolution maneuvers per hour for different traffic volumes in KR sector for direct routes. We showed in Section6.1that the two route types have similar flow distributions; however, the differences in workload are significant. The maximum number of conflicts per hour is smaller for the direct routes, and the difference in magnitude between consecutive hours can be greater. For instance, in Figure 15(b) no conflicts occur between 9 a.m. and 10 a.m. whereas 17 occur between 10 a.m. and 11 a.m. Such large differences lead to a heterogenous workload for the controllers. This indicates that companies use spatial restrictions to avoid congested areas, hence reducing the likelihood of major delays. Direct routing needs space-related regulation more than it needs time-related regulation. The former would reduce the flights in congested areas and avoid large ground-holding delays.
6.4
Cost analysis
Simulations without conflict resolution allow us to focus on the differences between the two route types. The results of the traffic simulation highlight potential savings in fuel consumption, flight time, and traveled distance; see Table6.
Table 6: Improvement achieved by using direct routes rather than current routes.
Improvement when using direct routes (%) Flight time Fuel consumption Distance traveled
9.8% 7.6% 9.3%
Figure 16 compares the costs of the avoidance maneuvers for the two route types. The growth rate is smaller for direct routes; it tends to slow from volumes greater than +30%. The cost difference for the two route types increases to a 40% difference for a volume of +50%. This cost is linked to the number of
maneuvers rather than the complexity of the conflicts. This statement is corroborated by the difficulties of the conflict resolution observed with our solver.
+0% +5% +12% +20% +32% +42% +50% 1.5 × 10⁵ 2 × 10⁵ 2.5 × 10⁵ 3 × 10⁵ Direct routes Current routes
Figure 16: ATC costs for current and direct routes without ground-holding regulations: 08/06/2012.
6.5
Summary
The discussion in this section has shown that direct routes are crucial for the future, because they could yield cost savings of 10%, by giving companies more flexibility in trajectory design. We have also shown that direct routes have fewer conflicts, reducing the ATC costs. However, the conflicts can be complex, so we need regulation and conflict-resolution procedures that are appropriate for direct routes. Furthermore, the difficulties of conflict resolution for direct routes are linked to the solver used, and we consider this information to be a valid indicator of the traffic complexity.
7
Conclusion
We have analyzed the interactions between two layers of the ATM, to evaluate the impacts of the current ground-holding regulation scheme on the delay costs, sector loads, and conflict-resolution costs. We used a traffic simulator with modules to compute the regulation delays, to simulate the trajectories, and to resolve the conflicts. We chose French traffic data for a particularly busy day in 2012 as the input for the simulator, and we developed a traffic increase procedure to generate meaningful predictions to 2035.
The tests focus on two scenarios: the current regulation procedure and no regulation. We compare these scenarios using a set of metrics related to the costs incurred and the controller workload. Of those measures, the entering flow per hour and the number of conflicts highlight the effect of regulation on the traffic. As expected, for a busy sector, regulation reduces the amplitude of the peaks and spreads the entering flow over the day. However, the impact on the total number of conflicts is less important than expected: the improvement is noticeable only for a traffic increased by 30%.
We estimate that for a traffic increase of 50%, the delay costs will amount to millions of euros if the current regulation procedure is not changed. The additional conflict-resolution effort required without regulation will raise the associated cost by 15%, but this amount is negligible in comparison to the delay costs. There is a small extra cost for the fuel consumption. More important, the workload resulting from the new distribution of conflicts will be unmanageable for controllers working in the current framework. In addition to monitoring dense areas, they would have to issue a maneuver instruction almost every two minutes in some congested areas.
We then described a third scenario where the capacities are determined to satisfy a criterion limiting the growth in the ground-holding delay costs. The results lead to a worthwhile compromise: the delay costs increase gently and the controller workload is reduced compared to the no-regulation scenario. This scenario
also allows new capacity values to be determined, hence setting clear objectives for future research on ATM network management.
We have shown that significant savings could be achieved by developing a regulation algorithm that is better adapted to dense traffic. Our simulations have highlighted the sensitivity of the delay costs to the sector capacities: small capacity variations yield substantial savings. This observation indicates that a new regulation procedure should be robust to capacity changes. Such a procedure would certainly benefit from the introduction of automated tools for the monitoring, communication, and conflict detection and resolution. Such tools would allow for the successful management of much more complex situations without increasing the workload. Efficient tools could generate massive indirect savings if an adapted regulation procedure were simultaneously implemented. Finally, we have developed a complete framework for evaluating automated tools for air conflict resolution, which will enable us to test models developed in the future. We can study their performance independently or jointly under various scenarios.
We also studied direct routing. The traffic volumes already created were converted into direct routes. Since the notion of an air sector is irrelevant, there was no ground-holding regulation, and we used the traffic indicators listed above to compare direct traffic with the current traffic without regulation. Direct routes lead to a heterogenous workload; companies use spatial restrictions to avoid congested areas, hence reducing the likelihood of major delays. This suggests that a regulation procedure for direct traffic should include both space regulation and time regulation. Direct routes have fewer conflicts, but the geometry of these conflicts is more complex, with the majority being pursuits. These proved to be difficult for our solver, leading us to consider this a valuable indicator of traffic complexity.
Future work could develop more sophisticated traffic-increase procedures, based on more detailed local forecasts extracted from the STATFOR reports [2]. This would lead to a geographically heterogenous increase in the traffic, which is more realistic. It would also be interesting to compare several conflict solvers, and in particular their performance on direct routes. Different regulation procedures that include realistic predic-tions for the sector capacities should also be considered, keeping in mind that the interaction of regulation procedures and conflict-resolution algorithms should be optimized. Future work could also explore traffic scenarios that include the ability of companies to adapt their schedule according to the regulations applied; this would give more meaningful simulation results. Indeed, whatever the future ATM framework, companies will adapt their schedule to avoid unnecessary delays.
References
[1] EUROCONTROL, Performance review report for 2012, Tech. rep., EUROCONTROL (2012).
[2] Eurocontrol long-term forecast: IFR flight movements 2013–2035, Tech. rep., Eurocontrol – STATFOR (2013). [3] SESAR Joint Undertaking, European ATM master plan, edition 2, Tech. rep. (2012).
[4] RTCA Task Force, Final report of RTCA task force 3: Free flight implementation, RTCA Inc., Tech. rep. (1995). [5] A. Majumdar, W. Ochieng, J. Polak, Estimation of European airspace capacity from a model of controller
workload, Journal of Navigation 55(3) (2002) 381–403.
[6] M. Steiner, J. Krozel, Translation of ensemble-based weather forecasts into probabilistic air traffic capacity impact, in: Proceedings of the 28th Digital Avionics Systems Conference, October 25–29, Orlando, FL, 2009. [7] J.-P. Clarke, S. Solak, L. Ren, A. Vela, Determining stochastic airspace capacity for air traffic flow management,
Transportation Science 47(4) (2013) 542–559.
[8] P.B. Vranas, D.J. Bertsimas, A.R. Odoni, The multi-airport ground-holding problem in air traffic control, Op-erations Research 42(2) (1994) 249–261.
[9] A. Mukherjee, M. Hansen, A dynamic stochastic model for the single airport ground holding problem, Trans-portation Science 41(4) (2007) 444–456.
[10] P.B. Vranas, D. Bertsimas, A.R. Odoni, Dynamic ground-holding policies for a network of airports, Transporta-tion Science 28(4) (1994) 275–291.
[11] G. Lulli, A. Odoni, The European air traffic flow management problem, Transportation Science 41(4) (2007) 431–443.
[12] P. Kopardekar, T. Prevot, M. Jastrzebski, Traffic complexity measurement under higher levels of automation and higher traffic densities, in: Proceedings of the Guidance, Navigation, and Control Conference and Exhibit, 2008.
[13] J. Omer, J.-L. Farges, Hybridization of nonlinear and mixed-integer linear programming for aircraft separation with trajectory recovery, IEEE Transactions on Intelligent Transportation Systems 14(3) (2013) 1218–1230. [14] A. Vela, S. Solak, J.-P. Clarke, W.E. Singhose, E.R. Barnes, E.L. Johnson, Near real-time fuel-optimal en route
conflict resolution, IEEE Transactions on Intelligent Transportation Systems 12(1) (2011) 47–57.
[15] A.U. Raghunathan, V. Gopal, D. Subramanian, L.T. Biegler, T. Samad, Dynamic optimization strategies for three-dimensional conflict resolution of multiple aircraft, Journal of Guidance, Control, and Dynamics 27(4) (2004) 586–594.
[16] A. Alonso-Ayuso, L.F. Escudero, F.J. Martin-Campo, A mixed 0–1 nonlinear optimization model and algorithmic approach for the collision avoidance in ATM: Velocity changes through a time horizon, IEEE Transactions on Intelligent Transportation Systems 39 (2012) 3136–3146.
[17] N. Durand, J.-M. Alliot, J. Noailles, Automatic aircraft conflict resolution using genetic algorithms, Proceedings of the Symposium on Applied Computing, Philadelphia.
[18] A. Alonso-Ayuso, L.F. Escudero, F.J. Mart´ın-Campo, N. Mladenovi´c, A VNS metaheuristic for solving the aircraft conflict detection and resolution problem by performing turn changes, Journal of Global Optimization (2014) 1–14.
[19] E. Frazzoli, Z.-H. Mao, J.-H. Oh, E. Feron, Resolution of conflicts involving many aircraft via semidefinite programming, AIAA Journal of Guidance, Control and Dynamics 24(1) (1999) 79–86.
[20] J. Hoekstra, R.V. Gent, R. Ruigrok, Conceptual design of free flight with airborne separation assurance, AIAA Guidance, Navigation, and Control Conference, Boston, MA, USA 4239 (1998) 807–817.
[21] F.J. Mart´ın-Campo, The collision avoidance problem: Methods and algorithms, Ph.D. thesis (2010).
[22] S.A.N. Magill, The effect of direct routing on ATC Ca, in: 2nd USA/Europe Air Traffic Management R&D Seminar, December 1–4, Orlando, FL, 1998.
[23] J. Omer, T. Chaboud, Automated conflict-free planning: Experiments on real air traffic data, International Council of the Aeronautical Sciences (ICAS).
[24] Eurocontrol seven year forecast: Flight movements and service units 2013–2019, Tech. rep., Eurocontrol - STAT-FOR (2010).
[25] Basic CFMU handbook, General & CFMU systems (2011).
[26] J.-M. Alliot, J.-F. Bosc, N. Durand, L. Maugis, CATS: A complete air traffic simulator, 16th Digital Avionics System Conference.
[27] Aircraft performance summary tables for the Base of Aircraft Data (BADA) revision 3.0, Tech. rep., EURO-CONTROL (1998).
[28] D. Goldberg, Genetic Algorithms, Addison Wesley, 1989.
[29] User manual for the Base of Aircraft Data (BADA), Tech. Rep. 11/03/08-08, Eurocontrol (2011).
[30] A.J. Cook, G. Tanner, S. Anderson, Evaluating the true cost to airlines of one minute of airborne or ground delay: Final report.
[31] A. Cook, G. Tanner, The challenge of managing airline delay costs, in: Conference on Air Traffic Management (ATM) Economics, Vol. 1, 2009.
[32] A. Cook, G. Tanner, Modelling the airline costs of delay propagation, AGIFORS Airline Operations Conference, London, UK.
[33] R. Beatty, R. Hsu, L. Berry, J. Rome, Preliminary evaluation of flight delay propagation through an airline schedule, Air Traffic Control Quarterly 7(4) (1999) 259–270.