Publisher’s version / Version de l'éditeur:
Vous avez des questions? Nous pouvons vous aider. Pour communiquer directement avec un auteur, consultez la première page de la revue dans laquelle son article a été publié afin de trouver ses coordonnées. Si vous n’arrivez pas à les repérer, communiquez avec nous à PublicationsArchive-ArchivesPublications@nrc-cnrc.gc.ca.
Questions? Contact the NRC Publications Archive team at
PublicationsArchive-ArchivesPublications@nrc-cnrc.gc.ca. If you wish to email the authors directly, please see the first page of the publication for their contact information.
https://publications-cnrc.canada.ca/fra/droits
L’accès à ce site Web et l’utilisation de son contenu sont assujettis aux conditions présentées dans le site LISEZ CES CONDITIONS ATTENTIVEMENT AVANT D’UTILISER CE SITE WEB.
Permafrost: North American contribution to the 2nd International Conference on
Permafrost, pp. 310-318, 1973
READ THESE TERMS AND CONDITIONS CAREFULLY BEFORE USING THIS WEBSITE. https://nrc-publications.canada.ca/eng/copyright
NRC Publications Archive Record / Notice des Archives des publications du CNRC :
https://nrc-publications.canada.ca/eng/view/object/?id=6d32e096-e47d-4e38-a5fd-fdacd4f60c41
https://publications-cnrc.canada.ca/fra/voir/objet/?id=6d32e096-e47d-4e38-a5fd-fdacd4f60c41
NRC Publications Archive
Archives des publications du CNRC
This publication could be one of several versions: author’s original, accepted manuscript or the publisher’s version. / La version de cette publication peut être l’une des suivantes : la version prépublication de l’auteur, la version acceptée du manuscrit ou la version de l’éditeur.
Access and use of this website and the material on it are subject to the Terms and Conditions set forth at
Evaluation of in situ creep properties of frozen soils with the
pressuremeter
Reprinted from
PERMAFROST: The North American Contribution to the Second International Conference
ISBN 0-309-02 1 15-4
N A T I O N A L ACADEMY O F SCIENCES Washington, D.C. 1973
EVALUATION OF IN SlTU CREEP PROPERTIES OF FROZEN SOILS W I T H
T H E PRESSUREMETER
B.
Ladanyi
G.
H.
Johnston
E C O L E P O L Y T E C H N I Q U E N A T I O N A L R E S E A R C H C O U N C I L O F C A N A D A
Ladanyi and Johnston: Evaluation of in situ Creep Properties of Frozen Soils with the Pressuremeter 311
during drilling. Temperature checks in the borehole showed, however, that the temperature at the hole wall returned t o normal within about 1 h after drilling was completed. One hour was used, therefore, as a normal waiting period before starting each test.
TESTING PROGRAM
Before starting the long-term testing program, several short- term tests were conducted at the site t o investigate the gen- eral character and strength range of the frozen varved soils. These short-term tests were similar t o MCnard's standard or normal pressuremeter tests used in current soil testing prac- tice. For the standard test, the pressure in the probe was in- creased up t o the limit pressure in about 10-20 increments, the pressure being kept constant at each stage for no longer than 2 min. At each stage, volume readings were taken at 3 0 s, I min, and 2 min after the pressure was increased.
After comparing a number of different loading programs for long-term creep testing purposes, it was concluded that the following two types of pressuremeter tests might represent minimum requirements for obtaining the creep information required:
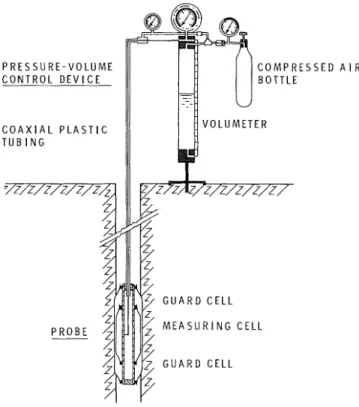
FIGURE 1 MQnard pressuremeter type G. Test setup.
an extensible overlapping metal strip jacket. For creep test- ing of frozen soils, the following modificatio~ls were made t o the equipment:
1. A fine adjustment valve was included in the pressure control system, t o provide more accurate pressure control when performing long-term creep tests.
2. Three thermocouples were fixed t o the outside of the probe, so that the temperature of the soil in contact with the probe could be checked continuously during a test.
3. The complete volurneter assembly was enclosed in an insulated box that was filled with crushed ice to cool the fluid t o be injected into the probe during the test.
Previous pressuremeter testing experience in unfrozen soils showed that the quality of results depends greatly on the quality and accuracy of drilling of the borehole. This is even more valid in frozen soils where not only a physical but also a thermal disturbance may occur during drilling. The method used was to auger the hole t o about 0.75 m above the required test level. A special sampling tube, having its cutting edge tapered inwards to avoid disturbing the soil surrounding the hole, was then pushed into the frozen soil to make a tight hole for the probe. Owing t o high air tem- peratures (15-25 O C ) , some thermal disturbance of the rela- tively warm permafrost at the site could not be avoided
1. A one-stage creep test in which the pressure is brought rapidly t o a given level and is left at that level as long as pos- sible. In practice, because deformation is limited by the maximum volume of 700 cn13 that can be injected into the probe, the total creep time can vary from about 2 0 ~ n i n t o several hours.
2 . A multistage creep test, in which the pressure is brought rapidly up t o an initial creep level and then is in- creased to the limit in several equal stress increments, each kept constant for 15 min.
RESULTS O F SHORT-TERM TESTS
As detailed descriptions of the standard pressuremeter test- ing procedure including all corrections of pressure and vol- ume readings, as well as the calibration curve determination, can be found e l ~ e w h e r e " ~ only some typical short-term results and their interpretation will be given here.
Plotting of Pressuremeter Curve
The results of a short-term pressuremeter test are usually plotted as a corrected pressuremeter curve (Figure ?A) de- fined as:
where V,,, denotes the total volume of fluid injected into the measuring cell from the start of pressure application,
312 SESSION I V : PHYSICS, PHYSICAL CHEMISTRY, A N D MECHANICS O F F R O Z E N GROUND A N D ICE
F I G U R E 2 Results of a short-term pressure- meter test in a varved silt-clay soil: A, pressure. meter curve; B, stress-strain curve; C, vector curve.
and p, is the applied pressure that lzas been corrected for the piezometric head and the extension resistance of the unloaded probe.
The interpretation method adopted in this paper, how- ever, is based o n the true pressuremeter curve, such as would be obtained in an ideal test starting from the original ground pressure, p,. The true pressuremeter curve represents a rela- tionship of the form:
where p, denotes tlze original total lateral ground pressure at the level of the test, and
where V,, is the volume of the liquid injected in the probe u p t o p , = p,. The true pressuremeter curve is obtained from the corrected curve b y shifting the origin from 0 t o O', as shown in Figures 2 A and 3A.
a . b a r
( C I
Eleven short-term tests were carried o u t at the Thompson site. Two typical results are shown in Figures 2 and 3, the former obtained in a frozen varved silty soil and the latter in a frozen varved clay.
Interpretation of Short-Term Tests
From a soil mechanics point of view, a frozen soil is essen- tially a (c,
4)
material having a relatively high time- and tem- perature-dependent cohesion and an angle of internal fric- tion that is usually only little affected by time and temper- ature. Because little is yet known about the true intergranu- lar stresses in frozen soils, c and4
are assumed to be total stress parameters. Moreover, if the soil is fine-grained and ice-saturated, the volumetric component of the deformation will be very small and, therefore, may be neglected. With these assumptions, a pressuremeter curve for frozen soil can be interpreted using the method proposed by ~ a d a n ~ i , 6 the main points of which are given below.Ladanyi and Johnston: Evaluation of in situ Creep Properties of Frozen Soils with the Pressuremeter 313
F I G U R E 3 Results of a short-term pressure- meter test i n a varved clay: A, pressuremeter curve; B, stress-strain curve; C, vector curve.
pc, b a r
( A )
t
of expansion of a thick-walled cylinder, which is considered as an assemblage of a finite number of thin concentric cylin- ders, all of which respond t o a common stress-strain law. By inversing the solution, it is found that n o t only the pressure- meter modulus and the average ultimate strength can be determined from the pressuremeter curve, as shown pre- viously by Gibson and Anderson: but also the whole stress- strain curve o f the soil, as well as a vector curve in the Mohr plot.
- 4 - 2 0 2 4 6 8 10 1 2
a , b a r
Stress-Strain Curve
As shown by ~ a d a n ~ i , ~ it is possible t o determine from any two points, i, i
+
1 of the true pressuremeter curve (Figure 2A), the corresponding mobilized strength, q i , i + , , defined as the principal stress difference:and the associated average shear strain, defined as the prin- cipal normal strain difference:
The principal stress difference can be calculated from the formula:
where p and AV denote the coordinates of the true pres- suremeter curve at the points i and i+ I , and the current volume V of the borehole is defined by
in which
denotes the volume of the measuring section of the probe at the moment when the pressure in the probe has attained the original ground pressure, p , . In this study it was found that p , should be determined o r estimated independent o f the test, since, contrary t o the usual belief, the lateral pres- sure was usually found to be completely unrelated t o the shape o f the pressuremeter curve.
It should be noted that the stress-strain relationship o b - tained by this procedure is valid for constant volume plane- strain condition. It can, however, easily be transformed into the more usual axial symmetry case by using the von Mises yield c ~ i t e r i o n . ~
The stress-strain curves obtained by this procedure from the pressuremeter curves (Figures 2 A and 3A) are shown in Figures 2B and 3B. Some caution is necessary, however, when such stress-strain curves are compared with those o b - tained in a triaxial test. In fact, in brittle soils, and often in frozen soils as well, it has been found that a pressuremeter test produced radial cracking of the soil e a r t y i n the test, leading t o an irregular shape of the stress-strain curve.
Vector Curve in Mohr Plot
On the other hand, since both the major principal stress o , (equal t o the applied radial stress) and the principal stress difference (o, -- 0 3 , equal t o qi,i+ I ) are known at any moment of the test, the information can be used for plotting a series of Mohr circles and a vector curve in the Mohr plot. In terms o f plane-strain information as obtained in the test, the values of the total principal stresses o , and o 3 for any interval i,i+l of the pressuremeter curve are given by:
and
where pc is the applied radial stress and qi,i+ is the stress difference defined by Eq. (6).
Figures 2C and 3C show two such plots obtained for frozen varved silt and clay, respectively. T o follow the se- quence of Mohr circles more easily, they have been con-
nected by a vector curve, showing the variation of (112) ( a , - 0 3 ) with ( l / 2 ) ( a l + 0 3 ) in the tests.
Although a semigraphical method for plotting Mohr circles directly from a pressuremeter curve has been shown by M C r ~ a r d , ~ the true meaning of the circles has never been properly understood. T o understand what the plot really means, one should remember that in a pressuremeter test the soil responds first in a pseudoelastic manner, attains failure, and then continues deforming in a plastic manner up t o large deformations. In Figures 2C and 3C, the pseudo- elastic behaviour is reflected by the first two o r three cir- cles that increase in diameter b u t remain concentric, as antic- ipated by the theory of expansion of a cylindrical hole in an infinite elastic medium.
T h e following two o r three circles are failure circles and correspond t o the peak strength of the soil. The remaining circles are all in the plastic domain and correspond t o ever- increasing plastic deformations. T h e diameters of these re- maining circles depend, therefore, simultaneously on t h e strength characteristics o f the soil and on its postfailure stress-strain behaviour.
It follows, therefore, that the three kinds of Mohr circles cannot be expected to have one common failure envelope. In fact, one may be justified in drawing one failure envelope over all failure and postfailure circles only if the postfailure behaviour of the soil is very close t o the ideally plastic as- sumption. If, o n the other hand, the postfailure behaviour of the soil is either strain-hardening o r strain-softening, which is most often the case, tlie circles will not have a com- mon failure envelope, and the determination of failure parameters c and $J from one single pressuremeter curve will be very difficult or impossible. In other words, contrary to the belief expressed by M6nard7 and Gibson and ~ n d e r s o n ? a single pressuremeter test is usually insufficient for deter- mining the failure envelope of the soil. Nevertheless, it is considered that the plotting o f b o t h the stress-strain curve and the vector curve, as described herein, is at present the best method available for a proper understanding of a short- term pressuremeter test.
In this study, the Mohr circle plots have been used only for estimating probable lower limits of the short-term tensile strength, T,, and the cohesion, c. T o estimate the two parameters, the Mohr circles were enclosed by a bilinear envelope, composed of a Coulomb straight line and a verti- cal tension cutoff. For the Coulomb line, a friction angle of 15" was assumed for all silty soils and 0" for all soils composed mainly of clay.
In addition, the values o f the pressuremeter modulus,
E p , were calculated from the initial straight-line portions of the pressuremeter curves by using the usual formula valid for incompressible soil:
Ladanyi and Johnston: Evaluation of in situ Creep Properties of Frozen Soils with the Pressuremeter 315
The overall variation of the three short-term parameters in the tests was approximately as follows:
For frozen varved soil: 250<Ep<800 bar; 5 < c < 14 bar; and, 1.5<Ts<12 bar.
For the same varved soil, unfrozen: 6 0 < E p < 8 0 bar; 2 < c < 5 bar; and, 1<Ts<5 bar.
As expected, a given type of soil is stronger and much less deformable when frozen than unfrozen. It also was noted that the tensile strength of the frozen soil tested was about the same order of magnitude as its peak shear strength. Fro- zen varved clay was found to be slightly weaker and more deformable than frozen varved silt at the same temperature.
INTERPRETATION O F PRESSUREMETER CREEP TESTS
According to H ~ l t , ~ there are essentiaIly two practical methods for generalizing experimental creep information. The first method, applicable to long-term creep tests in which the steady-state creep strains greatly exceed the instantaneous and primary creep strains, consists of linearizing the creep curves and considering the total strain at any time as being the sum of the pseudoinstantaneous and the steady-state creep strain. The method was applied t o the creep of fro- zen soils by LadanyiS and was used subsequently by John- ston and Ladanyi4 for generalizing creep information ob- tained in a series of long-term pull tests performed on grouted rod anchors in permafrost.
The second method, applicable to relatively short-term creep tests, considers the creep information as being essen- tially of a primary (or "stationary") creep type and attempts t o extrapolate it t o longer time using a convenient creep curve fitting method. As the creep time that can be realized in a pressuremeter test usually does not exceed several hours, the test should be considered as a short-term creep test t o which the second method is applicable.
According t o the second method, the creep data obtained in a pressuremeter test can be generalized using the solution to the problem of stationary creep under the internal pres- sure of a cylindrical cavity of infinite length located in an infinite medium.
The primary creep of high temperature metals, ice, and frozen soils can often conveniently be described by a law of the form
where E, and a, are the equivalent creep strain and the equivalent stress, respectively;
t ,
is an arbitrary, conveniently selected, strain rate; a, is the creep modulus in units of stress; and m and p are creep exponents. The values of crcep param- eters a,, m , and p can be obtained by a convenient plotting of creep curves as described by ~ u l t . ~T o solve this problem, it is convenient t o introduce into Eq. (14) the transformed time unit:
which permits Eq. (14) t o be transformed into an ordinary power law:
where
and
11 = m / ( l
+
p). (18) The solution of Eq. (16) for the problem of creep expan- sion of a cylindrical cavity under plane-strain condition can easily be obtained by analogy from the corresponding solution in nonlinear elasticity. Complete solutions of the particular problem can be found in several textbooks.'T o process the pressuremeter creep data, the only rela- tionship needed from the solution is the one relating the creep cavity expansion rate with the applied internal pres- sure, which is, according to Odquist:'
where r is the current radius of the cavity,pi is the constant applied internal pressure, and p, is the pressure acting at infinity. l f p i is replaced by p, according t o the notation adopted for the corrected pressure in the borehole, Eq. (19) can be written as:
where
dC)
= K @ t b (b< 1), (1 3)where K, a, and b are temperature-dependent material con- stants. In this report, Eq. (13) will be written in ~ u l t ' s ~ notation and is generalized t o multiaxial state of stress:
in which K is given by Eq. (17) and 11 by Eq. (18).
For a finite interval of time at a constant stress, Eq. (20) can be integrated t o give:
316 SESSION I V : PHYSICS, PHYSICAL CHEMISTRY, A N D MECHANICS O F FROZEN G R O U N D A N D ICE Taking r = ri- at T = 0 , i.e., at the beginning of the con-
sidered i t h creep stage, the integration constant C can be eliminated, and Eq. (22) becomes:
Since for a cylindrical cavity:
Eq. (23) becomes finally,
V/Vi- = e x p [ 2 G(p, - p,) t l I ( l + f i ) ] , (25)
where Vi-
,
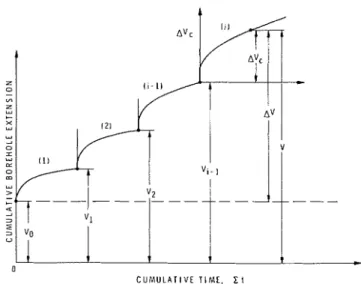
denotes the cavity volume a t t = 0 (Figure 4 ) , i.e., at the start of a given constant-pressure creep stage, and V = Vi-, + AV, denotes the volume o f the cavity at any time t after the step-increase o f pressure @, - p,) in the stage i.T o determine the creep parameters p , m, and a,, the semigraphical procedure described by Hult3 for the primary creep case can be followed. Taking first a natural and then an ordinary logarithm o f Eq. (25), one gets:
log [ln(V/Vi-
)I
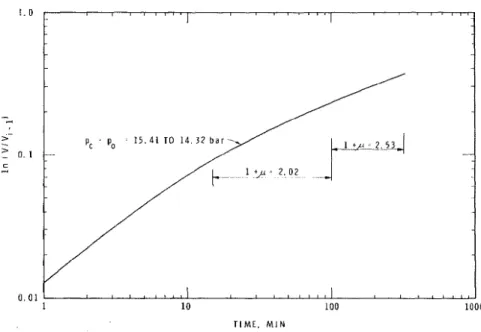
= log 2G@, - p O ) + (1% t)/( 1 + (26)showing that pressuremeter creep curves should linearize if ln(V/Vi- , ) is plotted against time in a log-log plot. Accord- ing to Eq. (26), in such a plot, the slope of the creep straight lines is equal t o 1/(1 + p) o r , from Figure 5:
The intercept at the unit time ( t = 1 min in Figure 5) o f any
0
C U M U L A l l V E TIME. X I
FIGURE 4 Notation for interpretation of pressuremeter creep data.
I
I , P;P, = 16.75 bar10 100
TIME, MIN or Ipc-pol. b a r
FIGURE 5 Multistage creep test in a varved silt-clay soil. Determi- nation of creep parameters.
creep line, each of them corresponding t o a different value of pressure @, - p,), is then equal t o 2G@, - p,).
T o determine the parameters m and a,, Eq. (2 1) may be written as:
log 2G@, - p,) = log M - 11 log a, + 11 log@, - p,), (28)
where
log M = log 2
+
(1 + ,z)log ( a 2 )+ (~z/rn)log(~,m/~z) + 11 log(2/n). ( 2 9 )
Equation (28) shows that plotting 2G(pc -p,) against @, -
p,) in a log-log plot will give a straight line with the slope equal t o 11. In Figure 5 such a plot is shown superimposed
o n a plot o f In(V/Vi-,) versus time. The new straight line has a slope:
and its intercept N, read at unit value of @, - p,) (at 1 bar
Ladanyi and Johnston: Evaluation of in situ Creep Properties of Frozen Soils with the Pressuremeter 317
Since, for an arbitrarily assumed
t,,
and with known p and m, the value of M can be calculated from Eq. (29), the value of u, is:Once the creep parameters p , m , and
o,
have been deter- mined, they can be substituted into Eq. (14) to get a general creep equation of the soil. The equation, subsequently, can be used either for extrapolating the pressuremeter creep data to longer time intervals or, in association with an esti- mated creep failure strain, serve for predicting the long-term strength of frozen soil. T o predict the long-term strength, if ~ , f denotes the equivalent failure strain and
o,f
the equiva- lent creep strength, then Eq. (14) yields:Figure 5 shows typical creep information obtained in a mdtistage pressuremeter creep test with 15 min per stage. Figure 6 , in turn, shows the result of a one-stage creep test kept at a constant stress for more than 5 h. In the figures, the logarithmic creep measure, In(V/Vi- is plotted against the time, t, in a log-log plot, as required for creep parameter determination.
T o apply the foregoing analysis in practice, two condi- tions are necessary: Creep curves should linearize in a log- log plot; and creep curves for different sustained pressures should be parallel to each other.
As can be seen in Figures 5 and 6, neither of the two conditions was completely satisfied in the tests. In fact, the
creep curves were found to curve u p slightly at low pressures and curve down a t high pressures. Moreover, the creep lines frequently were not quite parallel but diverged with increas- ing time. Nevertheless, they appeared to linearize better in one-stage tests then in multistage tests and showed a tendency to become parallel after about 15 min. With these two ex- perlmental facts in mind, it was decided, for the purpose of generalization of creep information, to consider the creep curves as becoming parallel after 15 min in each stage and having a slope ( A / B = 1 + p ) average for the considered pres- sure interval. The creep lines were then projected back from 15 to 1 min t o get the values of 2G@, - p , ) , according to Eq. (26). These values were then plotted against @, - p,)
t o get a set of points through which an average (dash-dotted) line was drawn. The line, according t o Eq. (28) t o (3 1 ) al- lows the ratio D/C = m / ( l
+
p ) and the intercept N at p =1 bar [Eq. ( 3 I)] t o be determined. With these values and after calculating the value of M [Eq. ( 2 9 ) ] , the creep modu- lus
o,
wasf
nally determined.In the six tests performed in the frozen varved silt, it was found that the value of ( I + p ) remained essentially between 1.5 and 2.5, while the value of m varied from about 2 to 4. There was a much larger variation in
o,,
from about 4.5 to 24 bar.It should be noted that in ali creep calculations the arbi- trary strain rate
t ,
was taken as equal to lo-' min-'.
As already explained, when the three parameters are known, one can write both the general creep equation, Eq. (14), and the time-dependent strength equation, Eq. (33). For the test shown in Figure 5 , the creep equation has the form:
where
o,
is in bar and t in min, and the time-dependent1 0 I
I
-
-
0 0 1 I I
FIGURE 6 One-stage creep test i n a varved 1 10 100 1000
318 SESSION I V : PHYSICS, PHYSICAL CHEMISTRY, A N D MECHANICS O F FROZEN G R O U N D A N D ICE strength, assuming a failure strain of eef = 0.10, is given by:
with the same units as above. Thus, the soil would have a 30-min strength of 15.8 bar and a 1-year strength of 1.62 bar, i.e., its strength would decrease within a year t o about one tenth of its short-term value.
CONCLUSIONS
The study conducted to evaluate the pressuremeter test as a means for obtaining creep information of frozen soils in
sit^^ indicated that:
1. After some minor modifications, the standard pressure- meter equipment proved t o be suitable for performing creep tests under the conditions found at the Thompson site. It is not known, however, how the same equipment would per- form a t very low temperatures and in some other types of frozen soils, such as glacial till.
2. Methods used t o drill and prepare the borehole for the tests were fairly satisfactory. Some temperature disturbance could not be avoided, however, and special attention must be given t o this aspect in future studies.
3. A new interpretation method had to be developed in order to make use of information obtained from the short- term tests. This method permitted the determination of short- term strength parameters and the stress-strain curve from each pressuremeter test.
4. A method had also t o be found for t h e determination
of creep parameters from the pressuremeter creep data. The method developed proved feasible for the determination of creep parameters of frozen soils it1 situ and the prediction of long-term strength. T o obtain sufficient creep informa- tion for the proposed method t o be applicable, however, it is recommended that, in addition to conventional short- term pressuremeter tests, the following two types of creep tests be performed: multistage creep tests with about 15 min per stage and one-stage creep tests conducted at different pressure levels t o check the linearity o f creep lines for long time intervals.
REFERENCES
1. Dunod. 1971. Essai pressiomdtrique normal. Mode op6ratoire MS.IS-2. Paris.
2. Gibson, R. E., and W. F. Anderson. 1961. In situ measurement of soil properties with the pressuremeter. Civ. Eng. Publ. Works Rev. (London) May:615-618.
3. I-lult, J. A. H. 1966. Creep in engineering structures. Blaisdell Publ. Co., Waltham, Massachusetts. 115 p.
4. Johnston, G. H., and B. Ladanyi. 1972. Field tests of grouted rod anchors in permafrost. Can. Geotech. J. 9: 176-194.
5. Ladanyi, B. 1972. An engineering theory of creep of frozen soils. Can. Geotech. J. 9:63-80.
6. Ladanyi, B. 1972. In-situ determination of undrained stress-strain behavior of sensitive clays with the pressuremeter. Can. Geotech. J. 9:313-319.
7. Mdnard, L. 1957. Mesures in-situ des propridtds physiques des sols. Ann. Ponts Chaussdes 127:357-377.
8 . Odquist, F. K. G. 1966. Mathematical theory of creep and creep rupture. Oxford Math. Monogr. Clarendon Press, Oxford. 9. Socidtd Pressiom6trique M6nard. 1968. Pressiorn6tre type G: