HAL Id: hal-03191523
https://hal.univ-reunion.fr/hal-03191523
Submitted on 7 Apr 2021HAL is a multi-disciplinary open access
archive for the deposit and dissemination of sci-entific research documents, whether they are pub-lished or not. The documents may come from teaching and research institutions in France or abroad, or from public or private research centers.
L’archive ouverte pluridisciplinaire HAL, est destinée au dépôt et à la diffusion de documents scientifiques de niveau recherche, publiés ou non, émanant des établissements d’enseignement et de recherche français ou étrangers, des laboratoires publics ou privés.
Do monetary and non-monetary incentives influence
environmental attitudes and behavior? Evidence from
an experimental analysis
Darshana Rajapaksa, Robert Gifford, Benno Torgler, María A.
García-Valiñas, Wasantha Athukorala, Shunsuke Managi, Clevo Wilson
To cite this version:
Darshana Rajapaksa, Robert Gifford, Benno Torgler, María A. García-Valiñas, Wasantha Athukorala, et al.. Do monetary and non-monetary incentives influence environmental attitudes and behavior? Evidence from an experimental analysis. Resources, Conservation and Recycling, Elsevier, 2019, 149, pp.168-176. �10.1016/j.resconrec.2019.05.034�. �hal-03191523�
1
Do monetary and non-monetary incentives influence environmental attitudes and behavior? Evidence from an experimental analysis
Darshana Rajapaksa, Robert Gifford, Benno Torgler, Marian Garcia-Valiñas, Wasantha Athukorala, Shunsuke Managi, Clevo Wilson
Highlights
• Monetary and non-monetary measures are commonly used in residential water demand management
• The focus of this research is to explore behavioral and attitudinal changes due to different monetary and non-monetary management measures and thereby measure the water savings effects.
• A structural behavioral model was developed based on field experimental data collected from selected residents in Brisbane, Australia
• Results indicate that both monetary and non-monetary measures reduce domestic water consumption, but non-monetary measures are more influential in changing environmental behavior and attitudes.
• This research suggests that knowledge and moral suasion are appropriate instruments in managing residential water demand.
Abstract
There is a wide array of empirical work on the use of monetary and non-monetary measures to manage residential water consumption. However, there has been little focus on exploring the ability to change human attitudes and behavior through offering consumers sustainable resource management. This research helps bridge this gap, through an experimental trial in Brisbane, Australia. Choices of different monetary and non-monetary incentives for managing water demand are offered to survey participants. A structural behavioral model is then developed to identify direct and indirect impacts of attitudes and behavior and which can be compared between separate groups drawn from the survey’s participants. Our results suggest that both monetary and non-monetary incentives offered to households significantly reduce water consumption, which is especially so for those holding pro-environmental attitudes/behavior. Importantly, the impact is higher for non-monetary incentives. The results therefore provide valuable insight for the development of long-term sustainable resource management policies.
JEL classification: Q25, R11
2 1. Introduction
There is a growing consensus that a shortage of potable water is becoming a crucial factor in many developing cities as a result of climate change and human activities (see, Goonetilleke et al., 2017). Research shows nearly 80% of the world’s population is under threat from such water scarcity (Vorosmarty et al., 2010). In response, water resource managers are basing policies - underpinned by several decades of research - on monetary and non-monetary policy instruments (see, Ghimire et al., 2015; Wichman, 2014; Howarth and Butler, 2004; Dalhuisen et al., 2003). However, responsiveness of different households and subgroups varies between countries as do the long-term impacts of such policies. Some argue, for instance, an increase in unit prices exerts an immediate impact on demand for potable water, although the impact is heterogeneous (see, Klaiber et al., 2014).
The ultimate objective of such intervention is to influence behavior through its determinants, i.e. price or knowledge. Yet, the research has not compared the relative effects of monetary and non-monetary interventions as a means of influencing behavior. Hence, this study is designed to better reveal the causality involved in demand management intervention and resulting behavior from a systematically planned field trial in Brisbane, Australia. The paper broadly relates to two streams of literature - economics and social science.
Standard economic theory as well as previous research suggest that the price of water is an effective instrument in demand management (see, Ratnasiri et al., 2018; Zhao et al., 2016; Ghimire et al., 2015; Olmstead and Stavins, 2009). Nevertheless, as the cost of water is typically a small component of household expenditure, the price increase alone may not be an effective conservation tool (Ghimire et al., 2015). In addition, there are political, and in particular equity, issues which can limit the use of price increases. Alternatively, there is evidence that non-monetary measures can be effective in managing resources. For instance, knowledge of water scarcity and management practices may change behavior. For example, increased knowledge among UK water supply recipients is shown to have led to a 5% reduction in water use (Howarth and Butler, 2004). It has equally been found that, in the long term, sustainable management needs to be driven by behavioral change. That is, mismanagement of resources is closely linked to human behavior and thus attitudinal and behavioral changes become key to sustainability (Steg and Vlek, 2009; Gilg and Barr, 2006).
In line with the emphasis on human behavior, environmental psychologists have investigated the nexus between behavior and resource management. Empirical evidence shows that environmental attitudes play an important factor in water conservation (Lucio et al., 2018; Maas et al., 2017; Arbue´s et al., 2016). In a study of Sydney’s water demand, Randolph and Troy (2008) conclude that attitudinal change is necessary for water demand management. Another recent Australian study, using a large sample (5,194) drawn from an internet survey, investigates attitudes and behavioral impacts across different demographics (Dean et al., 2016). The paper concludes that water and other environmental related policies need to take into account society’s diversity. A similar study exploring water use behavior in Sydney, confirms that consideration of socio-demographic factors are more important than economic factors in resource conservation (Yan et al., 2018). Another study on electricity pricing in managing electricity demand shows that the acceptance of different pricing rules depends on individual characteristics (Yoshida et al., 2017). The findings indicate the heterogeneity in policy impacts across different demographic factors.
Despite the growth of empirical research on monetary and non-monetary incentives, none of the studies have considered the ability of the latter to change behavior. Indeed, Steg and
3
Vlek (2009) highlight the importance of identifying factors and policy interventions that can drive behavioral changes. Nevertheless, changes in public attitudes are a key factor in sustainable resource management. In particular, little is known as to whether monetary and non-monetary treatments in managing residential water consumption influence environmental attitudes and pro-environmental/ water behavior differently and to what extent. Such influence and impacts will be key to underpinning effective long-term sustainable urban water management. Given the importance of the factors that need to be considered in policy making, the overall objective of this study is, therefore, to investigate whether water demand management instruments can change environmental attitudes and environmental behavior. Using household water consumption in Brisbane, Australia, for the purposes of an experiment, we examine the relationship between environmental attitudes and behavior. This research further explores whether environmental attitudes mediate through pro-environmental behavior. Finally, we investigate whether the impact of attitude and behavior vary across different treatments – monetary and non-monetary instruments. Through the inclusion of further variables, we explore whether different demographic groups (i.e. born in Australia) are likely to change attitudes and environmental behaviors as a result of different water management strategies.
The results indicate that both pro-environmental behavior and attitudes can lead to reduced household water consumption. That is, environmental attitudes – both directly and indirectly through pro-environmental behavior - impact on household water consumption. From the survey treatments, both monetary and non-monetary instruments are shown to reduce household water consumption in comparison to the control group: however, the non-monetary group perform better than non-monetary group. The rest of the paper is organised as follows; section 2 briefly discusses the study area and the field experimental design. There is also a discussion of the econometric approach to modeling environmental attitudes and behavior. Section 3 provides a detailed descriptive analysis of the different survey instruments. Section 4 discusses the results of the behavioral model which is followed by the conclusions and policy implications.
2. Experimental design, data collection and econometric model 2.1 Background
In most parts of the world water has become a limiting factor with increased economic development (Distefano and Kelly, 2017) and which is being magnified by climate change (Kisakye and der Bruggen, 2018) and increasing population. For Australia in particular - one of the driest continents in the world - residential water demand management is of the upmost priority in all major cities. Taking 2010 as a base year, water demand is predicted to increase by at least by 33% in 2040 (Haque et al., 2014). This is the case for Brisbane - the capital city of Queensland, located in North-Easter Australia – where water management has become a crucial issue. The water demand in the greater Brisbane area is predicted to increase 58% by 2030 as a result of population growth (Birrell et al., 2005). Given Queensland faces frequent droughts, water managers have in response adopted a variety of measures. There are a number of studies of such residential water demand management strategies for Queensland and other cities in Australia (see, Worthington and Hoffman, 2008; Beal et al., 2013; Fielding et al., 2013; Wills et al., 2013; Jayarathna et al., 2017).
All management strategies ultimately target reduced residential water consumption and sustainable management. While some strategies are effective in resource management in general, others may not be so sustainable. For instance, Tiefenbeck et al. (2013) found that
4
applying successful non-price management strategies in reducing water are not successful when applied to reducing energy consumption. Importantly it is found (Chenowth et al., 2016), that the reduction of water consumption does not need to reduce wellbeing given it can be achieved through an increase in the efficiency of use. Analyzing Taiwan’s residential water consumption Hung et al. (2017) point out that one third of residential water consumption is wasted. Ratnasiri et al. (2018) compared different pricing strategies in managing urban water consumption and found the use of an increasing block tariff scheme an effective measure. However, none of these studies have considered the capacity to change environmental attitudes and pro-environmental behavior for the purpose of sustainable management. Based on empirical evidence, such demand management policies are well justified if they lead to sustainability. Analysing the behavioral factors in the US, Garcia-Cuerva et al. (2016) highlighted the importance of attitudes in conserving and reclaiming water.
2.2 Experimental design
The sustainability of resource management was assessed through an experimental trial. For this study carried out in 2010 and 2011, we conducted a field experiment in Brisbane selecting 37,341 household addresses within 83 suburbs1 (out of a total of 189
suburbs) in the Brisbane City Council region (BCC). In the first step we sent out a letter to obtain the consent of residents to participate in the field experiment. In response to the letters, 3,475 households consented to participate. A detailed questionnaire was then sent out to the recruited sample in 2010, from which we received 2,142 useable responses2. In the next
stage, households were randomly divided into eight groups. A number of households were randomly allocated to a control group while the rest were subject to a number of (7) experimental conditions. They involved being encouraged to save water by means of monetary and non-monetary incentives as depicted in Table 13. It is accepted that an
individual’s behavior can be changed through different means, such as monetary or other types of financial benefits and through normative reasoning (Steg et al., 2014). In this research therefore, we tested responsiveness on the basis of monetary and non-monetary incentives. These experimental treatments were sent out to participants progressively in 2011. For instance, the group which were tested for the effect of, firstly, knowledge and, secondly, moral suasion were provided with carefully designed environmental and sustainability information flyers and letters. The monetary incentive groups were presented with the alternative of receiving various types of financial benefits if they reduced water consumption (for further information see Appendix 1).
Table 1
Experimental design
Group Subgroup Sample Final
Non- Knowledge 306 183
1 The sample was selected employing a multi-stage sampling procedure. In the first stage, we ranked the 189
suburbs in the BCC (the largest in Australia based on the 2006) census median Australian Bureau of Statistics fortnightly income from highest to lowest. From this list, we selected every 2nd suburb, resulting in a sample of 83 suburbs. We then obtained a list (from BCC) of owner occupied households who pay water rates. From that list, we selected every 3rd household and sought their consent for the study.A random sample is used in experimental design to avoid selection bias (see Woodridge, 2007; Duflo et al., 2007).
2 We only included single and multiple dwellings: attached houses were removed. 3 Details of different treatments are provided in Appendix 1.
5
monetary Moral suasion 306 186
Knowledge/ moral suasion 306 191
Monetary Monetary rewards-current rate 153 100
Monetary rewards-half of the current rate 153 102
Monetary rewards-fixed rate 306 177
Lottery 306 196
Control Control 306 193
The field experiments were completed in the second quarter of 2012 (after the treatments). This resulted in 1,545 household responses (the response rate compared to the selected sample was 72%) with the rest having either avoided continuing the survey or changed their location4. The survey collected data on quarterly household water consumption,
environmental attitudes and behavior and other demographics such as household income, indoor and outdoor household characteristics. Some incomplete questionnaires were removed producing a final data set of 1,328. Apart from water consumption data and other demographic information, three questions were asked about participants’ environmental attitudes and nine questions concerned water behavior (discussed in detail in the next section).
A review of literature indicates that household water consumption is influenced by a range of socio-economic and demographic factors (see, Yan et al., 2018; Jayarathna et al., 2017; Arbues et al., 2016; Fox et al., 2009) and hence we chose to include other determinants of water consumption. Some obvious determinants are the number of people residing in the household (Beal et al., 2013), education (Comerford, 2014) and income (Baki et al., 2018; Fox et al., 2009). For instance, research indicates that higher incomes are associated with greater water consumption (Newton and Meyer, 2012). Household structure is also an important determinant (Arbués et al., 2010). Younger people tend to use more water (Newton and Meyer, 2012), while the presence of children can affect a household’s environmental behavior. For this study, we categorized occupancy according to the number of people below 18 years, between 18 and 65, and above 65 years old. Attachment to a particular place of residence was taken into account as one of the crucial behavioral factors and which can be linked to the use of public transport (Browns et al., 2016). We also assumed respondents who were born in Australia behave differently to those who were not.
2.3 Empirical analysis
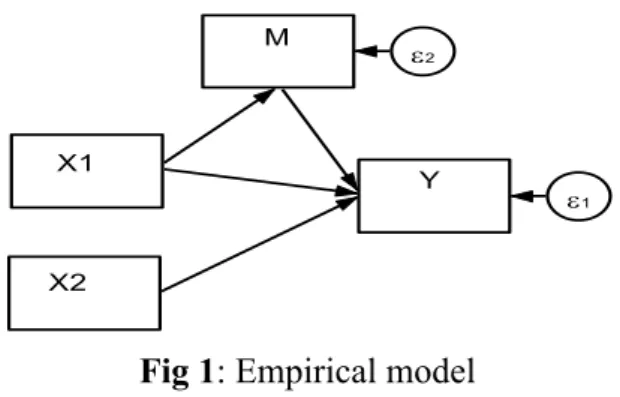
We argue that monetary and non-monetary intervention on water consumption can change consumers’ environmental attitudes and behavior. Similarly, environmental attitudes can determine households’ behavior towards water use. The causality of constructed variables can be simply represented in Fig 1.
4 Most of the uncompleted questionnaires returned were due to change of residences. Some of them voluntarily
6
Fig 1: Empirical model
A structural equation model (SEM) was developed for evaluation of direct and indirect impacts of pro-environmental behavior on water demand management. As Fig 1 illustrates, X1 and X2 directly affect Y - which represents the direct effect. However, X1 also has an effect on Y through M – the indirect effect. The causality of Y, X’s and M can be analysed through maximum likelihood estimation (MLE) using an SEM. If the dependent variable is Y, the independent variables are X1 and X2 and the mediating variable is M. A mediation analysis for the linear model can be written as:
𝑌 =∝$+ 𝑎𝑋$+ 𝛽$𝑋)+ 𝜀$ ………. (1)
𝑀 =∝)+ 𝑏𝑋$+ 𝜀) ………. (2) 𝑌 =∝-+ 𝑐𝑀 + 𝑎$𝑋
$ + 𝛽)𝑋)+ 𝜀- ………. (3)
where, 𝜀 is the error term and it is assumed that Y and M are continuous variables.
Given the above notation, the direct effect is represented by ‘a1’ and the indirect effect by
‘a*b’ (for methodology see Hayes and Preacher, 2014; Linden and Karlson, 2013; Preacher and Hayes, 2008). A one-unit changes in X1 changes Y by a1 and Y by ab as a result of the
effect of X1 on M (indirect effect). Thus, the indirect effect (I) and total effect (t) of X1 on Y
can be expressed as;
I=a*b ……… (4) t = a1+ab …………... (5)
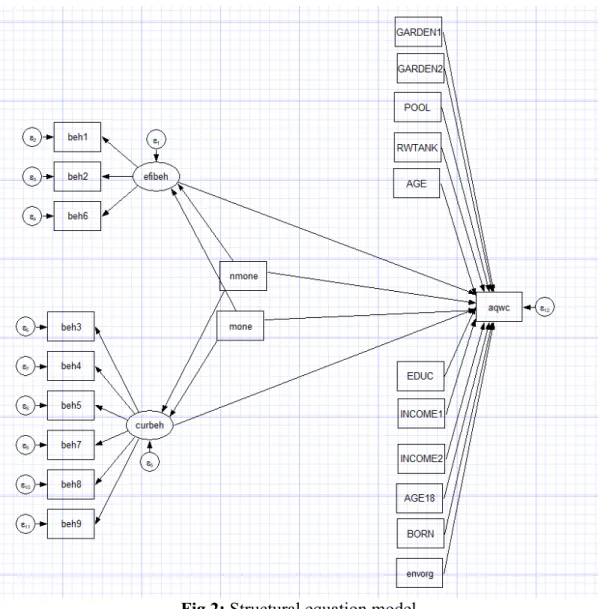
Depending on the different survey questions, required variables were constructed using principle component analysis (PCA). An example of an estimated model is illustrated in Fig 2. The circles represent latent variables whereas a square represents observed variables. The arrows show direct and indirect impacts on dependent variables.
e1 e2 X2 X1 M Y
7
Fig 2: Structural equation model
In order to isolate the effect of treatment, we conduct group comparisons. To test whether households are motivated by monetary and non-monetary instruments to change water consumption we compared the above causality across different groups. Next, the model is extended so comparisons can be made over different groups.
3. Attitudes and pro-environmental behavior
In the field of household water demand research, efforts have been made to investigate monetary and non-monetary instruments. However little research has focused on the attitudinal and behavioral changes which result from such policy instruments. A significant amount of empirical works has been focused on social and psychological determinants of residential water consumption (see, Arbués et al., 2016; Dean et al., 2016; Attari, 2014). For instance, Attari (2014) points out that nearly 30% of water consumption can be reduced through development of conservation habits. Similarly, behavioral models have been developed for energy saving (Eluwa and Siong, 2013), waste management (Mintz et al., 2019; Botetzagias et al., 2015) and transport (Brown et al., 2016). However, some other studies show that habits do not always influence water use, and habit strength may not mediate past or future conservation (see, Jorgensen et al., 2013). But despite the importance of attitudinal and behavioral changes in sustainable resource management, the nexus of
8
economic instruments and behavioral factors, particularly for water consumption management, remains unexplored.
In addressing this important gap in the literature, we included nine behavioral questions in the survey and respondents were asked to provide their behavioral preferences according to a five-point Likurt scale of 1 (“Never”) to 5 (“Always”). These nine questions embedded in the survey are related to either water consumption efficiency or curtailment. The summary of self-reported answers is shown in panel A of Table 2. For instance, respondent were asked to verify the statement “I turn off the tap when soaping up in the shower”. Some of these questions are related to increasing the efficiency of water use (see, questions 1, 2) while others relate to curtailment in use (3, 4). Based on the descriptive statistics, most of respondents reported environmentally friendly behavior for at least 4 behavioral questions (2,6,7 and 8). For the rest of the questions, the magnitude of the mean values was higher than the standard deviations. For instance, most of the respondents “turn off the tap while washing dishes” (mean=1.861, SD=1.260). However, the favorable adaptation varied across differently treated groups.
Table 2
Attitudes and behavior
Variable Question/Statement Scale Mean SD
(A) Behavior
1 I turn off the tap when soaping up in the shower Never (1) Rarely (2) Sometimes (3) Usually (4) Always (5)
1.861 1.260 2 I turn off the tap when washing dishes 4.466 0.821 3 I try to reduce the number of baths/ showers 2.763 1.430 4 I try to reduce the length of baths/ showers 3.904 1.119
5 I reduce toilet flushes 3.453 1.338
6 I turn off the tap when cleaning teeth 4.598 0.850
7 I use a shower rather than a bath 4.690 0.769
8 I have taken steps to use less water in the garden 4.446 0.888 9 I wash the car without using domestic tap water.
(For example, using rain water or parking the car
out when it is raining) 3.790 1.445
(B)
Attitudes 1 How would you rate your attitudes towards environmental issues and environmental conservation? Never (1) to Always (5) Strongly agree (1) Agree (2) Neutral (3) Disagree (4) Strongly disagree (5) 1.541 0.576 2 Do you agree with the following? Currently, we
as a society are acting sufficiently to protect our environment in order to provide a better place for
our next generation. 1.693 0.616
3 Do you agree with the following? Currently, we as a society are acting sufficiently to conserve water so as to make sure that our future
generations are not affected by water scarcity. 3.029 1.039 Note: the pro-water behavior was assessed through 9 questions and households’ environmental attitudes were measured through 3 questions. Two variables (behavior and attitude) were created through factor analysis.
Panel B of the table shows self-reported environmental attitudes of participants after the treatments. The first two questions addressed general environmental attitudes while the third question focused on water. The decreasing scale reported is 1 (“Strongly agree” with the statement) to 5 (“Strongly disagree”). Most respondents agreed with the general environmental attitudes questions and somewhat less so for particular attitudes to residential water.
9
The comparison of behavioral and attitudinal question among treated and control groups are shown in Appendix 2. Of group one participants, most exhibit environmental friendly attitudes. This profile does not differ greatly with the other two groups. However, it is clear there is a noticeable difference between the reported attitudes and behavior they actually exhibit - as evidenced by their water consumption. The behavioral model reveals this relationship and provides a comparison between the groups.
4. Results
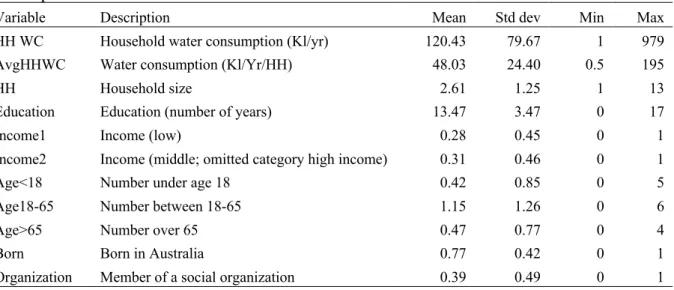
Table 3 sets out the variables used in the model other than attitudes and behavior. In our sample, annual household water consumption varies from 1Kl to 979Kl (mean=120, SD=80) and the per capita water consumption is 48KL (min=0.5, max=195Kl). It is noted that still lower water consumption could be possible through water conservation measures or by use of a rainwater harvesting tank. Average household size (HH) is 2.5 varying from 1 to a maximum of 13. Other important descriptive variables include household composition which, together with size, are assumed to have a relationship with water consumption. Education level of respondents and household income level are also included as socio-economic variables. Nearly 28% and 31% respectively of survey participants fall into low and middle-income categories with the remainder in the high-middle-income category. The education variable – taken as number of years of education – averages 13 years. Out of the sample, 77% are native born Australians (born in Australia – dummy variable). At least 39% of respondents are attached to a social organization (Organiz – a dummy variable; 1 if attach to an organization).
Table 3
Descriptive statistics
Variable Description Mean Std dev Min Max
HH WC Household water consumption (Kl/yr) 120.43 79.67 1 979 AvgHHWC Water consumption (Kl/Yr/HH) 48.03 24.40 0.5 195
HH Household size 2.61 1.25 1 13
Education Education (number of years) 13.47 3.47 0 17
Income1 Income (low) 0.28 0.45 0 1
Income2 Income (middle; omitted category high income) 0.31 0.46 0 1
Age<18 Number under age 18 0.42 0.85 0 5
Age18-65 Number between 18-65 1.15 1.26 0 6
Age>65 Number over 65 0.47 0.77 0 4
Born Born in Australia 0.77 0.42 0 1
Organization Member of a social organization 0.39 0.49 0 1
The SEM and MLE results of the model are reported in Table 4 in which column 2 presents the impact of selective variables on household water consumption; column 3 the impact of environmental attitudes on environmental behavior and finally, indirect effects are calculated. Column 5 calculates the total effect.
The key variables in this study - environmental behavior and attitudes - significantly reduce water consumption. In line with expectations, the pro-environment behavior promotes water conservation (coefficient -9.533). Similarly, respondents who are strongly imbued with environmental concerns contribute to water savings (coefficient 6.692). Where household
10
water conservation is concerned, the mediated impact of environmental attitudes on pro-environmental behavior is tested in this study. Respondents’ attitudes are shown to promote pro-environmental behavior and thereby indirectly reduce water consumption. The mediated impacts show an indirect effect as well as an attitude – behavioral relationship.
As expected and in line with previous research (see, Beal et al., 2013), the higher the household size the higher the water consumption (coefficient = 37.7). In terms of household structure, the literature show households with more elderly people consume less water (Hung et al., 2017; Dean et al., 2015; Gilg and Barr, 2006) while those with a greater number of young people, have higher water demand. However, our results indicate households with children tend to reduce water consumption (coefficient = -10.9). Moreover, further analysis (see, Table 5) indicates children are more responsive to knowledge and moral suasion than elders whereas, those of working age (18-650 are more responsive to monetary treatments. Our results indicate that education and income level are not significant factors except for the middle-income households which have a slightly higher tendency to reduce water consumption. Contrary to our expectation, Australians (those born in Australia) consume more than others. Also, members of social groups do not tend to conserve water resources.
Table 4
Behavioral model
Direct effect (HH
WC) Mediator (attitude - behavior) Indirect effect effectTotal a
Constant 18.02^ (12.57) 0.00361(0.0256) Behavior -9.533***(2.05) Attitude 6.692***(1.805) -0.276***(0.0231) 2.636***(0.638) 9.328 HH 37.70***(7.253) Education 0.042(0.378) Income1 -4.689(5.731) Income2 -5.823^ (4.165) Age<18 -10.39* (6.1) Age18-65 2.578(4.143) Age>65 -3.654(3.084) Born 11.86** (4.675) ation 1.582(4.223)
Standard errors in parentheses, significant at ^ p<0.20, * p<0.10, ** p<0.05, *** p<0.001 Note: HH WC= Household water consumption, Behavior= Pro-water behavior, Attitude= Environmental attitude.
a Only significant variables are reported.
The focus of this study is to investigate whether treated households respond differently where they are recipients of information on the most sustainable resource management policies. The literature provides evidence on the impact of policy intervention on sustainability or pro-environmental behavior. For example, a similar study investigating the impact of a water savings campaign, shows a reduction of water consumption but simultaneously increased energy consumption (Tiefenbeck et al., 2013). Their finding suggests that, on balance, such a campaign does not influence pro-environmental behavior. What is of interest to us is whether water demand management policy interventions can lead
11
to sustainable changes to attitudes and pro-environmental behavior of consumers. A further analysis within the sample was therefore carried out by means of group comparison (Table 5).
Table 5
Comparison of different treatments
Group Direct effect (HH WC) Mediator (attitude - behavior) Indirect effect effectTotal a
Constant Group 1 18.56(21.75) 0.00817(0.0391) Group 2 25.24*(13.73) -0.00911(0.0471) Group 3 -19.76(29.76) 0.025(0.0711) Behavior Group 1 -11.21***(2.714) Group 2 -9.539***(2.578) Group 3 -4.282(5.063) Attitude Group 1 10.86**(3.619) -0.322***(0.0512) 3.609***(0.929) 14.469 Group 2 4.829**(1.621) -0.255***(0.0355) 2.431**(0.766) 7.26 Group 3 3.121(4.911) -0.219***(0.0643) 0.936(1.09) HH Group 1 30.22**(9.666) Group 2 38.74***(4.387) Group 3 66.15**(25.2) Education Group 1 0.283(0.644) Group 2 -0.445(0.702) Group 3 0.783(1.389) Income1 Group 1 10.64(11.73) Group 2 -17.20**(6.314) Group 3 -12.31(13.51) Income2 Group 1 -0.581(5.64) Group 2 -13.57**(5.897) Group 3 -3.939(13.24) Age<18 Group 1 -4.215(9.598) Group 2 -10.57*(6.427) Group 3 -37.60^(23.46) Age18-65 Group 1 9.113**(4.133) Group 2 1.202(2.629) Group 3 -12.82(12.54) Age>65 Group 1 -2.452(4.288) Group 2 -1.651(2.936) Group 3 -9.552(10.25) Born Group 1 10.87(9.208) Group 2 14.70**(4.805) Group 3 2.424(11.76) Organization Group 1 5.974(6.916) Group 2 -1.893(4.385) Group 3 9.273^(6.252)
12
Note: HH WC= Household water consumption, Behavior= Pro-water behavior, Attitude= Environmental attitude.
a Only significant variables are reported. Group 1, 2 and 3 are treated with non-financial
instruments, financial instruments and control group respectively.
The results clearly indicate that the treated households’ water consumption is influenced by attitudes and behavior. For instance, pro-environmental behavior decreases water consumption in both groups 1 & 2 (coefficients are -11.21 and -9.539 respectively) whereas the control group does not show any significant results. Similarly, the attitude coefficients are significant for treated groups. Attitudes favorably impact water management for both treated groups directly and indirectly (through behavioral change). Interestingly, the results show that the impact of behavior and attitudes are higher for group 1 (non-monetary intervention) compared to group 2 (monetary intervention) suggesting non-monetary intervention is a superior instrument for effecting sustainable management.
Carter and Milon (2005) conclude that the lower level of responsiveness of price is due to a lack of an awareness of price structure. Those who are aware of average and marginal prices tend to reduce water consumption. Similarly, in this study, households which were informed that they will receive monetary benefits tended to reduce water consumption. Interestingly, households responded differently on environmental attitudes and behavior in comparison to the control group (coefficient = -9.539). Moreover, the responsiveness to monetary treatment was less than the non-monetary group. Thus, in line with the accepted theoretical underpinnings, monetary incentives did reduce water consumption: however, its effects on behavioral and attitudinal changes are less than non-monetary instruments. In other words, increased environmental awareness and moral suasion positively influenced attitudes and pro-environmental behavior.
5. Discussion and conclusion
In this paper, we explore the comparative ability to use monetary and non-monetary rewards for promoting environmental attitudes and pro-environmental behavior. Through experimental design we collected their real-life water consumption decisions under different experimental treatments – monetary or non-monetary. Despite the large body of literature exploring these impacts on water saving, none consider behavioral and attitudinal changes – which is the motivation for this study. First, we find environmental attitudes and behavior positively impact on reduction of water consumption. Through structural equation modeling, we explore the positive relationship between attitudes and environmental behavior. The results reconfirm that environmental attitudes promote pro-environmental behavior. Extending this relationship, attitudes and behavior tend to conserve water resources.
For treated households in the survey (both monetary and non-monetary) water consumption decisions are shown to be significantly influenced by their environmental attitudes and behavior - which is in contrast to the control group. Contrary to our findings, an experimental analysis by Lanzini and Thøgersen (2014) found that peoples’ green purchasing behavior was motivated more by monetary incentives than by encouraging environmental behavior. However, their study is limited by the use of only students in their sample and who are therefore within a defined age group and have a particular education and income level in comparison to the general public. There is, nevertheless, supportive evidence for non-monetary instruments. For instance, von Borgstede et al. (2013) found that increased public awareness leads to environmentally positive changes in attitudes and thereby facilitates
13
adoption of new technologies and policy implementation. Based on our findings, we argue that knowledge and moral suasion are indeed effective toolkits than justify influencing consumers to accept changes to water prices in order to achieve sustainable resource conservation. Despite both monetary and non-monetary measures significantly reducing water consumption, non-monetary measures can be more sustainable since they tend to have a larger influence on attitudes and behavior. The consumers’ response to price increases may be short term rather than leading to a change in their behavior. Indeed this research suggests that investment in non-monetary instruments - i.e. knowledge and moral suasion - can lead to sustainable water resource management outcomes. This research does have some limitations. When implementing policies to reduce water consumption through attitudinal changes, it is important to investigate the public’s behavioral changes in managing other resources, i.e. energy. This study also considers only a specific brief timeframe and not seasonal variations in measuring demand for urban water. There is therefore a need for further studies which can confirm the effectiveness of these intervention measures in the longer term. The importance of considering seasonal variations on behavior and attitudes is also important as many studies suggest this has an impact on resource saving (see, Kisakye and der Bruggen, 2018).
14 References
Arbués, F., Bolsa, M. Á., & Villanúa, I., (2016). Which factors determine water saving behaviour? Evidence from spanish households. Urban Water Journal, 13(5), 511-520. Attari, S. Z., 2014. Perceptions of water use.Proceedings of the National Academy of
Sciences,111(14), 5129-5134.
Baki, S., Rozos, E., & Makropoulos, C., (2018). Designing water demand management schemes using a socio-technical modelling approach. Science of the Total Environment, 622, 1590-1602.
Beal, C. D., Stewart, R. A., & Fielding, K., (2013). A novel mixed method smart metering approach to reconciling differences between perceived and actual residential end use water consumption.Journal of Cleaner Production, 60, 116-128.
Birrell, B., Rapson, V., & Smith, T. F., (2005). Impact of demographic change and urban consolidation of domestic water use. Melbourne: Water Services Association of Australia. Retrieved; http://www.amwa.net/galleries/climate-change/WSAAOccPaper15.pdf.
Botetzagias, I., Dima, A. F., & Malesios, C., (2015). Extending the theory of planned behavior in the context of recycling: The role of moral norms and of demographic predictors.Resources, Conservation and Recycling,95, 58-67.
Brown, B. B., Werner, C. M., Smith, K. R., Tribby, C. P., Miller, H. J., Jensen, W. A., & Tharp, D., (2016). Environmental, behavioral, and psychological predictors of transit ridership: Evidence from a community intervention.Journal of Environmental Psychology,46, 188-196.
Carter, D. W., & Milon, J. W., (2005). Price knowledge in household demand for utility services.Land Economics,81(2), 265-283.
Chenoweth, J., López-Avilés, A., Morse, S., & Druckman, A., (2016). Water consumption and subjective wellbeing: An analysis of British households.Ecological Economics,130, 186-194.
Comerford, E., (2014). Understanding why landholders choose to participate or withdraw from conservation programs: A case study from a Queensland conservation auction. Journal of Environmental Management, 141, 169-176.
Dalhuisen, J. M., Florax, R. J., De Groot, H. L., & Nijkamp, P., (2003). Price and income elasticities of residential water demand: a meta-analysis. Land Economics, 79(2), 292-308.
Dean, A. J., Lindsay, J., Fielding, K. S., & Smith, L. D., (2016). Fostering water sensitive citizenship–Community profiles of engagement in water-related issues.Environmental Science & Policy,55, 238-247.
Distefano, T., & Kelly, S., (2017). Are we in deep water? Water scarcity and its limits to economic growth. Ecological Economics, 142, 130-147.
Duflo, E., Glennerster, R., & Kremer, M., (2007). Using randomization in development economics research: A toolkit. Handbook of Development Economics, 4, 3895-3962. Fielding, K. S., Spinks, A., Russell, S., McCrea, R., Stewart, R., & Gardner, J., (2013). An
experimental test of voluntary strategies to promote urban water demand management. Journal of Environmental Management, 114, 343-351.
Fox, C., McIntosh, B. S., & Jeffrey, P., (2009). Classifying households for water demand forecasting using physical property characteristics. Land Use Policy, 26(3), 558-568. Garcia-Cuerva, L., Berglund, E. Z., & Binder, A. R., (2016). Public perceptions of water
shortages, conservation behaviors, and support for water reuse in the US. Resources, Conservation and Recycling, 113, 106-115.
15
Ghimire, M., Boyer, T. A., Chung, C., & Moss, J. Q., (2015). Estimation of Residential Water Demand under Uniform Volumetric Water Pricing. Journal of Water Resources Planning and Management, 142(2), 04015054.
Gilg, A. & Barr, S., (2006). Behavioral attitudes towards water saving? Evidence from a study of environmental actions. Ecological Economics, 57, 400-414.
Gkargkavouzi, A., Halkos, G., & Matsiori, S., (2018). A Multi-dimensional Measure of Environmental Behavior: Exploring the Predictive Power of Connectedness to Nature, Ecological Worldview and Environmental Concern. Social Indicators Research, 1-21.
Goonetilleke, A., Liu, A., Managi, S., Wilson, C., Gardner, T.,Bandala, E., Walker, L., Holden, J., Wibowo, A., Suripin, S., Joshi, H., Bonotto, D., & Rajapakse, D. (2017). Stormwater reuse, a viable option: Fact or fiction? Economic Analysis and Policy,
56, 14-17.
Haque, M. M., Rahman, A., Hagare, D., & Kibria, G., (2014). Probabilistic water demand forecasting using projected climatic data for Blue Mountains Water Supply System in Australia. Water Resources Management, 28(7), 1959-1971.
Hays, A. F., & Preacher, K. J., (2014). Statistical mediation analysis with a multicategorical independent variable. British Journal of Mathematical and Statistical Psychological, 67, 451-470.
Howarth, D. A. V. I. D., & Butler, S. A. R. A. H., (2004). Communicating water conservation: how can the public be engaged?. Water Science and Technology: Water Supply, 4(3), 33-44.
Hung, M. F., Chie, B. T., & Huang, T. H., (2017). Residential water demand and water waste in Taiwan. Environmental Economics and Policy Studies, 19(2), 249-268.
Jayarathna, L., Rajapaksa, D., Managi, S., Athukorala, W., Torgler, B., Gifford, R., Garcia-Valiñas, M. & Wilson, C., (2017). A GIS based spatial decision support system for analyzing residential water demand: A case study in Australia. Sustainable Cities and Society, 32: 67-77.
Jorgensen, B. S., Martin, J. F., Pearce, M., & Willis, E., (2013). Some difficulties and inconsistencies when using habit strength and reasoned action variables in models of metered household water conservation. Journal of Environmental Management, 115, 124-135. doi: 10.1016/j.jenvman.2012.11.008
Kisakye, V., & Van der Bruggen, B., (2018). Effects of climate change on water savings and water security from rainwater harvesting systems. Resources, Conservation and
Recycling, 138, 49-63.
Klaiber, H. A., Smith, V. K., Kaminsky, M., & Strong, A., (2014). Measuring price elasticities for residential water demand with limited information. Land Economics, 90(1), 100-113.
Lanzini, P., & Thøgersen, J., (2014). Behavioural spillover in the environmental domain: an intervention study. Journal of Environmental Psychology, 40, 381-390.
Linden, A., & Karlson K. B., (2013). Using mediation analysis to identify causal mechanisms in disease management interventions. Health Services and Outcomes Research Methodology, 13, 86-108.
Lucio, M., Giulia, R., & Lorenzo, C., (2018). Investigating Attitudes towards Water Savings, Price Increases, and Willingness to Pay among Italian University Students. Water Resources Management, 32(12), 4123-4138.
Maki, A., Burns, R. J., Ha, L., & Rothman, A. J., (2016). Paying people to protect the environment: A meta-analysis of financial incentive interventions to promote proenvironmental behaviors. Journal of Environmental Psychology, 47, 242-255.
16
Maas, A., Goemans, C., Manning, D., Kroll, S., Arabi, M., & Rodriguez-McGoffina, M., 2017. Evaluating the effect of conservation motivations on residential water demand. Journal of Environmental Management, 196, 394-401.
Mintz, K. K., Henn, L., Park, J., & Kurman, J., (2019). What predicts household waste management behaviors? Culture and type of behavior as moderators. Resources, Conservation and Recycling, 145, 11-18.
Newton, P. & Meyer, D., (2012). The determinants of urban resource consumption. Environment and Behavior, 44, 107-135.
Olmstead, S. M., & Stavins, R. N., (2009). Comparing price and nonprice approaches to urban water conservation. Water Resources Research, 45(4) W04301, doi:10.1029/2008WR007227.
Olmstead, S. M., Hanemann, W. M., & Stavins, R. N., (2007). Water demand under alternative price structures. Journal of Environmental Economics and Management, 54(2), 181-198.
Preacher, K., & Hayes, A., (2008). Asymptotic and resampling strategies for assessing and comparing indirect effects in multiple mediator models. Behavior Research Methods, 40, 879–891
Randolph, B., & Troy, P., (2008). Attitudes to conservation and water consumption. Environmental Science & Policy, 11(5), 441-455.
Ratnasiri, S., Wilson, C., Athukorala, W., Garcia-Valiñas, M. A., Torgler, B., & Gifford, R., (2018). Effectiveness of two pricing structures on urban water use and conservation: a quasi-experimental investigation. Environmental Economics and Policy Studies, 20(3), 547-560.
Steg, L., & Vlek, C., (2009). Encouraging pro-environmental behaviour: An integrative review and research agenda. Journal of Environmental Psychology, 29(3), 309-317. Steg, L., Bolderdijk, J. W., Keizer, K., & Perlaviciute, G., (2014). An integrated framework
for encouraging pro-environmental behaviour: The role of values, situational factors and goals. Journal of Environmental Psychology, 38, 104-115.
Tiefenbeck, V., Staake, T., Roth, K., & Sachs, O., (2013). For better or for worse? Empirical evidence of moral licensing in a behavioral energy conservation campaign. Energy Policy, 57, 160-171.
van der Werff, E., Steg, L., & Keizer, K., (2013). The value of environmental selfidentity: The relationship between biospheric values, environmental selfidentity and environmental preferences, intentions and behaviour. Journal of Environmental Psychology, 34, 55e63.
Vörösmarty, C.J., McIntyre, P.B., Gessner, M.O., Dudgeon, D., Prusevich, A., Green, P., Glidden, S., Bunn, S.E., Sullivan, C.A., Liermann, C.R. & Davies, P.M., (2010). Global threats to human water security and river biodiversity. Nature, 467: 555-561. Von Borgstede, C., Andersson, M., & Johnsson, F., (2013). Public attitudes to climate change
and carbon mitigation—Implications for energy-associated behaviours. Energy Policy, 57, 182-193.
Wichman, C.J., (2014). Perceived price in residential water demand: Evidence from a natural experiment. Journal of Economic Behavior & Organization, 107: 308-323.
Willis, R. M., Stewart, R. A., Giurco, D. P., Talebpour, M. R., & Mousavinejad, A., (2013). End use water consumption in households: impact of socio-demographic factors and efficient devices. Journal of Cleaner Production, 60, 107-115.
Woodridge, J., (2007). ‘What’s New in Econometrics’ (Lecture Notes). Retrieved on 3 October 2013. Available from: http://www.nber.org/WNE/ lect_10_diffindiffs.pdf. Worthington, A. C., & Hoffman, M., (2008). An empirical survey of residential water
17
Yan, L., McManus, P., & Duncan, E., (2018). Understanding ethnic differences in perceptions, attitudes, and behaviours: a study of domestic water use in Sydney. Geographical Research, 56(1), 54-67.
Yoshida, Y., Tanaka, K., & Managi, S., (2017). Which dynamic pricing rule is most preferred by consumers?—Application of choice experiment. Journal of Economic Structures, 6(1), 4.
Zhao, J., Ni, H., Peng, X., Li, J., Liu, J. (2017). Impact of water price reform on water conservation and economic growth in China. Economic Analysis and Policy, 51, 90-103.
Appendix 1:
Group Sub-group Treatment
Non-monetary
Knowledge Households in this group were treated to influence pro-water behavior, and increase their knowledge. For example the possible inefficient use of water and water wastage due to dripping taps were pointed out. The supply side
limitations, particularly due extreme weather events, were also emphasised. In this context, the importance of water saving and the way the household can manage in-door and out-door water use was set out.
Moral suasion The group was informed of the future critical importance for Australia of conserving water resources given its globally high level of water scarcity. Current and past water scarcity experiences in different cities were cited. Also highlighted, was the importance of water saving for national prosperity, especially in regards to the agricultural sector. Overall, through these letters we highlighted the responsibility of Australians to conserve nature and behave in a way which promotes national prosperity.
Knowledge/
moral suasion Both knowledge and moral suasion factors were highlighted. Monetary Monetary
rewards-current rate
This group was treated by informing them that, if they consumed less than the allowed maximum water allocation for Brisbane, they would be rewarded by an amount
calculated at the market rate of water saving- up to 200 litres/day/head - and based on a tiered system of rewards. Monetary
rewards-half of the current rate
This group was treated by informing them if they consumed less than the maximum allocation of water in Brisbane, they would be rewarded by an amount calculated at half of the market rate of water saving – up to a
maximum 200 litres/day/head - and based on a tiered system of rewards.
18
rewards-fixed rate
consumption is less than 200 litres/day/head based on a fixed rate.
Lottery This group of households were informed that those who consumed less than 140 litres/day/head would be included in a special lottery drawing.
Control Control Participated voluntarily.
Appendix 2: Figure 1 (a) (b) (c) 0% 10% 20% 30% 40% 50% 60% 70% 80% 90% 100% beh1 beh2 beh3 beh4 beh5 beh6 beh7 beh8 beh9
Group 1
1 2 3 4 5 0% 10% 20% 30% 40% 50% 60% 70% 80% 90% 100% beh1 beh2 beh3 beh4 beh5 beh6 beh7 beh8 beh9Group 2
1 2 3 4 519
Note: 1,2,3,4 and 5 is the scaler – never, rarely, sometimes, usually and always, respectively.
0% 10% 20% 30% 40% 50% 60% 70% 80% 90% 100% beh1 beh2 beh3 beh4 beh5 beh6 beh7 beh8 beh9