Publisher’s version / Version de l'éditeur:
Vous avez des questions? Nous pouvons vous aider. Pour communiquer directement avec un auteur, consultez la première page de la revue dans laquelle son article a été publié afin de trouver ses coordonnées. Si vous n’arrivez pas à les repérer, communiquez avec nous à [email protected].
Questions? Contact the NRC Publications Archive team at
[email protected]. If you wish to email the authors directly, please see the first page of the publication for their contact information.
https://publications-cnrc.canada.ca/fra/droits
L’accès à ce site Web et l’utilisation de son contenu sont assujettis aux conditions présentées dans le site
LISEZ CES CONDITIONS ATTENTIVEMENT AVANT D’UTILISER CE SITE WEB.
Internal Report (National Research Council of Canada. Division of Building
Research), 1967-01-01
READ THESE TERMS AND CONDITIONS CAREFULLY BEFORE USING THIS WEBSITE.
https://nrc-publications.canada.ca/eng/copyright
NRC Publications Archive Record / Notice des Archives des publications du CNRC :
https://nrc-publications.canada.ca/eng/view/object/?id=d4472342-1e8a-4505-8318-46e88f93dd42 https://publications-cnrc.canada.ca/fra/voir/objet/?id=d4472342-1e8a-4505-8318-46e88f93dd42
Archives des publications du CNRC
For the publisher’s version, please access the DOI link below./ Pour consulter la version de l’éditeur, utilisez le lien DOI ci-dessous.
https://doi.org/10.4224/20338217
Access and use of this website and the material on it are subject to the Terms and Conditions set forth at
Earth pressures on Ottawa outfall sewer tunnel
NATIONAL RESEARCH COUNCIL CANADA
DIVISION OF BUILDING RESEARCH
EARTH PRESSURES ON OTTAWA OUTFALL SEWER TUNNEL
by
W. J. Eden and M. Bozozuk
ANALYZED
Internal Report No. 340 of the
Division of Building Research
OTTAWA January 1967
In 1961, the Soil Mechanics Section installed earth pressure cells in a tunnel driven through sensitive Leda clay in the City of Ottawa. This report describes in detail the instrumentation and gives in summary the observations
obtained over a 5 -year period. The report has been pr epar ed for information purposes and to encourage COmments and criticism of the methods used and conclusions drawn. The Division will welcome any c ornrn ent a by readers.
The report was prepared by W. J. Eden and
M. Bozozuk, Research Officers in the Soil Mechanics Section.
Ottawa
January 1967
R. F. Legget Director
EARTH PRESSURES ON OTTAWA OUTFALL SEWER TUNNEL
by
W. J. Eden and M. Bozozuk
In 1958, the City of Ottawa embarked on an extensive sewage treatment program. Two main features of the program were the construction of a sewage treatment plant with a capacity for 40, 000, 000 gal/day on the eastern limits of the city and a main outfall sewer tunnel running parallel to the Ottawa River terminating at the tr e at m erit plant. The tunnel near its eastern end was to have an inside diameter of 8 ft. The outfall sewer tunnel was constructed for the most part in bedr ock, but the last mile required the driving of the tunnel through extremely sensitive Leda clay.
With the co-operation of the City of Ottawa, the consulting engineers and the cont r act o r s , the Division of Building Research, National Research Council, undertook an experimental program to measure the earth pressures on the tunnel structure and the ground movements and changes in piezometric levels resulting from the tunn e l construction. This report gives a summary of the measurements.
TUNNEL STRUCTURE
The tunnel invert is founded at an average depth of 65 It below the surface. The outside diameter is 10 ft, the in:side diameter of the completed structure, 8 ft. The tunnel was driven from its west end by a rotary tunnelling machine and lined immediately with corrugated segmental steel liner rings. From 4- to 5-psi air pressure was maintained in the tunnel to assist with support during the excavation.
Each liner ring consists of 8 segments forming a circle. The top segment was placed first and the bottom segment last. To ensure good contact with the clay, the bottom liner segment was placed by jacking it against the neighbouring segments.
When necessary, grout was pumped into any space between the clay and the liner ring. Because of the well-trimmed
excavation made by the machine, little grouting was required, and in general the liner was in close contact with the surrounding clay.
Excavation for the tunnel section in clay began in July 1961 and was completed by 1 December 1961. On completion of the excavation and lining, the air pr essur e was r educed to atmospheric and work proceeded on the installation of the concrete, beginning at the east end. The r einfor ced concr ete is 1 ft thick and was placed pneumatically in two stages. The first stage was about
1/4-section placed at the invert. The next stage completed the structure. The corrugated steel lining was left in place. By this method of construction the tunnel was temporarily supported by a relatively flexible corrugated steel lining, and the completed structure is a relatively rigid reinforced concrete section.
SITE CONDITIONS
For the entir e length of the clay section the soil conditions are quite uniform. The surface is level, with a fairly high ground water table. Down to the depth of the tunnel the entire soil profile consists of Leda clay. From 0 to 8 ft the clay is friable and
oxidized; fr Om about 10 to 45 ft, it is quite stiff and r elati vely insensitive (S approximately 20). The natural water content averages 62
ーセイ
cent, the liquid limit 60 per cent and theplasticity index 35 per cent. Below this depth the clay is slightly coarser, with a natural water content of 50 per cent. The sensi-tivity of the lower clay is very high, in the or der of 600. In spite of its extreme sensitivity, the undisturbed clay behaved as a stiff brittle material during excavation. The depth of clay is somewhat variable, ranging from about 65 It below the surface at the west end to about 75ft at the east end. The clay is over -consolidated by about 3 tons per sq ft throughout the length of the tunnel.
Figure 1 is a plan of the tunnel section in clay, showing the location of the test installations at stations 325+75 and 376+21. Figure 2 is the log of a boring at the eastern end of the tunnel, but can be considered representative of the area. A feature of the site is the existence of a downward piezometric gradient in the clay. The change in effective stresses due to the piezometric gradient is shown in Figur e 2.
INSTRUMENTATION
The instrumentation consisted of settlement or ground movem ent gauges, piezometers, earth pressure cells and deformation measuring devices. The settlement gauges were installed near the west end of the tunnel and wer e intended to
3
monitor any surface movements caused by the tunnel construction and any settlements subsequent to construction. This installation at station 326+00 consisted of three ground movement gauges (Baracos and Bozozuk, 1957), each at a depth of 10 ft located on the centreline 25 and 50 ft north of the tunnel. Movements of these points were measured with reference to a deep bench mark by precise levelling. The ground mov em ent gauges were installed in June 1961, but were destroyed by a bulldozer after three months of observation.
Eleven pie z orn eter s wer e installed between stations 322+75 and 325+75 to measure the effects of tunnel construction on piezo-metric conditions. These were supplemented during the con-struction period by three piezometers installed behind the steel liner plates. Figure 3 gives the location of the piezometers with respect to the tunnel.
At approximately the midway point of the tunnel, near station 352+00, four additional piezometer s wer e installed at the edge of a wooded area remote from any water supply wells or other urban influences. At the east end of the project an extensive piezometric installation at the sewage treatment plant site was utilized to complement the general a s s e s s m ent of the piezometric regime.
All piezometers, except those inside the tunnel, were the Geonor type installed on the end of "E" drill rods (Bjerrum,
1956) and were read with an electrical probe. Those inside the tunnel were porous discs mounted in a brass housing and connected to a Bourdon gauge by a polythene tube, giving an essentially closed system.
To measure changes in the inside diameter of the flexible liner, brass studs were placed in the liner plates at diametrically opposite points. The diameter was measured with a telescoping rod to 0.001 ft. Attempts were also made to measure strains on the liner plate with an e xt en s o m et e r . Because of the loose bolting arrangement used to fasten adjacent liner plates, however, no coherent pattern of strain measurements could be achieved.
EARTH PRESSURE MEASUREMENTS
Attempts were made to measure the earth pressures acting on both the flexible and rigid linings. The instruments used were vibrating wire earth pressure cells similar to those described by
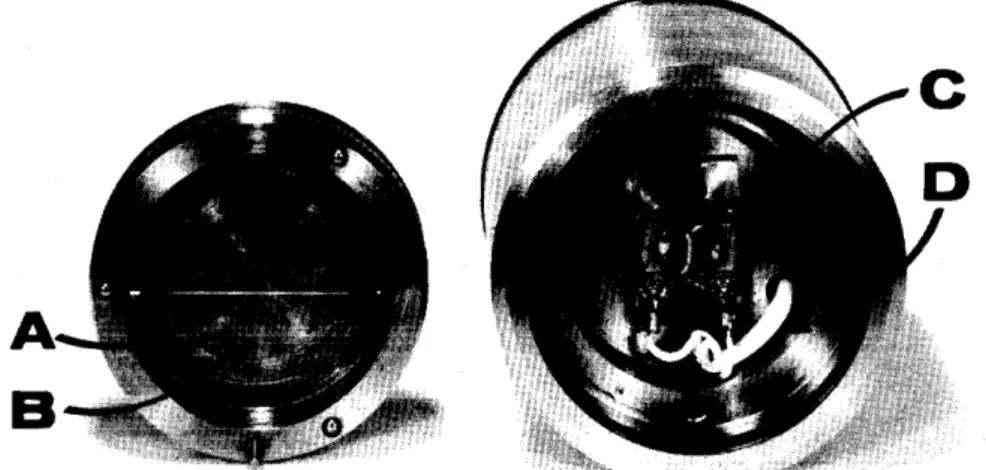
¢Hen (1958), and were manufactur ed and calibrated by Geonor A/S, Os Lo, Norway. Figure 4 illustrates the construction of the earth pressure cell. Its dimensions are 4. 5 in. in diameter by 1-1/2 in. high. The diaphragm of the cell is 3 -3/4 in. in diameter. The cells were mounted inside collars welded to the steel liner section, as illustrated in Figure 5, and positioned as near as possible to the cut surface of the clay.
To ensure that the diaphragm of the cell was in contact with undisturbed clay and to pr event any grout from penetrating between the clay and the diaphragm, thin-walled sharpened steel tubing was fitted inside the collar and the cells wer e positioned inside the tube. A back plate was placed over the collar on the inside of the tunnel and us ed to position a special tool to trim the clay face to conform to the shape of the diaphragm inside the tube. Later, the back plate was used to position the pressur e cell. The cell could be brought to the desired level of prestressing by means of a thrust nut on the back-up plate.
To carry out the installation one complete liner section was obtained from the contractor and brought to the laboratory for fitting. Lar ge removable patches (about 1 ft s q] wer e cut out of each segment. The collar s were installed in the patches.
Figure 6 is a vertical section of the liner and indicates the position of the collars. After the installation of the collars, dummy gauges wer e placed in the collar s and the test ring was installed in the tunnel by the contractor.
When the test ring was in place and any necessary grouting completed the installation of the earth pressure cells began. The dummy gauges were removed from the collar and an inspection was made. If necessary, the entire patch could be removed to clear away any grout from the cell area, but this step was not required for any of the cells. The appropriate length of the seamless thin-walled tubing was inserted and pushed a short distance into undisturbed clay and fixed in place with a set screw. A trimming tool was inserted in the tube, and using the back plate as a guide, the clay face was trimmed. The pressure cell was inserted with the sealing O-ring and flange loosely attached at the back of the cell (Figure 4(b».
The diaphragm of the cell was pushed up to the clay face and the 0 -ring sealed by tightening the flange. Spacers were then placed on the cell shaft and the back plate installed.
- 5
Finally the positioning nut was installed. The reading instrument was hooked to the lead wires and the cell was prestressed to the desir ed level by tightening the positioning nut, which was held in place with a jamb nut. The level of prestress chosen was that of full overburden pressure.
The lead wires from each cell were threaded through copper tubing and taken to a junction box on the tunnel roof, where the wires from the 8 cells were joined to the members of a 16 -conductor telephone cable. At the fir st installation,
at station 325+75, the conductor cable was encased in a polythene pipe hung from the tunnel roof and extended back through the air lock to a reading station located in the shaft at station 320+75. The copper tubing and polythene pipe were required to maintain atmospheric pressure inside the cell housing. The final step was to apply a sealed cover to the junction box and to pr otect the back of the cells with a heavy steel mesh.
This installation r equir ed near ly 600 £t of lead cable. Difficulties were encountered in obtaining readings in the pressur e cells owing to induction along the long unshielded
cable. Induction caus ed mor e than one cell to be excited
during the plucking phase of the reading sequence and resulted in badly scrambled return signals. Because of the unsatisfactory readings, the test ring was removed and re-installed at station 376+Z1 near the east end of the tunn el, Here the lead wires were extended to the ground surface by a drop hole using a
I-liZ-in. copper pipe. The total lead length was less than 100 ft and the difficulties in reading were ov e r c orn e,
The second installation was made on the flexible liner for only two weeks befor e the concr ete lining was placed'.
The cells remained in operation until April 1965, at which time three cells became unserviceable and the readings were terminated.
SETT LEMENT OBSER VATIONS
Because of the destruction of the ground movement gauges only three months of records were obtained. These covered the period of tunnel excavation under the site, and hence should have been indicative of the settlement behaviour. At the end of the three months, the gauge over the tunnel had settled O. 23 in. 25 ft from centreline 0.18 in.; 50 ft away the settlement was not
measurable. Because the soil was over -consolidated by about 3 tons per sq ft, the settlements should be clue only to elastic
and recompression settlements brought about by the change in effective stress. It is believed that the total settlement resulting from the tunnel excavation was very srna.Ll, For the first 1500 ft the tunnel passed under a housing development and no indication of any significant settlements have been
observed or reported since the tunnel was constructed.
PIEZOMETRIC OBSERVATIONS
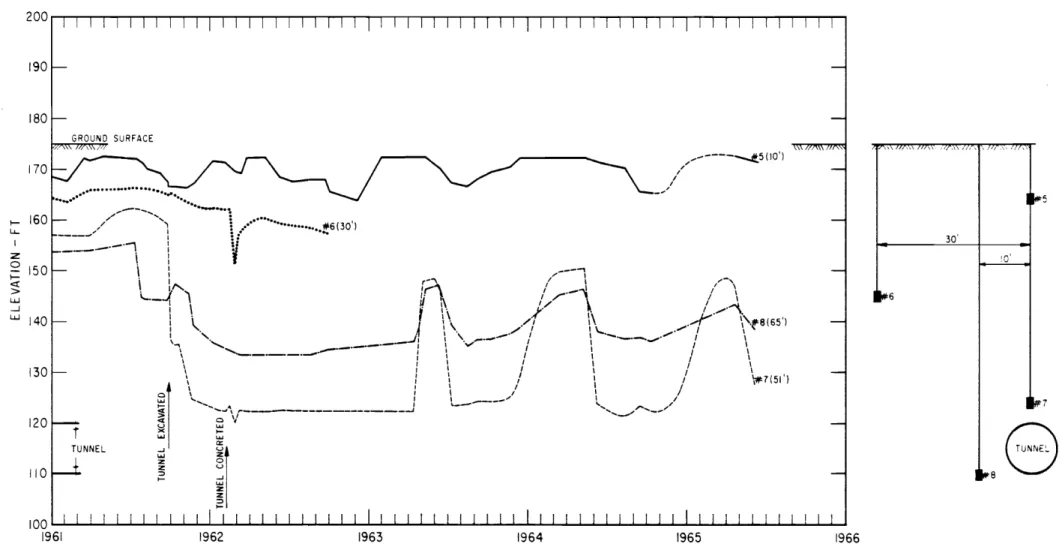
Before construction, piezometric observations had revealed a downward piezometric gradient on the site. This is shown in Figur e 7 during the ear I y part of 1961 near station 352. The tunnel construction had the over -all effect of a drain; that is, there was a tendency for water to flow toward the tunnel. Figure 8 indicates the effect of tunnel construction at thr ee different situations. No great quantities of water were involved, however, since drainage was not a problem during construction. The tunnel remained as a drainage sink even after the concrete lining had been placed (Figure 8). Only for a brief period during the spring run -off does the situation change. During these few weeks each year the piezometric levels rise.
At the start of the tunnel excavation a war king air pr es sur e of approximately one atmosphere was maintained for a few days. During this time the upper part of the working face was clay, with a more permeable glacial till in the lower part. This air pressure caused a temporary flow of water away from the tunnel. When the entire working face had extended into clay, the air pressure was dropped to 4 or 5 psi, and this slight pressure did not have any marked effect on the piezometric regime. Only those piezometers immediately behind the liner plates became desaturated.
In summary, the tunnel construction and structure appears to have the net effect of acting as a drainage sink. Because of the
extremely low permeability of the clay, the actual movement of water is very slight.
EARTH PRESSURE MEASUREMENTS
The first period of earth pressure measurements at station 325+75 cannot be considered sufficiently reliable for quantitative results because of the difficulties in reading the instruments with the long lead -in cable. They did, however,
- 7
indicate that the high pressur e conditions were nearly uniform about the tunnel, with the average pressure being about 2/3 of the full overburden pressure. Measurements on the diameter of the tunnel during this period indicated that the vertical diameter decreased with a corresponding increase in horizontal diameter. The change in diameter was in the order to O. 1 to O. 2 in. and occurr ed within one month of the installation of the test rings.
In November 1961 the pressure cells were re-installed at station 376+21 near the east end of the tunnel. Figure 9 indicates the pressure measured on the flexible liner plate two weeks after re -installation and compares the measurements with the calculated full overburden pressure. Each cell measures the earth pressure at only one small area, so that it is difficult to infer from the readings the distribution of pr essure about the
entire liner ring. The ratio of the average of the individual readings to the calculated overburden pressure was 0.64. The average pressure about the liner was therefore in about the same proportion to the overburden pressure as that in the first installation. Because the concreting operations began about two weeks after r e -installation of the test ring, there was insufficient time to determine any change in the pressure regime with time.
The concrete was placed pneumatically, the steel liner and the pressur e cells being subjected to SOme minor shocks as the concrete was placed. Readings on the earth pressure cells were rather erratic from 30 November to 9 December (see Figure 10). When the concrete began to cure, there was an immediate increase in the pressure measured by the top cell. Some increase also was recorded by the bottom cell. The top and bottom mea sur ernent s continued to rise for a period of about three months, while the measured average lateralpressures remained relatively stable. From March 1962 until April 1963 the tunnel was empty and the measured pressures remained nearly static (Figure 10). In April 1963, the tunnel was filled pending the start of operation of the treatment plant. It remained essentially full for a period of six weeks while the plant underwent an operational trial period. With the filling of the tunnel in April, the readings changed very rapidly. The top measured pressure dropped from 2. 9 KG/cm 2 to 1.2 KG/cm 2, and the pressure on the bottom cell increased slightly. Presumably this change was due to the sudden increase in weight caused by the filling of the tunnel. When the treatment plant began regular operation the flow in the tunnel dropped to about 25 per cent of capacity and the pressure readings tended toward those levels
established when the tunnel stood empty. (Since the tunnel carries both sanitary and storm sewage flow, its normal operation level is much below tunnel capacity. )
In November 1963 the top pressure cell became unservice-able, so that it was no longer possible to monitor the top pressure. Readings were continued on the five remaining serviceable cells until January 1965, when the plant underwent further trials and it was again possible to measure pressures with the tunnel filled to capacity. Readings at this stage on the five serviceable cells
showed a slight decr ease, but not of the same magnitude as was shown during the previous full load period.
In summary, the measured pressures on the rigid tunnel indicated a higher than anticipated pressure on the top of the tunnel, a lower than expected one on the bottom. The top and bottom pressures averaged about 75 per cent of the calculated full overburden pressure. The lateral pressure remained relatively static at about 3/4 of the average vertical pressure. Because the pressures were measured at only eight points,
the actual average pressure conditions can only be approximated from the measurements.
DISCUSSION
Engineering literature contains references to several attempts to measure the pressure on tunnels. Possibly the case most similar to the case herein described is that of the Detroit water tunnel described by Housel (1943). The Detroit tunnel is about 13 ft outside diameter and was founded 70 ft below the surface in soft, plastic clay. Excavation was by hand methods under air pressure, with a thick reinforced concrete lining closely following the excavation. Housel (1943) measured pressures on the tunnel with Goldbeck cells from the time of construction in late 1930 until 1941. In time the pressures measured on the bottom of the tunnel exceeded full overburden pressure. The measured pressures at the top nearly equalled the overburden pressure, and the lateral pressures were about 70 ー・セ cent of the full overburden pressure. The pressures on the Detroit tunnel were relatively slow in achieving final
equilibrium - s orri e five to six years.
The Ottawa tunnel has an external diameter of 10ft and is founded 65 ft below the surface. The Ottawa clay is very stiff and extremely sensitive. The stress -strain behaviour of the
- 9
Ottawa clay could be described as brittle in contrast with the Detroit clay. Failure in a good unconfined compression test occurs at less than 1 per cent strain. Pressures on the Ottawa tunnel seemed to adjust more quickly than those on the Detroit tunnel. Measurements show that equilibrium is approached in a matter of months. This behaviour was indicated when the tunnel was rapidly filled in April 1963 and then emptied
in the following month. When the tunnel was filled, the pressure on the top of the tunnel dropped very rapidly, with only a slight increase in the bottom pressure. Presumably the increase in load caused a slight settlement that allowed the clay above the tunnel to mobilize its strength and temporarily relieve s orn e of the pressure on the top of the tunnel. Then as the clay relaxed as a result of the increased stress levels in the clay, the pressure was transferred back to the tunnel. Because of the relatively high deformation modulus of the clay, the required rn ov ern ent to bring about the transfer of stress need only be very small. The pressure indicated by the top cell (No.1) seemed to be reverting to its
former level when it ceased to function in December 1963. In contrast with the Detroit tunnel, the highest pressure of 3. 2 KG/cm 2 on the Ottawa tunnel was recorded by the top cell, and slightly higher than the full overburden pressure. This may have been the result of a local reaction between the soil and the tunnel crown caused by the interaction of the tunnel structure with the surr ounding soil.
CONCLUSIONS
Measurements taken in the field to assess the effect of driving a 10 -ft di arn eter tunnel thr ough over -consolidated, extremely sensitive clay lead to the following conclusions.
1..
Because of the over -consolidation, no appreciable settlement at the surface due to the consolidation of the clay was measured. As the clay behaved as a stiff, relativelyelastic material, no significant settlements resulted from loss of ground due to readjustments of the clay about the tunnel structure. This was aided by the method of tunnelling and the installation of tight -fitting temporary support.
2. The tunnel structure appears to have influenced the ground water regime. The site had a previously-existing downward gradient. When the tunnel was completed it continued to act as a drainage sink, although the volume of water drained is probably very small.
3. The flexible liner plate acted in accor dance with previous records of such construction (Ward, 1965; and Terzaghi, 1943) in that the vertical diameter decreased with a corresponding increase in lateral diameter. Because of the short time interval of pressure measurements on the flexible liner no definite conclusions can be stated as to the ultimate pressure to be resisted by the flexible liner. Approximately 2/3 of full overburden pressure was recorded, with the pressure tending to rise with time.
4. When the permanent, relatively rigid concrete lining was installed, a differ ence appear ed between the horizontal and vertical pressure on the tunnel. Higher than expected pressures were measured on the crown of the tunnel. As this reading was a reading at one point only, no inference can be made as to whether or not this was an average pressure condition on the crown. At the same time, the pressures measured on the tunnel invert were considerably less than overburden pressure. The average of the crown and invert pressure measurements was approximately 3/4 of the full overburden pressure. The lateral pressures were about 0.7 of the measured vertical pressures.
5. It is believed that the earth pressure cells functioned reasonably well, although their useful life was somewhat shorter than desired. Five of the eight cells were still operating after 4 years. Because each cell represents a pressure measurement at one point and because of the rate of attrition, it is recommended that futur e installations double or triple the number of pr essur e cells. This is especially important fo r the cells measuring
vertical and horizontal pressures. The response of the pressure cells to the sudden change in loading on filling the turm e l indicated that they were satisfactorily sensitive to pressure changes.
6.
The Leda clay behaved as a brittle elastic material in spite of its high sensitivity. When the loading conditions in the tunnel wer e suddenly incr eas ed during filling, the clay responded by mobilizing its strength and relieved the tunnel of s orn e external pressure. Compared to the Detroit clay, the Leda clay reacts to pressure changes more rapidly. The response time appears to be in the order of months rather than year s ,- 11
ACKNOW LEDGEMENTS
The work described in this report was made possible
by the full co-operation of several organizations. Acknowledgement is due to the Sewer Branch of the Dept. of Planning and Works
of the City of Ottawa. The Consulting Engineers, De l euw Cather and Co. of Canada Ltd., particularly Mr. L. J. Marshall of the Ottawa office, were most helpful in making arrangements for the various installations and in keeping the Soil Mechanics Section informed of the progress of work. Special thanks are due the contractor, Beaver Construction Co. Limited, especially Mr. John Dow, the Superintendent, for granting the necessary access to the site and for assisting with the actual installations.
REFERENCES
1.
Ba r a c o s , A. and M. Bozozuk. (1957). Seasonal movements in SOme Canadian clays. Proc., Fourth Int. Con£.Soil Mechanics, London. 2 -264-8.
2. Bjerrum, L. (1956). Letter to Editor - Geotechnique, Vol. 6, No.3, p. 157-158.
3. ¢>ien, K. (1958). An earth pressure cell for use
on short piles, Oslo Subway. Brussels Conference, 1958, on Earth Pressure Problems. Proc., Vol. 2, p.118-126.
4. Housel, W. S. (1943). Earth pressure on tunnels. Proc., A. S. C. E. Vol. 108, p. 1037 -1058.
5. Ward, W. H. and H. S. H. Thomas. (1965). The development of earth loading and deformation in tunnel linings
in London clay. Proc., Sixth Int. Soil Me ch , Conf, , Montreal, Canada, Vol. 2, p. 432 -436.
6. Ter zaghi, K. (1943). Liner -p Iat e tunnels on the Chicago subway. Proc., A. S. C. E., Vol. 108, p. 970 -1 007.
FIGURE
I -
PLAN OF TUNNEL
1·3 1::5001107'1 0'6 I 281 99-7 S.c.
I
SI
1 g/l t Ib/cuft 0·4 37 101·6 0'3 100 101·7 0'2 27 101·0 0-1 23 100·7 0·2 44 105'6 2· I 75 102·8 I· I 160 104·5 19 セRPP 108·9 0·4 >500 108-7 0-5 >500 110-4 0·4 >500 109·5 0-1 >500 109'1 0-' >500 108·2 61 % CLAY -71-6-0
-74 73 71-J
75 69 71 771
6 5 65 55 53 60 60 I 5·0\
I I 4preconsolセn
\ PRESSURE \ 4 I 5TRE5 5, KG /CM22·0
3·0
4·0
I1·0
セ|
セ|
.
,
\'\
\\
\
|セN
\ h
,-,
\
,'\
,
\
\
"
\\
\
, \Nセ
\ \ FULL "\ \ OVERBURDEN-1
-, "
PRESSURE4\
UNDRAINED \ \" SHEAR rEFFECTIVE \ STRENGTH -\ OVERBURDEN" セ PRESSURE "100
I I 80 I I I I セ t---4 セi .....
I I I ,i,
I I If ,I' 4'...
,M'"«
エMMセ I 1 - 1 - - - -...'1
I---t セL t---4 '.. セ \,..
I I , I I,
t---4 ..WN Wp WL I WATER CONTENT1 %20
40
60
o
0, i WEATHERED BROWN CLAY 50I -70I-
101-20
r-STIFF GREY CLAY WITH RED BANDS MODERATE30
セnsitivity
40
I-stiffgreセG
-if
60
セ CLAY TUNNEL EXTREMEI
SENSITIVIT セMMNNャ I I I I l I I I . I 80! , 1 , ! ! I I I I I I " I , ,FIGURE 2 - BORING LOG
a
SUMMARY OF TEST RESULTS
..
GM-3I
TUNNEL • GM-I. 326 -00 GM-2 GM-3 D·B·M· 15 •@
16. 14 • 13 • 12 •PLAN
D-B·M· GM-2II •
10 • 9f
I GM-I 325+ 79 325+75(P I,P3 8 P5 on TUNNEL) 325+ 71 325+67 SURFACE (ELEV· 175).
.
1-
II Legend: • 9D·B·M·- Deep Bench Mark
GM-3 - Ground Movement Gauge No.3 16 - Piezometer No.16 • 10 15 •
Q
Scale:(jn feet) 16 • 14 • TUNNEL k,
0 5 10 15 20 13 • P3 12 • P5 'IIVERTICAL COMBINED SECTION
FIGURE 3
INSTRUMENTATION
NEAR STATION 326
+
00
A
B
Figure 4. Earth pressure cells (a) Interior view of cell
A Vibrating wire B Diaphragm
C Magnet assembly D Lead wire
A Lead tube B Mounting post C Jamb nut D Positioning nut E Spacer F Flange G Sealing nut H Cell housing I Shelby tube
Figure 5. Installation of earth pressure cells (a) Exterior view of cell mounting
A Cell diaphragm B Shelby tube C Collar
A Lead tube B C ell £lang e
#8 CELL #7 CELL NO· 107 I セi I
セ
/---rf;---
Lセセ
NO 102OOセセN
OFLINERS'I ASSEMS':;;;-",\ " 'I
\
I I \ I \ I \ I \ f ,.3
- , I - CELL NO· 103\
,
\,
\/
\ / \ I \,
I /'"
...-...,
. // / . /---i----セ
CELL NO· 105,
#5I
FIGURE 6
SECTION
OF LINER RING SHOWING
POSITION OF EARTH PRESSURE CELLS
8
101 30' 6 / ....---.Jt.5(10') I I I . , /セi
セ u x セ ...J セ Z Z セ t-r
TUNNEL...
/'---...
.
....
-
...
"
/ .....
___oJ'"
'II :: ...••••••••••••••••••••••'*6(30')---_.-.\:
:y.
...
\ I • . I \. II\ I"
i....-1
"'I ,-"'\ ,..----,I , ' ( \ I I I \ ,. I \ ,-\ .,-\.
セ
I 1 / ' - \ I \ II
'0 1 / I \ I . ,I v I , I" " ....セ
'0' , / ', ' , \. . , ' I . / 'Iセ
,,
\セ
' - - - ' : : \."...--_".
,.
/ '
\ '-.... . / I..-I"
\'(8165'1.
, " I ,---....-... f ' \ : : , ' I \ , " " f ' " : \ I \ I \ <,セ
• : \ I \ / '... \r---J
L---./ \ / \;¥o7(51') セ セ IIi
LLセセェ
110 120 190 180 170 I - 160 u, I Z S? 150 I -et > lJ.J ...J lJ.J 140 130 1962 1963 1964 1965FIGURE 7 - VARIATION IN PIEZOMETRIC LEVELS AT STATION 352
180 50' ///"-" /f!''''
J ,
--1--
6 0 • 9 - f - 4 0 ' _ _ _ I 30'Mセ
MMイMZセ
20' ...-,;,;:4)
....
10 10' 15 14 ! ... . "'... 13'...." '.... 12 I I 1 I 20 10 itFEET
16'//
セNッL
--IT'
I I I MMセvUPG ,;.,;.,;... : 40'セ⦅j
30' 10--.'2
l
I I 20 10 tFEET
--_J.!.E.L__60' 12 I I I I. 20 10 lFEET
PIEZ.1Ik116 PIEZOMETRI ELEVATION 160 120 110 170 100 f- 150 I.L. I Z o ;:: 140 <t > W ....J w 130 BEFORE EXCAVATION(12 june 1961) atrAFTER EXCAVATIONpressure OJkm/cm2
(I sept 1961)
AFTER LINING COMPLETED
tlHlllel in regulor ooeratton
(3sept 1963)
FIGURE 8
EQUIPOTENTIAL
CONTOURS IN FEET OF WATER ABOUT CENTRE OF
TUNNEL NEAR STATION 326+00
DATE:
21·11· 61
AIR PRESSURE:
0
PSI
- - - CAL. OVERBURDEN PRESSURE
MEASURED PRESSURE
AVE
Uyl-
2·40
KG/CM
2
AVE MEASURED PRESSURE
=
1·95 KG/CM2
FIGURE 9
EARTH PRESSURE MEASUREMENTS - FLEXIBLE LINER SECTION
<.D ⦅MイMMMイMMMイMMMMイMMMイMMMイMMMイMMNLNNNNNNMGtBGBBMGtBGBBMLMMMMイMMNNNNNNNMMNNNNNNNMMNNNNNNNMMNNNNNNNMMNNNNNNNMMNNNNNNNMMNLセ w w 9 0 VI iii セX l-\!) u, W II: .-J