FLIGHT TRANSPORTATION LABORATORY REPORT R95-3
COMPETITIVE BEHAVIOR OF AIRLINES AT MULTIPLE AIRPORT SYSTEMS
FLIGHT TRANSPORTATION LABORATORY REPORT R95-3
COMPETITIVE BEHAVIOR OF AIRLINES AT MULTIPLE AIRPORT
SYSTEMS
EDMUND CHEN
COMPETITIVE BEHAVIOR OF AIRLINES AT MULTIPLE AIRPORT SYSTEMS by
Edmund Chen
Submitted to the Department of Aeronautics and Astronautics in Partial Fulfillment of the Requirements for the Degree of
MASTER OF SCIENCE IN AERONAUTICS AND ASTRONAUTICS ABSTRACT
The way passenger traffic is distributed at multiple airport systems continues to intrigue air transportation planners, urban planners, and policy-makers as researchers attempt to unravel how airlines, air travelers and airports relate to each other. While previous research efforts have typically concentrated on the air travelers' choice of airports, the current thesis addresses how the competitive behavior of airlines operating in a
deregulated environment influences the air traveler's choice of airports and the resulting distribution of passenger traffic in the multiple airport system.
The methodology of the research first involves identifying four scenarios under which airlines compete in multiple airport environments, after which an anecdotal analysis of a select number of city-pair markets for each scenario was performed to solicit
supporting evidence of competitive behavior of airlines. To keep the preliminary
investigation simple, the author has chosen to study the dual-airport systems at Chicago and Houston. Owing to limitations of the data from O&DPlus and ONBOARD, the author used a strict set of criteria to identify 14 city-pair markets to analyze the
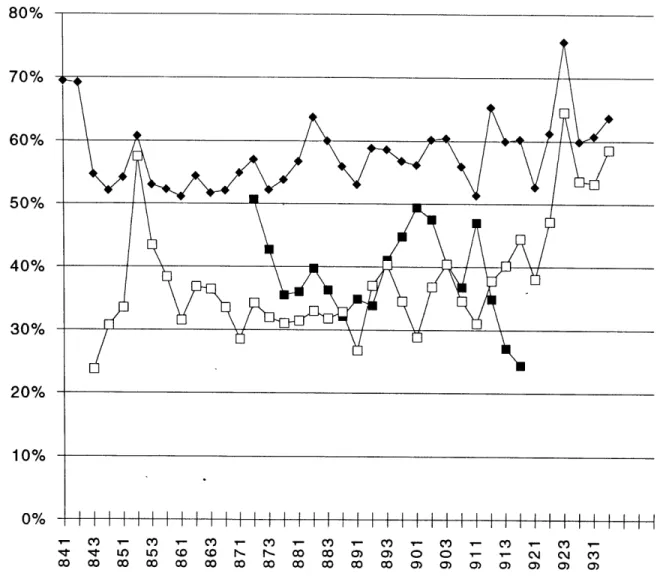
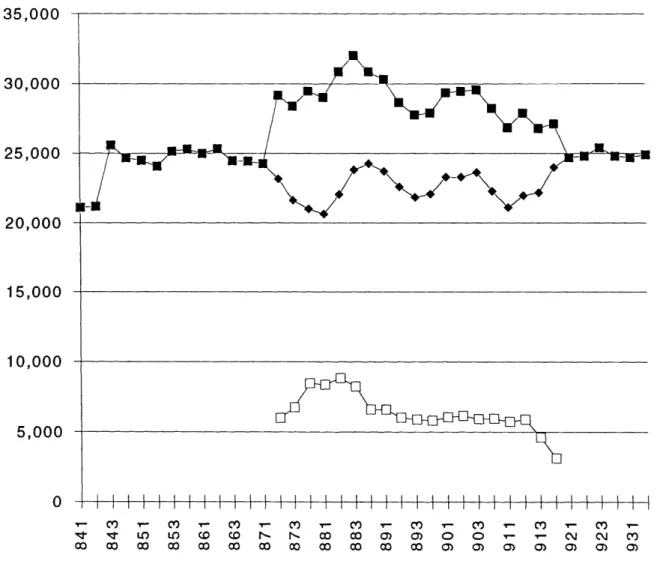
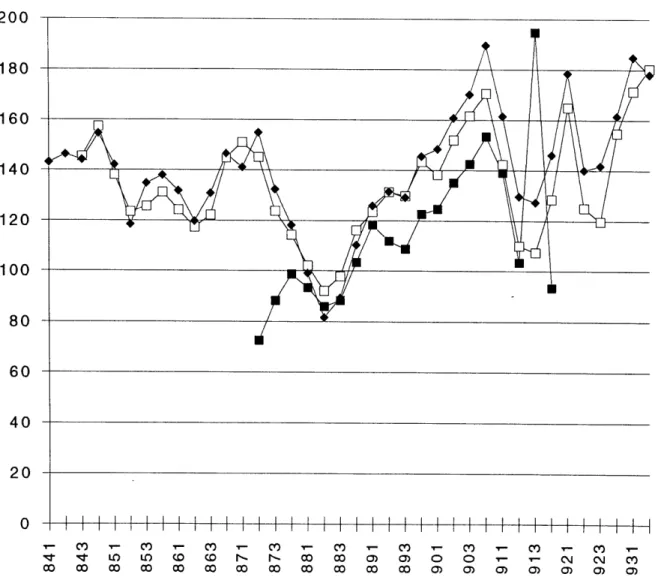
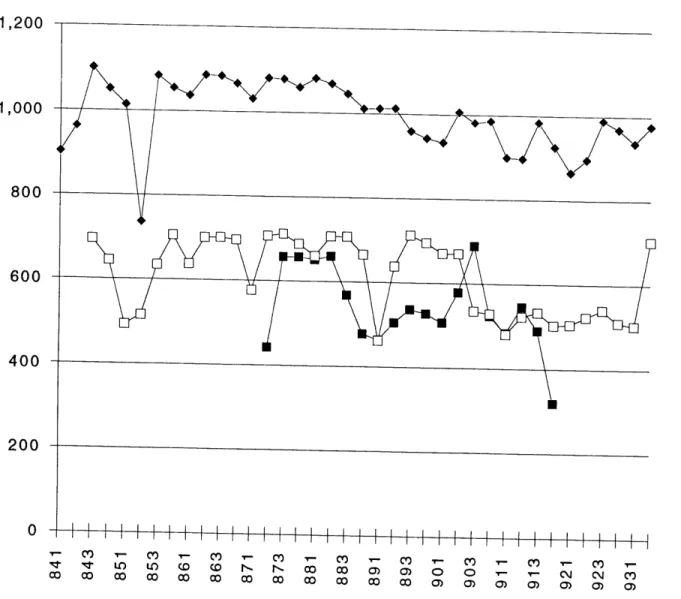
response of passengers and airlines to challengers entering the city-pair markets between 1984 and 1993. The six quantitative indicators used in the anecdotal analyses include: average fares, average number of nonstop departures per day each way, quarterly origin-destination traffic, quarterly non-origin-origin-destination traffic, average quarterly load
factors, and the quarterly total airport-to-airport origin-destination traffic.
The results of the research indicate that while competition is evident, a general trend of competitive behavior of the airlines in the multiple airport environment is not discernible. The entry of a challenger typically elicits a variety of responses. Significant stimulation of the origin-destination traffic was observed in cases where low-fare carriers entered the market. The fact that the number of non-origin-destination passengers usually exceeds the number of origin-destination passengers may indicate that justification for the service in the airport-pairs examined goes beyond simply satisfying the demand for travel in the origin-destination market. Although quantitative modeling techniques were not used in this study, the author believes that future researchers should contend with
the complex, multi-dimensional nature of airline competition before attempting to accurately model the competitive behavior of airlines at multiple airport systems. Thesis Supervisor:
Professor Robert W. Simpson
ACKNOWLEDGMENTS
I wish to thank Professor Robert W. Simpson for his invaluable guidance and words of encouragement, particularly during those occasions when I had drifted into clouds of confusion and despair. I am also grateful to both Professor Simpson and Mr. Ray Ausrotas for their coordinated efforts in securing the necessary funds for the conduct of this challenging project.
He bestowed upon me the coveted title of "King of O&DPLUS" when I would have humbly settled for an Honorary Master of Science in Official Airline Guides. But for all the fun I have had in 16.74 and 16.75, I feel wholly compelled to acknowledge Professor Peter P. Belobaba.
After an extended period of silent contemplation, I have finally realized that it may be appropriate to dedicate the following thesis to my mother, Irene, since she was the one person who made me spell "M-a-s-s-a-c-h-u-s-e-t-t-s I-n-s-t-i-t-u-t-e o-f T-e-c-h-n-o-l-o-g-y" when I was seven.
Owing to physical limitations of space on this page, I shall not be able to include the full names of each and every person who has made my life at MIT pleasant and memorable. However, I trust that you should know who you are by now. On the other hand, I will forgive those of you who have made my life at MIT absolutely miserable...
CONTENTS
A b stract...3
A cknow ledgm ents... 5
C ontents... ... 6
CHAPTER 1: INTRODUCTION...9
CHAPTER 2: REVIEW OF PREVIOUS LITERATURE ... 12
2.1 Modeling The Way Air Travelers Choose Between Airports...12
2.2 Other Approaches To The Problem... 15
2.3 Attempts At Modeling The Competitive Behavior Of Airlines...18
CHAPTER 3: DEFINING THE MULTIPLE AIRPORT SYSTEM...20
3.1 A Functional Definition...20
3.2 The Issue Of Ground Accessibility ... 23
CHAPTER 4: A WORD ABOUT COMPETITION...27
4.1 Defining Competition... 27
4.2 Airline Competition In The United States Since Deregulation...30
4.21 The Hub-And-Spoke-System... 31
4.22 Developments In Airline Marketing Practices...33
4.221 Frequent Flyer Programs (FFPs)...33
4.222 Computer Reservations Systems (CRSs)...35
4.223 Revenue Management... 36
4.224 Travel Agent Commission Overrides...37
4.23 N ew Entrants...37
CHAPTER 5: METHODOLOGY OF RESEARCH ... 40
5.1 Identifying the Competitive Variables... 40
5.2 Selecting The Multiple Airports For The Study ... 43
5.3 The Four Competitive Scenarios ... 46
5.31 Scenario 1: MAS<->Non-Hub Destination...47
5.32 Scenario 2: MAS<->Hub Of Challenger...48
5.33 Scenario 3: MAS<->Hub Of Incumbent...49
5.34 Scenario 4: MAS<->MAS...50
5.4 Data Sources And Selection Of Airport-Pairs...51
5.5 Method Of Analysis...53
CHAPTER 6: DATA ANALYSIS AND INTERPRETATION... 57
6.11 Scenario 1: Chicago-Des Moines...58
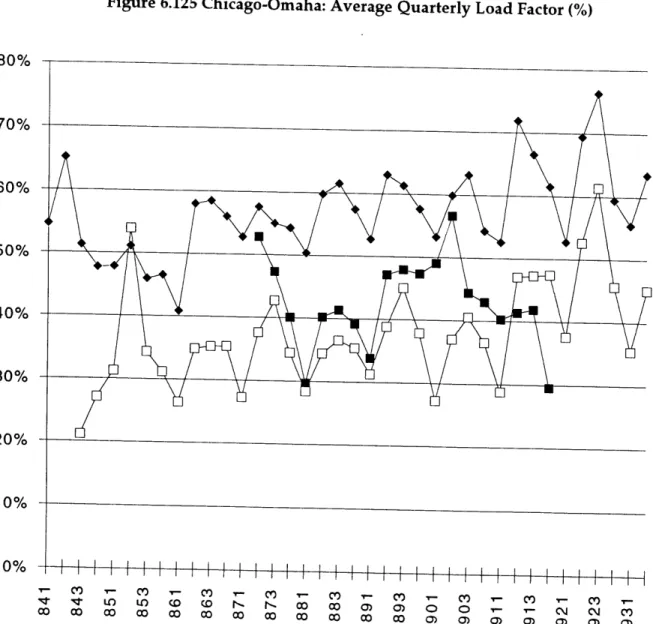
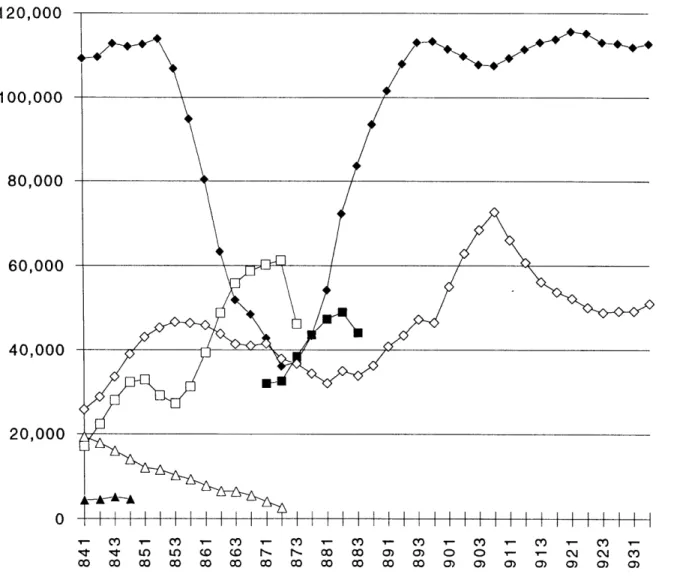
6.12 Scenario 1: Chicago-Omaha...67
6.13 Scenario 1: Houston-New Orleans...76
6.14 Scenario 1: Houston-San Antonio... 85
6.21 Scenario 2: Chicago-Atlanta...95
6.22 Scenario 2: Chicago-Pittsburgh...105
6.23 Scenario 2: Houston-Memphis...115
6.24 Scenario 2: Houston-St. Louis...124
6.31 Scenario 3: Chicago-Denver...134 6.32 Scenario 3: Chicago-Nashville...144 6.33 Scenario 3: Houston-Denver...153 6.34 Scenario 3: Houston-Newark...162 6.41 Scenario 4: Chicago-Detroit...172 6.42 Scenario 4: Houston-Dallas...183 CHAPTER 7: CONCLUSION...194 7.1 Summary Of Findings ... 194
7.2 Some Implications Of The Research...196
7.21 The Effect Of Low-Fare Entrants At Multiple Airport Systems...196
7.22 Addressing Risks In Airport Planning...199
7.3 Further Research...200
CHAPTER 1
INTRODUCTION
Large metropolitan areas that have more than one commercial airport within proximity of each other have intrigued air transportation planners, urban planners, and policy-makers for over two decades because problems pertaining to such multiple airport systems, as they can been aptly christened, are truly multidisciplinary in nature. A naive observer may well be tempted to ask, "Isn't one airport per city good enough?". Yet, as one moves one's fingers across a globe, one readily encounters examples of such multiple airport systems, notably those of Montreal, New York, Washington, Chicago, San Francisco, Los Angeles, Tokyo, Milan, Berlin, Paris, and London -just to name a few. Before the year 2000, new multiple airport systems at Osaka (Itami and New Kansai), Seoul and Hong Kong (Chep Lap Kok, Macau, Shenzhen) would be added to the already long list. However, the underlying feature that is of interest is the way passenger traffic is distributed amongst the airports in the system. In particular, if the distribution is unequal, one might well wonder what invisible forces could possibly bring about such an observation, and what could then be done to enhance the commercial viability of the under-used airports within the system.
At the onset, one may suspect that the airports are competitive with each other, especially if government intervention or entry barriers are absent. However, a common perception is that the air traveler is the user of the airport, in which case it then follows that the airports are merely providing a service that air travelers require. Accordingly, ground accessibility would be cited as an important determinant of the distribution of passenger traffic at multiple airport systems. In other words, depending on the quality of ground access, which can be quantified by travel time and cost, each airport has its defined catchment area if they all provide services to a common destination. Yet, this perception may be wholly inadequate because it implies that once an airport is built and the supporting roads and infrastructure are in-place, the distribution of the traffic is easily defined. While the notion that passengers do choose amongst airports is valid, one may note that the fundamental flaw is that the conventional model has left out the airlines as the other significant users of airports. In particular, by examining how
airports compete with each other, it is imperative that one understands how airlines choose amongst the airports, and how they respond to competitors operating at the same or other airports within the multiple airport system. Indeed, if airlines are motivated by profitability concerns, the justification for serving one or more airports
within the system should be commercial viability as opposed to public convenience or necessity. Although this idea paints a mercenary picture of airlines, the airlines do aim to provide a service that passengers prefer but wish to do so profitably -if they can.
Thus, the above discussion leads to the proposal of a relationship linking the three entities of air travelers, airlines and airports as shown below:
AIRPORTS
AIRLINES AIR TRAVELERS
In essence, the pictorial relationship states that the decisions of both air travelers and airlines determine the distribution of traffic in a multiple airport system; air
travelers are the customers of airlines, while airlines are, in turn, the customers of the airports. If the above hypothetical relationship is true on the grounds of basic logic and rationality, then one should closely examine the frequently ignored component in the equation: airlines. Indeed, while previous research efforts have usually focused on the way air travelers choose between airports and airlines, few have really ventured to unravel the mystery behind how airlines choose -to the extent that they can -amongst a given set of multiple airports in a large urban region. Although de Neufville [1] claims that capturing the competitive dynamics of airlines can be "quixotic", and that a "detailed model" is unnecessary because the results of the competitive fray are
predictable, the author sees the need to address the nature of competition amongst the airlines because understanding the interdependency between air travelers, airlines, and airports in multiple airport systems may help airport planners and airline managers better cope with the inherent uncertainties of traffic forecasting, and the subsequent use of airport facilities.
This thesis is conveniently divided into seven chapters, with the first four expounding on previous research efforts, a functional definition of the multiple airport system, the nature of competition, and how airline competition in the United States has changed since the advent of deregulation in 1979. Chapter 5 discusses the methodology of the research while Chapter 6 provides an anecdotal analysis of the competitive behavior of airlines in several selected cases of interest. Lastly, Chapters 7 comments on
CHAPTER 2
REVIEW OF PREVIOUS LITERATURE
A survey of previous literature on the subject of multiple airport systems revealed that few have attempted to understand the competitive behavior of airlines operating in multiple airport environments. Instead, previous research efforts have typically focused on aspects such as the differential ground accessibility to and from airports, the modeling of air travelers' choice of airports, and the economic feasibility of building secondary airports in the vicinity of an already established primary airport. Yet, the interdisciplinary nature of the subject is amplified by the fact that research is usually undertaken by those in the disciplines of engineering, economics, public policy, and urban planning. This chapter aims to highlight some of the more notable studies in multiple airport systems.
2.1 Modeling The Way Air Travelers Choose Between Airports
Recognizing the notion that airport utilization is the result of the interaction of choices made by both airlines and air travelers, Greig Harvey of Stanford University [2] investigated the way passengers choose among departure airports in the San Francisco Bay Area (the airports of San Francisco International, Oakland, and San Jose), drawing on a 1980 air passenger survey conducted by the Metropolitan Transportation
Commission of Oakland, California. Applying the multinomial logit model, developed by Professor Moshe Emanuel Ben-Akiva at Massachusetts Institute of Technology [3], to both business and non-business travelers, Harvey demonstrated that ground access time and frequency of direct air service to a chosen destination can account for a large
portion of the variation in airport use in a multiple airport city. The results further suggest that multiple-stop flights are "strongly preferred" to connecting flights when a traveler is choosing between a departure airport that is further but offers nonstop services to the final destination, and a nearer airport that offers multi-stop services to the same final destination. He concludes by emphasizing the importance of ground accessibility in the planning of multiple airport systems and the need to incorporate airline schedules in effectively predicting the air traveler's use of airports within a large urban area.
During the same period, Professor Norman Ashford of Loughborough University of Technology (United Kingdom) [4] conducted a similar research on multiple airports in the British Midlands, whereby the choice of airports was examined for air trips
originating at the airports of Birmingham, East Midlands, Luton, and
London-Heathrow. The study, which was based on verified data tapes provided by the British Civil Aviation Authority for two surveys conducted in 1975 and 1978, included comparatively more detailed questions about the type of trip, mode of access, and social economic status of the traveler. The results of the finding indicate that the model used in the Stanford study is "reasonably transferable", and that a traveler's choice of airports can be successfully predicted, given access times, flight frequency and fares. More specifically, the study revealed that access time and flight frequency are
important, in that order, for business and inclusive-tour trips, while the ranking for short haul domestic and leisure travelers is: fares, access times, then flight frequency. In other words, business passengers are more time conscious while leisure passengers are sensitive to fares.
With the "successful" [4] calibration of the model for choice of airports in both the United States and the United Kingdom, researchers went a step further to examine the applicability of the model to the developing country of Nigeria, a country where the standard of surface transport infrastructure is lower and the socio-economic conditions different from that of the United States and the United Kingdom [4]. The airports of interest were the two regional airports at Benin and Enugu. In an attempt to model the passenger's choice of airports for flights to the main hub at Lagos, researchers conducted an on-aircraft survey in the summer of 1987. The Nigerian model is unusual in two respects. First, stratification was not significant as passengers were overwhelmingly engaged in private or governmental business; few were leisure passengers. Second, fares and flight frequency were non-significant because strong governmental control over aviation meant that competition between airlines on the basis of fares did not exist, and that since Lagos is the main hub, flight frequency to the hub was abundant from both Benin and Enugu.
On the other side of the globe, Professor Frank S. Koppelman of Northwestern University and Masahiko Furuichi of the Japanese Ministry of Transport [5] analyzed air traveler's choice of departure airports in Japan for international travel by applying a nested logit model. A survey was conducted in 1989 on passengers departing from the four main Japanese international airports of Tokyo (Narita), Osaka (Itami), Nagoya, and Fukuoka, all of which offered more than 70 international flights per week1. The results of the study lend more support for the nested logit model than the multinomial logit model, and that both business and pleasure travelers place a high priority on airport access time, total trip time, and flight frequency.
One salient observation with regard to the four studies mentioned above is that while the Stanford study considered three airports within the same large metropolitan area, the studies in the United Kingdom, Nigeria and Japan, however, sampled airports which are in distinctly different cities and do not bear the same relationship as the three adjacent cities of, say, Oakland, San Jose, and San Francisco. Thus, the Bay area may be a multiple airport city, but United Kingdom, Nigeria and Japan should more aptly be classified as multiple airport countries. Yet, with the exception of Nigeria, the three studies conducted in the United States, the United Kingdom, and Japan display some similarities in that airport access, trip cost, and flight frequency do play a vital role in an air traveler's choice of departure airports, whether one speaks of a multiple airport city or a multiple airport country.
Although the Multiple Airport Demand Allocation Model (MADAM) has been used between 1973 and 1983 [6], the Joint Metropolitan Washington Council of Governments and Maryland Department of Transportation, in 1985, calibrated the model to perform extensive sensitivity analysis on the traffic distribution of passengers in the three Washington area airports (Baltimore, Dulles, National) for the purpose of using the quantitative results to support five policy alternatives regarding the
commercial use of airports. The model aimed to replicate the expected behavior of passengers and airlines in the demand, provision, and distribution of air services for a given operational environment, as encapsulated by the following four factors: the spatial and temporal pattern of passenger movements, the access time to airports, the airport's physical characteristics, and the airline's scheduling patterns. The Authorities were aware that the model could neither account for macroeconomic disturbances nor generate "economically optimum" [6] solutions for airlines; they readily recognized that the model was meant to be descriptive instead of prescriptive. However, an interesting feature of the model is its use of an iterative process to allocate passengers and flights at the airports within the system, whereby if one of the airports is full, the remaining pool of passengers is re-distributed to the other airports until none of the airports exceeds its designed capacity. Strange as it may sound, the Authorities claim that MADAM has been accurately calibrated to replicate the base year conditions and that it is flexible and responsive to incremental changes in airport access improvements, regional
developments, and airline scheduling practices. They further conclude that MADAM is "reasonably accurate for intra-regional passenger assignment to the airports, somewhat less accurate for the extra-regional distributions, and least accurate for the aircraft flight pattern distribution per airport." [6] Perhaps the most critical comment brought forth is
that the model needs to incorporate the current deregulated airline operating environment, if nothing else.
The last of the studies on airport choice that will be discussed is the work of a then doctoral student, Mahmoud Sulaiman Abbas, at the University of California at Berkeley [7]. Abbas' study narrowly focused on the factors that affect the choice of airports.of business travelers amongst a set of local airports in small communities that were located "within the sphere of influence" [7] of a large air transport hub. Using a statistical technique, with frequency of direct flights, fares, access cost and time, industry type, firm function and size, and traveler's age and income as key variables, Abbas found that the choice of airports in small communities is largely driven by the level of air service, with frequency of direct flights, available fares, and access cost and time appearing to be the most significant. Specifically, for a local airport that is close to a nearby large hub, parking cost appears to be the significant access cost variable, while for a local airport that is far from a nearby large hub, travel time appears to be the significant access cost variable. Nevertheless, Abbas did recognize that in order for the study to be of more general use, the study should be extended to non-business travelers under similar conditions, particularly because leisure travelers are now a sizable
proportion of the total air travelers in the United States. 2.2 Other Approaches To The Problem
A different twist to the methodology of research on multiple airports is seen in three studies pertaining to the dual-airport cities of Dallas/Fort Worth, Detroit, and Houston. Specifically, these studies examine the changes in the behavior of air travelers when there is a transfer of most operations from an old airport that is nearer the city to a new but more remote one. Indeed, de Neufville and King stressed that such "quasi experimental" [8] methods are recommended because the changes, if any, take place so quickly that few external factors would have little time to vary. This, in turn, reduces the chances of the investigator making misleading conclusions about relationships between the variables under scrutiny.
Specifically, in their study of the Texas intra-state services between Dallas/Ft Worth and San Antonio and Houston -provided by Braniff, Southwest Airlines and Texas International between 1971 and 1975 2 -de Neufville and King concluded that:
e Airport access is significant in short haul markets when travelers have a choice of airports and when the only available airport is made more remote. In fact, an overall decrease in demand is observed.
* Relative frequency is a vital determinant of market share, conforming to the usual S-shaped curve that relates market share and frequency share, when other factors do not intervene. However, when price and locational attributes enter the picture, relative frequency seems to have only secondary effects.
In a separate study, Linda E. Bower [9] had set forth with the hypothesis that air travel demand is elastic with respect to airport access costs, and that the distance of the airport from the city has an impact on the volume of passenger traffic at the airport. She defined elasticity as the percentage change in air passenger trips divided by the percentage change in airport access costs. Although "airport access costs" [9] had several components and Bower justified the way she estimated the individual
components, de Neufville and King unveiled two main shortcomings of her study. First, they disagree with the way Bower calculated some of the cost components. For example, she should not have assumed that access time is equivalent to the time it takes to travel between the center of the city to the airport since less than a quarter of the passengers actually travel between these two points. They argue that given the high quality of circumferential highways, access time between suburban areas, where many travelers originate, decreases as airports move away from the center of cities. Second, they express qualms about Bower's use of only one city (Houston) in the study because she would then not be able to control for other interfering factors (such as changes in air fares and the 1970 recession in air travel), and thus fully isolate the effect of the change in airport access. In any case, after gathering data from 50 city pairs for the period prior to the closing of the more accessible Hobby Airport and the period after the opening of Intercontinental Airport, she found that short haul traffic (under 300 miles) fell
dramatically after the relocation of the airport.
On the whole, de Neufville and King feel that most researchers seem unaware that people who frequently travel by air may choose to live near the airport.
Consequently, the assumption that people are stimulated to travel more when they are closer to the airport is suspect. Yet, a causal relationship of this kind should be made clear if the study is to be valid. To this end, de Neufville and King believe the best way to measure the effect of changes in airport access seems to be that suggested by R. E. Park [10] in his study of the relocation of Detroit's airport in 1947. Here, he avoided many of Bower's difficulties with various estimates of access by simply not even
attempting to relate traffic loss to any measure of accessibility. Instead, he compared the evolution of Detroit's traffic with that of a control group. In particular, Park compared, for a time frame of 10 years, traffic between Detroit and cities within 300 miles, to that between other Midwestern cities and destinations of the same distance, a procedure which effectively removes interference from changes in technology, recessions, and any other influential factors that might affect all similar airports. In short, the focus of the study then reduces to the disparity observed that can be safely attributed to the
relocation of the airport. Park concluded that the change in airport access did not affect the rate of growth, but did seem to have reduced the level of traffic by over 28% for a 25-mile move [10].
Nevertheless, credit must be given to Richard de Neufville for advocating the need to incorporate airline competition in studies of multiple airport systems. In particular, he emphasized that both airlines and passengers are users of airports, and that the conventional thinking that only passengers are the users is distinctly "myopic, slanted" [1]. Perhaps the reason that few have attempted to saunter through this avenue of thinking is that capturing the competitive behavior of airlines at multiple airports is "quixotic" [1], as de Neufville so believes. Yet, de Neufville's contribution to the study of multiple airport systems thus far is worth noting. In particular, he has extensively elucidated the planning and policy aspects of building secondary airports. He firmly believes that the size (dominant or subsidiary) and function (special character or undifferentiated) of a secondary airport should be carefully addressed as an insurance against possible serious future financial disasters, especially when planners casually assume that passenger traffic distributes itself according to "its own logic". [1] In short, de Neufville stresses that traffic cannot be forced to a specific airport within a system because the distribution is largely determined by the users -both passengers and airlines
-the result of which is usually an unequal distribution of the traffic at the airports considered. However, the existence of distinct markets may limit the effects of
concentration at any one airport, thereby permitting the co-existence of several airports within a metropolitan area, each of which can prosper in its own way. In the final policy recommendation for the United States Federal Aviation Administration [11], de
Neufville puts forth a "threshold of viability" [11] of secondary airports of between 10 to 12 million originating passengers per year, a figure which he obtained after examining 37 multiple airports systems around the world. The final word is that in planning secondary airports, de Neufville advocates the application of strategic dynamic planning since flexibility in long-term planning counteracts the inherent uncertainties of passenger traffic.
Perhaps the work of Francois Cohas can be seen as an attempt to unravel the competitive behavior of airlines at multiple airport cities from a specific facet. In his master's thesis [12], Cohas captured, in a limited way, the dynamics of airline
competition in multiple airports by developing a market share-frequency-share model. Based on a case study of the multiple airport systems of the San Francisco Bay Area, New York, and Washington, Cohas' main conclusion is that an S-shaped airport market share model can well be approximated by using just a few explanatory variables, namely, frequency of service, average fare at the designated airport, and average fare at competing airports.
2.3 Attempts At Modeling The Competitive Behavior of Airlines
As far back as 1973, Walter Gelerman [13] hinted an approach to modeling the competitive behavior of airlines by applying classical game theory. Building upon the familiar mathematical formula describing the S-shaped curve that relates market share and frequency share, Gelerman further recognized the interactive, interdependent nature of the competitive process whereby the market share of an airline depends not only on its own strategy but also upon that of its competitors. As such, he postulated that the actual market share of an airline is determined in a competitive game with symmetric properties in which each airline attempts to maximize its share but is opposed by other airlines sharing the same objectives. Accordingly, the solution to the game is then defined by equilibrium states in which each competitor is content that it cannot improve its position under existing market and regulatory constraints. Given that each strategy prescribes the number of flights an airline should offer at each of the airports in the multiple airport system, Gelerman believed that knowledge of the minimax strategy would then indicate how airlines use satellite airports. To execute several simulations of the game that he proposed, Gelerman constructed payoff matrices that showed all possible outcomes of different choices made by two airlines under various situations. The results of the simulations point in the direction that it is in the interest of an airline to concentrate all services at a particular airport of the multiple airport system because of geographic advantages associated with one of the airports. In addition, the second order effects are that an airline would offer a minimum number of flights at the satellite airports, in which case absolute matching of schedules is unlikely. Although the study was conducted during the pre-deregulation years, for which applicability may be severely limited today, the study is, nevertheless, insightful in that it may give future researchers some hope of modeling competitive behavior -if at all possible.
A more general model of the competitive behavior of airlines under regulation was conceived by John C. Panzar [14] in his 1974 doctoral dissertation at Stanford University, whereby he attempted to show the importance of quality variation in competition under price regulation. In his analysis of price and schedule quality in a stylized airline market, Panzar concluded that "social welfare maximization may require that the industry be subsidized" [14], but this subsidy will be quite small for the "heavily scheduled" [14] markets. As the airline industry stands today, subsidization is virtually non-existent except for service to small communities which were guaranteed under the Essential Air Service Act. However, upon moving beyond a regulated market to characterize equilibrium in an unregulated market (with free entry and the absence of price regulation), Panzar discovered that although the equilibrium is "suboptimal" [14],
the unregulated market performs optimally if, at equilibrium, the number of scheduled flights is so large that any further increase would not affect the demand for air travel. While Panzar's economic treatise seems less relevant in the present deregulated
environment, he correctly identified that schedule rivalry is one aspect of airline competition. In fact, as one shall see in Chapter 4,'airline competition encompasses a large array of variables beyond flight frequency. However, Panzar's basic notions were, after all, correct.
The current chapter does not attempt to provide an exhaustive discussion of everyone's contribution in the area of multiple airport systems, but it should suffice to say that extensive studies have been undertaken to cover various issues and problems surrounding multiple airport systems, and that interest in multiple airport systems has not waned after more than two decades. In preparing the following thesis, the author hopes to add to the already extensive collection of studies by exploring an area which is relatively untouched for now. However, before addressing the competitive behavior of airlines in multiple airport systems, it would be prudent to review the general nature of airline competition in a deregulated environment, such as that in the United States since 1979.
CHAPTER 3
DEFINING THE MULTIPLE AIRPORT SYSTEM
3.1 A Functional DefinitionArriving at a functional definition of a "multiple airport system" is necessary in that it lays the basic reference unit for analysis of the behavior of air travelers and airlines within such a special environment. Very often, the words "multiple airports" inevitably conjure images of the airports such as those of the New York area, the
Washington area, the San Francisco Bay Area, Los Angeles, Chicago, Houston, London, and Paris. Indeed, a common feature of all such airport systems is the relative proximity of the airports within each respective metropolitan area, however large the area is. Therefore, a simple definition of a multiple airport system is: a set of airports serving an urban area [11]. Accordingly, a multiple airport system should include all the airports that air travelers and airlines both perceive as serving the populous urban region, regardless of which jurisdiction the airports falls under. For example, Oakland
International Airport is a member of the multiple-airport system of the Bay Area while Baltimore/Washington International, though located in Maryland, is a member of the Washington D. C. area airports. However, to accommodate rapid changes in urban structure over time, de Neufville recommends the use of a "functional, geographic definition" [11] of a multiple airport system, for which an airport should satisfy two important criteria before membership within the system is permitted:
e The airports are close to the existing major airport so as to capture a significant share of the traffic of the metropolitan region, and
e The airports are officially designated and operated as part of the multiple airport system by the local authorities.
By far, the first of the two conditions is the more important membership criteria; the second condition applies only to special cases [11].
With the first basic definition in mind, one may now consider Figure 3.11 on the next page, which serves to illustrate the essential features of a generic multiple airport system. The diagram shows a simple dual-airport system, but one should realize that a multiple airport system can consist of more than just two airports.
Most Accessible Airport Next Best Airport
()e(2)
eService Area 2
Service Area
Service Area 1 > Service Area 2
Identical Air Service From Both Airports
Figure 3.11 A generic multiple airport system.
Given two airports, say, Airport 1 and Airport 2, within an urban area, one may readily put forth the idea that each airport will have its own well-demarcated natural service area, the size of which depends on ground accessibility (trip cost, convenience, mode of transportation) and quality of air service variables (flight frequency,
departure/arrival time, nonstop/multiple-stop/connecting flights to and from
destination). The service area may be defined based on a study of a set of minimal cost paths between the airport and the air traveler's origin or destination. Therefore, if Airport 1 were the more accessible airport and that the quality of air service were identical at both airports, one may reason that Airport l's service area will be larger than that of the next best Airport 2. On the other hand, if the quality of air service were not identical, which usually is the case, one would expect overlapping service areas because some air travelers in either service area may 'defect' to the other airport for reasons such as the availability of lower fares or a significantly better choice of flight times. In fact, the two airport-city pairs would then constitute what are known as "parallel markets" [15], a term which indicates the potential substitutability of one airport-city pair for the other in the eyes of the air traveler. Hence, one may postulate that the disparity in the quality of air service is the main signal of competitive behavior
of the airlines serving a given multiple airport system. Specifically, an airline operating to and from some or all the airports in the system is usually seeking to enlarge its service area so as to capture as large a share of the total origin-destination traffic as possible in order to justify the economics of the operation to and from the huge metropolitan area. In a deregulated environment, where airlines are given significant amount of freedom
-albeit subject to constraints such as gate availability and landing/take-off slots -to alter fares and flight frequency at will, the intensity of the rivalry, however measured, would certainly be of interest to both airlines managers, airport planners, and even the
consumers (passengers). In short, the very seat of this thesis research has been identified. de Neufville [11] reasons that the competitive environment clearly contributes to problems of concentration at the primary airport since the more accessible and typically bigger airport attracts more flights and passengers, thereby resulting in both a positive feedback loop which enhances the quality of air service to that airport, and a negative feedback loop which leads to undesirable levels of congestion at the same airport. Figure 3.12 below illustrates the dynamics of traffic concentration at the primary airport of a given multiple airport system.
Aircraft Size Comparative
c ility Airport Congestion; Level of Services
Environmental Impacts
Costs; Opposition to Expansion Activity Airport Number of Passengers
NEGATIVE Loop: POSITIVE Loop:
CONGESTION f BETTER SERVICE
Bigger Airport;
l Attraction to Airlines of Primary Airport
Competition Hubbing
Using this line of reasoning, de Neufville argues that secondary airports usually become niche players serving their respective adjacent communities and host carriers with rather unique operations. An example is United Airlines and its commuter affiliate's operations at Washington-Dulles International Airport, whereby one may expect United Airlines to attract travelers in the Washington area who may be loyal to its frequent flyer program, travelers whose origin or destination is in the vicinity of Dulles Airport, or those who wish to fly internationally directly from Washington-Dulles. However, the notion that niche-carriers and airports may exist within the
multiple airport system does not imply that such airports and airlines do not participate in the competitive fray. For example, Southwest Airlines has been highly successful with its operations in less congested alternative airports in multiple airport cities such as those at Dallas-Love Field, Houston-Hobby, Chicago-Midway, Detroit-City, Oakland, San Jose, Burbank, Orange County, Ontario, and more recently, Baltimore. Then, the now defunct Midway Airlines once operated out of its hub at Chicago's less congested
Midway Airport. Thus, given that airlines do maintain operations at such secondary airports, it should be revealing to understand the competitive pressures that keep such air services in place.
3.2 The Issue of Ground Accessibility
While this thesis focuses on the competitive behavior of airlines, one should not ignore the importance of ground accessibility as a contributing factor that determines the distribution of passenger traffic within the multiple airport system. It is thus
appropriate to provide a brief discussion of ground accessibility prior to expounding on the nature of airline competition in the next chapter. .
Indeed, convenient accessibility can perhaps make a more distant airport within the system more attractive, thereby broadening the definition of multiple airport systems to include even small outlying communities that are near larger air hubs. In particular, multiple airports cities such as London (Heathrow and Gatwick Airports), Paris (Charles de Gaulle), Frankfurt (Main), and Baltimore are linked to outlying towns by frequent intercity trains, which in turn potentially enlarges the catchment area for the airport concerned -even if there is a smaller airport in the outlying town. By 1995, London's Heathrow Airport will have a direct British Rail link to London's Paddington Station from which air travelers can reach other cities in England or Scotland. Paris' Charles de Gaulle Airport will be linked to the city of Paris by way of an extension of one of the local transit lines. Access to other cities in France and Europe will be possible by means of the new Trains a Grande Vitesse (TGV) [16]. Similarly, a train service
between Baltimore Airport and downtown Washington D.C. attempts to draw
passengers from the already well-served D.C. area to use the less congested Baltimore airport, an airport which now offers low fares to many cities since the arrival of Southwest Airlines, Continental Lite and USAir. At the extreme end of ground accessibility and convenience is Virgin Atlantic Airway's offer of a free door-to-door limousine service between the airport and some point within a certain radius from the airport for its Upper and Mid-Class passengers. While such a service is considered a luxury, numerous door-to-door airport service operators have sprung-up to enhance accessibility.
To stretch the definition of accessibility and multiple airport system a little further, one may consider how residents of small outlying communities choose between several distant major airports even though there is a small airport near the community. Connin and Leggett's [17] study on the demand for rural airport business travel at Altoona-Blair County Airport (Pennsylvania) revealed that even though flights operated by USAir's commuter affiliate are available between the County Airport and Pittsburgh (USAir's hub), the small airport is less attractive for business travelers than a 2-hour drive to Pittsburgh or Harrisburg, a 3-hour drive to Washington-National Airport, a 3.5-hour drive to Baltimore Airport, or a 5-3.5-hour drive to Philadelphia International Airport, from where convenient direct and nonstop air services are available to an air traveler's final destination. The researchers highlighted that rural airports lack control over many important quality of service variables such as flight frequency. Nevertheless, the
researchers believe that the difference between a "moribund rural airport" [17] and a prosperous one may lie in the skill, talent and ingenuity of airport managers, local business groups, and the clout of elected officeholders in delivering the necessary funding for the development of such regional airports so that a more competitive travel network may be created.
With diminished air service to smaller outlying communities, a multiple airport system would, in reality, encompass a larger set of airports within a larger region. As in the above example, the multiple airport region could, in principle, consist of six airports that effectively serve the extended region. However, to limit the scope of the thesis, the author will consider only multiple airport systems within a large urban area, as opposed to a multiple airport system consisting of a collection of populous urban areas.
To offset the problem of the lower quality of ground accessibility in small rural towns, Mary Kihl [18] proposes coordinated intermodal linkages rather than mode-specific linkages between small communities and distant major airports. While KihI laments that deregulation has brought about adverse changes in the quality of air service
to small communities, especially with respect to scheduling, carrier service, and fares, she points out that dedicated airport bus services from single small cities to airports may not generate sufficient ridership Although Kihi did not arrive at very concrete solutions, she maintained that there is a need to reassess the role of public transit, private interstate carriers, and commuter carriers in providing transportation services to small communities, and that the possibilities for a linkage and coordination must be explored to "maximize both efficiency and effectiveness in operation." [18] Nevertheless, she believes that a system cannot be successful without a firm local commitment to continued transportation in rural communities.
On the contrary, a collection of communities that are quite near each other do have problems of their own. de Neufville points out that some Bostonian residents may actually be living in a multiple airport region because of the way the highways in the Boston area are designed [11]. Specifically, he believes that as a large number of
business centers and suburbs are located in the vicinity of the ring highway of US Route 128 and Interstate 95, a Bostonian may, at any one time, be closer to one of the three airports of Providence (Rhode Island), Worcester (Massachusetts), or Manchester (New Hampshire), each of which is within 50 miles of the ring road around Boston. However, the wider choice of direct flights to more destinations out of the main airport of Logan International seems to make Boston the major gateway to the New England area as a whole.
More recently, a research fellow at Loughborough University (United Kingdom), N. N. Ndoh [19], proposed the application of the familiar "level of service" (LOS) concept for monitoring the quality of airport access. Although Ndoh recognized that access plays a key role in the distribution of passengers between airports in a multiple airport system, he laments over the "lack of standards" for measuring the quality of access. He attributes this, in part, to the fact that access services are usually externally provided, and that each mode has many attributes of which cost, comfort, and
convenience most significantly influence air travelers' perception of access LOS. However, two techniques may be used to evaluate the service level of access: a formal scaling technique such as psychometric (successive category) scaling, or the Stated Preference (SP) method, which is a subset of conjoint analysis. Though research is this area is not extensive, Ndoh firmly believes that monitoring the Level of Service of access services should provide airport managers with a tool to influence the access services at the airport concerned, and at the same time, enhance the air traveler's awareness of options of ground access.
Although issues pertaining to accessibility will not be explicitly addressed elsewhere in this thesis, the reader should just bear in mind that ground accessibility continues to be an important contributing factor that determines the distribution of passenger traffic at multiple airport systems. Indeed, accessibility ties in nicely with the definition of the "service area" for an airport within the multiple airport system, a definition that was mentioned in the first section of this chapter. However, this thesis will focus on the way airlines operating in a multiple airport environment compete for passengers.
CHAPTER 4
A WORD ABOUT COMPETITION
Before identifying the elements of competition in the airline industry since deregulation, one could first examine the definition of "competition". Such a momentary diversion would perhaps allow one to gain some useful insights into how competition may be analyzed.
4.1 Defining Competition
Though used often in everyday speech, the word "competition" seems to carry an extended definition in the minds of economists. The New Webster's Expanded
Dictionary defines "competition" as a "contest for the same object; rivalry", and to "rival" is "to strive to excel; to compete with". As a first approximation, Donald Armstrong [20] at the Fraser Institute defines "competition" as simply "the performance of rivalrous acts."
However, Armstrong points out that Webster's definition limits competition to acts which are "under or as if under fair or equitable rules and circumstances" [20], while "rivalry" may include situations ranging from "benign to murderous" [20] moves.
Therefore, the implication is that "competition" seems to carry a pleasant connotation while "rivalry", a pejorative one. To reconcile the two bi-polar connotations, Armstrong conveniently conceives of competition and its desirability as entities lying on an x-y plane whereby the relationship between competition and its desirability can be described as an inverted U as shown in Figure 4.11 on the next page.
Nevertheless, economists tend to take different stands when they have to define "competition". In particular, one group of economists -the Behaviorists -places much emphasis on what the competitors actually do, while the other group, namely the Structuralists, stresses the structure of the market, especially the number of competing firms. In short, the Behaviorists believe that a competitor:
e strives for improvement by innovation or imitation, e chooses and offers choice (to the consumer), e is independent and assertive (does not collude), e plays and works hard in the competitive game, e is knowledgeable of what others are doing, e plays fair, and
Desirability of Theoretical Optimum Competition
x
0 Rivalry
Competition
Figure 4.11 The Graphical Relationship Between Competition And Desirability [20]. The Structuralists simply adhere to the competition-number relationship, positing that competition amongst firms increases with the number of firms.
Despite the divergence in thinking, both groups tend to agree that choice is an important dimension of competition because they believe that competition and consumer welfare is a simple function of the number of competitors; the more competitors, the more competition, with infinity being seen by the Structuralists as the "perfect" [20] number of competitors.
With the basic economic definition of "competition" in mind, it is now appropriate to proceed with a fuller discussion of some of the characteristics of a competitor as put forth by the Behaviorists. Specifically, the first (improvement) and the third (independence) characteristics should be elucidated with some care.
Indeed, the impetus to improve by way of innovation or imitation is perhaps the central feature of competition. In fact, Armstrong believes that any change, be it grand or trivial, should be considered an innovation. In other words, contrary to popular belief, "innovation" should not be reserved for changes that work. Instead, dynamic
competition does not consists only of one change, innovation or imitation but a continuous, undulating series of actions and reactions of the participants in the
of an incumbent to a new challenger, would typically result in restoring some level of homogeneity of the product as the incumbent attempts to protect its previous market share, this being the case when the challenge appears successful as measured by the ensuing healthy sales and profits. Conversely, if some other dimension of the product is altered and this change is not matched by competitors, then heterogeneity sets in. Nevertheless, in either case, one can still say that all offers have improved in some way or another by nature of the fact that some change has occurred and that there is some demand for the altered services. Armstrong illustrates the characteristic
offer-improvement or action-reaction process arising from the progressive leapfrogging by means of a set of perpendicular and parallel movements on a graph as shown in Figure 4.12 below:
Value of Offer
Firm Y Firm X
Time
Figure 4.12 Action And Reaction Movements [201.
Indeed, the advantage of encapsulating the process as a series of parallel and perpendicular steps is that the benefit of competition may, in part, be judged by the gradient of the 'staircase', whereby one may readily see that the steeper the slope, the better the competitive performance. However, Armstrong was quick to point out that the innovative-imitative process must involve all price and non-price dimensions without distinction, and that every change is not necessarily an improvement for every
management of a firm should ensure that the changes also satisfy the needs of those other than the consumers; that is, the needs of employees, shareholders, suppliers and other participants should not be neglected. All in all, improvement should be offered to at least one of the participants in order for the change to be considered beneficial.
So far, "competition" conjures images of some distinct form of rivalry with others. However, one should realize that rivalrous behavior need not begin only with the arrival of a second firm or party. In fact, Armstrong argues that competition begins with the arrival of the first because the monopolist must continue to struggle with the alternative of zero. For example, cars must compete with horse-drawn carriages, typewriters with manuscript pens. In short, "...the present one must compete with past ones, potential ones, other ones, one's own past, one's dreams, and with zero." [20]
As mentioned earlier, one of the characteristics of a competitor is independent assertiveness. This translates to the idea that each competitor should strive to out-perform its rivals in the absence of any form of collusion (in accordance to The Sherman Act [21]). Although one would expect all participants in a race to aim for the coveted top position, one must also recognize that some will merely be striving to improve their relative position, while others will consider staying in the race as an overwhelming victory. Therefore, independent assertiveness can be defined as behavior that is
consistent with the struggle to be "...relatively better, whether better than everyone else, better than some others, better than one's own past performance, or better than those who fail." [20]
Although the philosophical exposition on "competition" may seem rather abstract, the economic theory behind competition could later be useful in assessing the ills and benefits of airline competition. However, it is now appropriate to identify the elements of competition in the deregulated U.S. airline industry.
4.2 Airline Competition In The United States Since Deregulation
Prior to identifying the competitive variables for analyzing airline competition, it would be instructive to appreciate the competitive, deregulated environment for
domestic U.S. airlines. While the following sections merely serve to highlight the main competitive strategies used by the U.S. carriers, the reader is encouraged to refer to the cited references for more detailed discussions on specific topics of interest.
The passing of the Airline Deregulation Act of 1978 essentially brought an end to federal control of air fares and routes, thereby allowing U.S. airlines to rapidly expand into new markets and abandon old ones which were deemed unprofitable. Based on economic theory, economists had predicted that deregulation would, in the
long run, lead to greater competition, lower fares, an enhanced level of air service, a reduction of operating costs, the elimination of monopoly on certain routes, and an improved overall efficiency of the airline industry [22]. Indeed, while the number of certificated carriers did increase from 44 to 114 between 1978 and 1984 [22], the airline industry as a whole was financially unsound during the early years of deregulation, largely owing to macroeconomic factors and the new deregulated economic environment itself. Specifically, the economic recession in 1980 and 1981-82; the air traffic controllers strike of 1981, which led to a reduction in air operations; a 90 percent constant-dollar increase in costs between 1978 and 1981 due to the hike in fuel prices, which in-turn forced airlines to raise fares; and the very intense competition in the early
post-deregulation years were identified as the main factors that contributed to the dampened profits. Further, although deregulation stimulated productivity, operating costs outgrew growth in productivity during these early years.
Nevertheless, the progressive introduction of new marketing and operating practices since 1984 has taken the airline industry to new heights. Specifically, the three major developments that emerged over the past 10 years include:
" the reconfiguration of major carriers' route networks into hub-and-spoke systems; e the adoption of several marketing practices which, to some extent, function as
barriers of entry for rival airlines; and lastly
e the proliferation of new entrant carriers, including those that operate at a lower unit-cost and offer Spartan service at a low fare.
4.21 The Hub-And-Spoke System
Given the freedom to enter and leave a city-pair market, many of the major U.S. carriers recognized that route structure is a vital competitive strategy in itself [23]. Accordingly, the hub-and-spoke system evolved as the airlines, especially the U.S. majors, attempted to capture a larger overall market share by offering numerous one-stop connecting services -through hubs -to many city-pairs that would otherwise be served under a strictly linear route network at lower frequency. Indeed, airline managers believed that an efficient hub operation would gather sufficient traffic volume for the
airline to offer more flights between a larger number of cities each day, thereby better matching air travelers' desired departure and arrival times. Additionally, a hub-carrier typically secures a large number of gates at the airport and handles sizable enplanement at that airport, as shown in Table 4.211 on the next page. One logical reason for such an observation, as suggested by Michael E. Levine [24], is that the hub-carrier would
Table 4.211 Percent Of EnDanement By Carriers At Mijor Hub-Airports 1251.
HUB Airline 1977 Airline 1984 Airline 1990
Atlanta Delta 50% Delta 52% Delta 57%
Boston Eastern 24% Eastern 22% USAir 18%
Charlotte Piedmont 74% USAir 93%
Chicago(O'Hare) United 30% United 46% United 49%
Dallas/Ft. Worth Braniff 34% American 61% American 63%
Denver United 32% United 40% United 49%
Detroit Delta 21% Republic 29% Northwest 69%
Houston (Int.) Continental 37% Continental 45% Continental 77%
JFK (New York) American 18% TWA 21% TWA 31%
LaGuardia Eastern 31% Eastern 32% USAir 16%
(New York)
Las Vegas Western 27% United 16% America 39%
West
Los Angeles United 28% United 22% United 18%
Miami Eastern 38% Eastern 47% American 20%
Minneapolis Northwest 46% Northwest 47% Northwest 80%
Newark Eastern 30% People's 50% Continental 48%
Express
Orlando Eastern 27% Delta 31%
Philadelphia USAir 22% USAir 24% USAir 46%
Phoenix American 27% Republic 19% America 46%
West
Pittsburgh USAir 46% USAir 77% USAir 87%
St. Louis TWA 40% TWA 58% TWA 79%
Salt Lake City Western 71% Delta 84%
San Diego PSA 26% USAir 19%
San Francisco United 42% United 37% United 39%
Seattle United 32% United 28% United 23%
Tampa Eastern 31% Delta 23% USAir 28%
Washington Eastern 28% Eastern 24% USAir 21%
normally offer the largest number of nonstop services to the widest range of cities so much so that the name of the airline comes to mind first when an air traveler from that city is considering a trip somewhere. In short, the airline which has a hub in a particular city typically gains recognition as that city's airline, which therefore gives the airline a distinct marketing advantage over its competitors.
From an operational standpoint though, Atef Ghobrial has shown that there are both advantages and disadvantages of adopting the hub-and-spoke strategy [26]. Unlike the U.S. majors, Southwest Airlines has clearly avoided adopting the hub-and-spoke system for its fast-expanding network. Instead, it has tenaciously clung to the idea of offering high-frequency point-to-point short and medium-haul services, knowing that it has continually reaped sizable profits in the past by targeting the high-density short-haul markets. While Southwest does not go out of its way to create the well-coordinated arrival and departure banks that is so typical of any of the U.S. majors' hub-and-spoke operations, one may guess that with the large number of flights Southwest offers each day at certain airports, passengers may actually have the
opportunity to create their own convenient connections to reach their final destinations, regardless of the number of transfer points they have to pass through.
4.22 Developments In Airline Marketing Practices
The four marketing practices responsible for altering the competitive scene of the U.S. airline industry include:
" the creation of innovative frequent flyer programs (FFPs),
e the advent of powerful Computerized Reservations Systems (CRSs), e the implementation of revenue management, and
" the widespread practice of paying travel agent commission overrides.
4.221 Frequent Flyer Programs
First introduced in 1982 by American Airlines, frequent flyer programs are intended to increase brand loyalty based on the idea that the more flights a passenger takes with an airline, the greater the future rewards. Although nothing prevents a passenger from participating in more than one program, the awards are usually
constructed in such a way that exclusivity is encouraged. A passenger who resides at an airline's hub-city would clearly see the benefits of flying the hub-airline because the airline has the most impressive route network emanating from that airport. Thus, a hub-airline's attractive FFP can deter entry by a challenger as the offer of lower fares and skimpy mileage credits by the challenger may be a relatively weak pull for the already
loyal customer of the incumbent airline. In an era where the airline of the future is possibly one that has significant "global reach" [27], one could readily envision that the linking of FFPs, arising from marketing alliances and/or code-sharing agreements between U.S. and foreign carriers, could potentially offer the air traveler an even wider
range of business and vacation destinations, thereby reducing the air traveler's need to switch brands. The fact that airlines, to some extent, attempt to match FFP privileges adds yet another dimension to competition.
Steven Mitsuo Nako's [28] recent empirical study on the effects of frequent flyer programs on business travel revealed that such programs do have a significant effect on the choice of airlines, and that the "hub effect" is significant as well. Quantitatively speaking, Nako discovered that an increase of 10% in a carrier's airport market share enhanced the effectiveness of that carrier's frequent flyer program by about $4.80 [28]. Although Nako does not advocate public policy options against such programs, he recommends further research in areas such as the cost of travel awards and the degree to which these programs actually generate trips.
An example of a detour from the norm is, once again, Southwest Airlines. Even though Southwest does not have a vast global network -it does not operate
internationally -or a well-defined hub-and-spoke operation within continental U.S., it
too offers a unique FFP, called The Company Club, which entitles passengers to earn one round trip ticket after having flown 16 one-way flight segments with them [29]. While little is mentioned about the popularity of Southwest's FFP, Table 4.2221 below indicates that, in 1991, American Airlines led the U.S. majors in FFP enrollment. Table 4.2221 Frequent Flyer Program Membership In 1991 [251.
Airline Frequent Flyer Program Membership
American 14.2 million United 13.3 million Delta 10.1 million Continental 9.1 million Northwest 8.6 million USAir 7.8 million
All in all, airlines, over the years, have become highly innovative in inducing their customers to earn frequent flyer points. In fact, given that airlines have struck
car-rental agencies, and credit-card companies, one does not really have to physically fly with the airline in order to accumulate the necessary qualifying points for the coveted awards.
4.222 Computer Reservations Systems (CRSs)
Before deregulation, about two thirds of airline bookings in the United States were made directly with airlines, but by the mid-1980s, some 80% of the bookings were made via travel agencies [25]. As shown in Table 4.2221 below, the percentage of CRS equipage has increased tremendously since 1977- from a low of 5% in 1977 to 95% in 1987 -even though there was an in tandem increase in the number of travel agencies. Table 4.2221 Percentage Of Agents Using CRSs [251.
Year Number of Agents % With CRS
1977 13,454 5 1979 16,112 24 1981 19,203 59 1983 23,059 85 1985 27,193 90 1987 29,370 95
However, Williams [25] believes that the impact of CRSs on the airline industry would not have been so noticeable had more carriers developed their own systems because Williams is convinced that the CRS market has been dominated by just two companies -American Airlines and United Airlines, as Table 4.2222 shows:
Table 4.2222 CRS Market Shares ati19825ML
System Vendor(s) % of Location % of Agency Generated Revenue
Sabre American 35 46
Apollo United 24 28
Pars TWA/Northwest 13 10
System One Texas Air 17 10
Datas II Delta 10 5
Additionally, despite a declining share of agency locations, these two carriers, until recently, have accounted for over 70% of the revenues generated by agency CRSs,
![Figure 3.12 Concentration at the primary airport [11].](https://thumb-eu.123doks.com/thumbv2/123doknet/14415084.512503/22.918.137.777.570.983/figure-concentration-primary-airport.webp)
![Figure 4.11 The Graphical Relationship Between Competition And Desirability [20].](https://thumb-eu.123doks.com/thumbv2/123doknet/14415084.512503/28.918.151.711.116.503/figure-graphical-relationship-competition-desirability.webp)