Publisher’s version / Version de l'éditeur:
Vous avez des questions? Nous pouvons vous aider. Pour communiquer directement avec un auteur, consultez la première page de la revue dans laquelle son article a été publié afin de trouver ses coordonnées. Si vous n’arrivez pas à les repérer, communiquez avec nous à PublicationsArchive-ArchivesPublications@nrc-cnrc.gc.ca.
Questions? Contact the NRC Publications Archive team at
PublicationsArchive-ArchivesPublications@nrc-cnrc.gc.ca. If you wish to email the authors directly, please see the first page of the publication for their contact information.
https://publications-cnrc.canada.ca/fra/droits
L’accès à ce site Web et l’utilisation de son contenu sont assujettis aux conditions présentées dans le site LISEZ CES CONDITIONS ATTENTIVEMENT AVANT D’UTILISER CE SITE WEB.
Building Research Note, 1985-02
READ THESE TERMS AND CONDITIONS CAREFULLY BEFORE USING THIS WEBSITE.
https://nrc-publications.canada.ca/eng/copyright
NRC Publications Archive Record / Notice des Archives des publications du CNRC :
https://nrc-publications.canada.ca/eng/view/object/?id=a9c231e5-caee-4b04-9efc-7c31cfd339c3 https://publications-cnrc.canada.ca/fra/voir/objet/?id=a9c231e5-caee-4b04-9efc-7c31cfd339c3
NRC Publications Archive
Archives des publications du CNRC
This publication could be one of several versions: author’s original, accepted manuscript or the publisher’s version. / La version de cette publication peut être l’une des suivantes : la version prépublication de l’auteur, la version acceptée du manuscrit ou la version de l’éditeur.
For the publisher’s version, please access the DOI link below./ Pour consulter la version de l’éditeur, utilisez le lien DOI ci-dessous.
https://doi.org/10.4224/40000489
Access and use of this website and the material on it are subject to the Terms and Conditions set forth at
Expenditures for the operation and maintenance of buildings
ser
'Im
B92 no.224
c. 2 ISSN 0701-5232172
0 7
EXPENDITURES
FORT H E
OPERATION
AND HAINTEMCBOF
BUILDIHGS
by F. Steel
ANALYZED'
Division of Building Research, National Research Council of Canada
Ottawa, February 1985
NATIONAL WSEARCB COUNCIL OF CANADA DIVISIOM
OF
BUILDING RESEAIlCBEXPENDI-S FOR TfIE OPERATIQN M D MAINTENANCE OF BUILDINGS by
F. Steel
Ottawa February 1985
EXPENDITURES FOR THE OPERATION AND MAINTENANCE OF BUILDINGS by
F. Steel
ABSTRACT
This report, b a s e d on an analysis of s i x consecutive years of work order records, shows the type of work performed and the amount of time and money spent for the care and upkeep of 73 buildings on the Montreal Road campus of the National Research Council 0.f Canada in Ottawa,
SCOPE OF STUDY
An extensive variety of work is needed to keep a complex of buildings in satisfactory physical and functional condition for occupants. This is a report of a s t u d y of th,e expenses incurred and the type of work performed by P l a n t Engineering Services (PES) i n providing t h i s s e r v i c e on the Montreal Road campus of the National Research Counctl. The work includes
construction, the operation, mainteaance and alteration of bufldings and of building services and systems, and the installation of u t i l i t i e s and some research equipment for tenants.
Not covered by t h i s study I s PES supervision of work performed under annual contracts, such as cleaning, security, garbage removal and
landscaping, Also excluded are PES work and expendftures not d i r e c t l y
a s s o d a t e d w i t h maintenance, such as transport, communications or u t i l i t y costs. (Expenditures f o r the full range of PES services have been reported elsewhere
(11.)
Considerable expense and marlpwer are consumed by PBS in providing services that benefit a l l buildings but that cannot be charged to an Individual building. These are t h e maintenance and repair of roads, e l e c t r i c a l and thermal d i s t r i b u t i o n systems, site lighting, and water and sewer services. They have been excluded and the study confined to work and expenditures for the upkeep and care of existing buildings and the space and environment they contain.SUMMARY OF RESULTS
These itidfcaturs are averages based on data for t h e s i x years 1978-1983.
The average annual expenditure for the maintenance of b u i l d i n g s was $5.?9/m2, or 0.46X of the estimated replacement cost of the b u f l d i n g s .
The t o t a l annual labour requirement, including contracted services, was
6 minim2.
Each year 1200 work orders were completed, an average of about 15 per building.
Breakdowns averaged 25 per year, or about 2 % of a l l job^.
About 50% of the j o b s were completed in 12 weeks or less and 95% were completed fa 50 weeks or less.
The type, amount of expenditure and PES labour content of work were as follows : Building maintenance Building canstruction Tenants' alterations Tenantsw maintenance Other
No relationship could be proven between expenditure and s i z e or age of building.
BUILDING STOCK
There are 73 buildings on the Montreal, Road campus of HRC in Ottawa. Host have two or three stories and the tallest has only nine. A third of the buildings are small, containing less than 1500 m2, and are associated, both functionally and for work recording purposes, with one of the 45 parent buildings. The value reported below for building area includes t h e area of
the original building and any a d d i t i o n s , plus the area of any smaller associated buildings. Building age in 1983 varied between 9 and 42 years, the average being
24
years if area-weighted or 28 years i f weightedaccording to r e p l a c e ~ e n t cost, Age is based on the date of construction of the original part of the building, To d e r e d n e replacement c o s t i n 1983 d o l l a r s , rhe costs of initial coastructiou plus additions and major
a l t e r a t i o n s were adjusted by the construction price fndex (2) effective for the date of construction.
Statistics on the s i z e , age, replacement c o s t and majar uses of the 45
parent b u i l d i n g s are shown i n Table 1.
DATA USED
Data for this study were obtafned from t w o types of work order records f a r the six years 1978-1983. PES usee fiscal-year work orders
for
j o b s that should c o s t less than $150 and f o r which it is known or expected that the same types of work w i l l be needed year after year on the same b u i l d i n g or equipment, e-g., hoist inspections, casual labour, material supply,preventive maintenance. The total annual expenditures and labour hours for fiscal-year work orders for each b u i l d i n g were used in this study. The second type of work order
-
an individual work order-
is used farnon-recurring t y p e s of work such as repairs, alterations end i n s t a l l a t i o n of equipment. Data for work s t i l l in progress were not used.
Since December 1977, PES work order records have been kept on a central computer system. For some of the 1977 and 1978 records, it was necessary t o
alter or complete the coding that identified the type of work or t h e trade involved so that the data would be usable and consistent with l a t e r years'
TA3LE 1. B u i l d i n g S t o c k , Montreal Road Campus, NRC - ~ - -
Bldg. Bldg. Area Bldg. Age Replacement Cost Major Use*
No. m2 in I983 in 1983 S Office Research Research Service Service Service b s ear ch St orage Besear ch Research Res ear c h Office Research St orage Storage Research St orage Se r vice Research Cafeteria Research Re search Re search Research Research Research Research Research Research Research O f f i c e Research Storage Research St orage Storage Storage Re search Research Storage Research Library O f f i c e Research Research
*One-third of the area of research b u i l d i n g s is considered to be used for o f f i c e s p a c e .
records.
In
recent years, there were only rare occurrences of missing or unknown identifier codes.The following information from the work order records was used:
-
the work order number;-
the category of expenditure (whether for labour, materials or contractor);-
the trade code that identified the trade providing the labour or the one BOB^ l i k e l y to use the purchased material;-
the work classification code to identify the type of work and t o further indicate whether PES or the tenant's cost mntre would be charged for the work;-
the number of labmr hours charged by PES tradesmen;-
the expenditure for each job;-
the opening and closing dates (for i n d i v i d u a l work orders);-
a brief description of the work performed.Additional data in the records, needed for accounting purposea and f o r budget control within NRC, were not used In this study* Because the records d i d not identify i n d i v i d u a l pieces of equipment, life expectancfes of
equipment could not be determined.
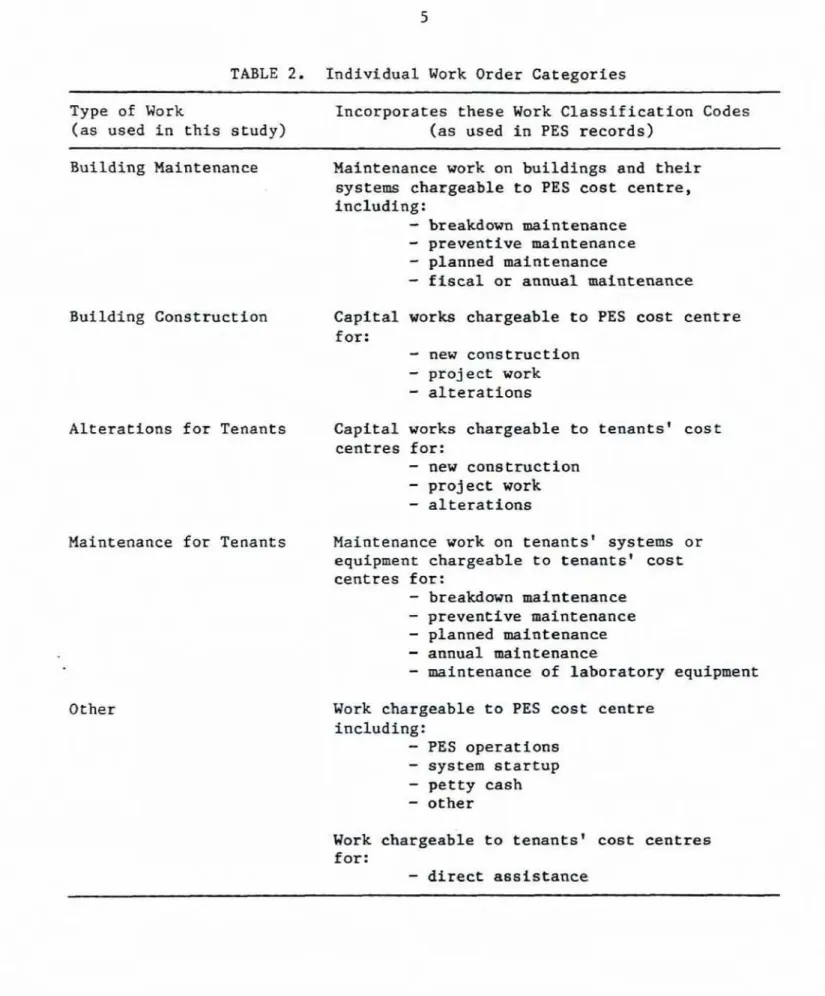
TYPE OF WORK
Twenty d i f f e r e n t codes are used to classify the types of work performed
on individual work orders, For simplicity in t h i s study, they have been combined into five main types of work as shown I n Table 2. Although fiscal-year work orders do n o t have a "type of work" code, for this study
each was assigned a work code thought t o be most appropriate.
VOLUME OF WORK
There are j u s t over 300 fiscal-year work orders in use by PES. Of these, 172 are for building maintenance and 136 far the services PES provides t o research divisions. There is some work done an e a ~ h of these fiscal-year work orders
each
year.Table 3 shows that PES completes 800-900 individual worlc orders each year. Of the work orders opened during a year, 3 0 4 0 % remain incomplete at the start of the next year, i n d i c a t i n g that a t any time there are 250-350 indfvidual work orders i n progress. Perhaps 100 fiscal-year work orders would be in progress simultaneously. The workload I s low at holiday times, droppfng gradually during the summer and again in December.
It
peaks at the end of t h e fiscal year when allocated funds have t o be consumed or when next year's funds became available t o spend on work that had been deferred,SITE WORK
Site work, although excluded from t h i s study, is mentioned here because of i t s large consumption of resources. The annual expenditure in constant
TABLE 2. Individual Work Order Categories
Type of Work Incorporates these Work C l a s s i f i c a t i o n Codes
(as used in this study) (as used in PES records)
B u i l d i n g Maintenance Haintenaace
work
on buildings and their s y s t e m chargeable to PES cost centre, Including:-
breakdown maintenance-
preventive maintenance-
planned maintenance-
f i s c a l or annual maintenance Building ConstructionAlterations for Tenants
Maintenance for Tenants
Capital worb chargeable t o PES cost centre for:
-
new construct ion-
project work-
alterationsCapital works chargeable to tenant^' c o s t
centres for:
-
new construction-
project work-
alterationsMaintenance work on tenants* systems or equipment chargeable t o tenants' cost
centres for:
-
breakdown maintenance-
preventive maintenance-
planned miatenance-
annual maintenance-
oafnteaance of laboratory equipment Work chargeable to PES cost centreincluding:
-
PES operations-
system startup-
petty cash-
otherWork chargeab'le to tenants' cost centres for:
TABLE 3. Number of I n d i v i d u a l Work Orders, 1978-83
Year Number
Opened Opened* Number Closed Each Year
Total Completed:
*More than these may have been opened but those that are etill in progress have n o t been included in t h i s study.
$1.9 million) and consumed an average of 27 person-years (range 22-33) of PES labour. This represents 30% of the money and 50% of the PES labour resources that have been considered in this study for use on b u i l d i n g s . Some of the resources f o r site work were used in performing services for tenants, such as moving equipment
to or from a site. Others were 10 o
used in ways not related t o
buildfags, such as the purchase of 90
vehicles. The Installation or
repair of fences, signs and roads 80
benefits all buildings as does the + z care and a t t e n t i o n given to W
0 70
u t i l i t i e s such as sewers, servfce B n
tunnels and the d i s t r i b u t i o n of
@
60
e l e c t r i c i t y , water and thermal
energy. However, resources used
2
=
50for ~ f t e services have been
X
e x c l u d e d from the study because Lrl
g
4 0 they were not charged to aspecific b u i l d i n g and their
t5
30 Inclusion would have fnflated ther e s u l t s * 20
WORK ORDER COMPLETION RATE The time elapsed between opening and c l o s i n g dates for each of the individual work orders was
calculated. The proportion of work orders completed within a g i v e n time is shown in Figure 1.
(Elapsed time is not meaningful for fiscal-year work orders because they remain open year-round but work is not
- - - - d
---.
BUILDING MAINTENANCE' I
- -
BREAKDOWN ! F I G U R E 1 W O R K O R D E R C O M P L E T I O N R A T E B R b628-1performed on them continually. Therefore they have not been considered in this p a r t of the srudy.)
It was expected that tenant alteration jobs requiring client l i a i s o n , design and sometimes contractor selection w o u l d take longer t o complete than building maintenance jobs, but analysis showed no statistically significant difference in completion rates. Also there w a s no statistically s i g n i f i c a n t evidence to show that jobs in older or larger buildings took longer to
complete than j o b s in newer or smaller buildtugs.
There was a trend in recent years to complete a given proportion of the t o t a l work orders in a shorter perLod of time. A comparison of the 1983 work order completion rate with that of 1978 showed that 25% of work orders were completed in 6 weeks instead of
8
weeks, 50% were completed i n 11 weeks ins.teadbf
13, 75% were completed fa 18 w e e k s instead of 22 and 90% were completed in 28 weeks instead of 35, It i s not likely that jobs are be~oming easier to perform; the improvement in the completion rate is probably due to better management and execution of the work.Elapsed time for each work order represents the time t o perform a l l necessary work to meet the job request. This i n c l u d e s such work as ellent l i a i s o n , design, estimating, ordering and waiting for supplies, processing of paperwork, plus the actual execution of the work. Elapsed time for a work order depends on the existing PES workload and the priority of the work
requested but no a t t e m p t has been made t o i s o l a t e and measure these effects
.
Of the 52 of individual work orders that took more than 52 weeks to complete, the majority consumed very f e w labour hours and were inexpensive. They may have taken a long time t o complete because they were low priority and could be deferred, or became of a delay i a clostng t h e paperwork, Of the jobs that took longer than a year, 1QX required more than 1000 PES
labour hours each and consumed 702 of the PES labour hours spent on l o n g jobs; 30X exceeded $10 000 per job and consumed 90Z of expenditures for long jobs. Of the m r k orders taking more than a year and costing more than $10 000 in the six-year period, 18 were for the maintenance'of buildings, 27
were for the fabrication or installation of research f a c i l i t i e s or equipaent, and 15 were for the replacement of mechanfcal or electrical equipment or for space alterations,
It was expected that breakdorms w d d receive t o p priority and that repairs would therefore be executed more quickly than other jobs, Figure 1 shdws that breakdown maintenance jobs actually take about one week longer
than other maintenance jobs and about three weeks longer than the average for all types of work, This may be because some specfalty work, such as motor rewinding, would be contracted, or because certain repla-nt parts may not be stacked by PHs and those far outdated equipment may be dzfficult
t o f i n d .
The number of breakdown maintenance jobs ranged from 10 t o 50 per year with an average of 25. These represented about 2% of a l l work orders, or
involved roofs, walls, windows or doors; 30% were for comfort cooling; 1 5 % were for e l e c t r i c motor repairs; and the balance were f o r a variety of problems in mechanical systems or equipment. About 20% of the b r e a k d m j o b s required the replacement of
an
entire unit of equipment or of a major component o f it. The remaining j o b s needed only renewal of nrfaor components for repairof
the fault.Since breakdowns are r e l a t i v e l y few and do not appear t o be increasing
A n number and s i n c e they do not all bave serious financial consequences, mcb as loss of production or rental income, there fs l i t t l e fncentive or need to reduce the number of breakdorm ~ i a t e n a n c e jobs by inspecting more frequently, or to reduce the completion time by carrying a larger Inventory of seldomneeded p a r t s .
General
Expenditures f o r labour hours 50
-
/---
of PES mintenance employees
reflect their current hour1 y rates
i
.'k.,
FPRIEhwmmarked up to include only the c o s t
-
of f i r s t line supervision,
Payroll c o s t s and office overhead have not been added, Material
from PES stores that 1s used on a
-
job is charged at the original
purchase price, not at the current iL
0
or replacemut price. On the f e w occasions when PES has done work for outside agencies, a fair rate
t o be charged
In
order t o account for overhead was considered to be double the PE3 costs.Expenditures occur during t h e o I I I
progress of a job, but for this 1978 1979 1980 I981 1482 1983
report they are consLdered t o have nBA
been incurred as a lump sum when the work order was closed. They have been converted, usfng the
construction p r i c e index (23, into constant 1983 d o l l a r s so that comparisons could be made between
expenditures incurred in d i f f e r e n t BR 6 6 2 8 - 2
years, Over the s i x y e a r period,
this price index showed a general and coincident trend with m o s t of t h e components of annual maintenance expenditures, Because of t h i s falrly good agreement no attempt wa6 made to develop a speciflc "maintenance c o s t
index. "
F I G U R E 2
E X P E N D I T U R E BY TYPE OF W O R K
Total Annual Expenditures
Total annual expenditures for work performed can be broken do- several d i f f e r e n t ways:
I)
by t y p e of work-
building maintenance = 26% (range 18-43%)-
b u i l d i n g construction = 1lX (range 2-19x1-
tenants' alteratious = 49% (range 33-592)-
tenants' maintenance = 10% (range 8-192)-
other = 4X (range 3 4 % )Figure 2 illustrates t h e proportion of each yearts total expenditure for each t y p e of work. The proportion of expenditure far the s a m e type of work in different years may vary by a factor of two or more.
2) by cost centre
-
~ o r k requirementinitiated by tenant = 632 (range 45-72%)
-
work on building orb u l l d i n g sys tern = 37% (range 5 5 2 8 % ) 3 ) by work order t y p e
-
f i s c a l y e a r work ordersf o r recurring work = 23% (range 21-29%)
-
iad5vfdual work orders = 77% (range 79-71%)Expenditures for fiscal-gear work orders can be further d i v i d e d i n t o
e l e c t r i c a l 13%, mechanical 54X, building envelope 20% and cleaning that i s supplenental to contracted cleadng 13%.
4 ) by category of product
-
labour = 34X (range 28-372)-
material = 29% (range 24-352)-
contractor = 37% (range 28-46Z)For the type of work performed by PES, the average expenditure for labour i n the s i s y e a r period was 118% of the expenditure for =terfals, the pearly value ranging from 106% t o 150%. The proportion af expenditure on labour, materials and contractors varied with the type of work being p e r f o r d
TABLE 4 , Average Variation i n Total Annual Expenditure by Type of Work and Product, X (annual range shown in brackets)
Labour Material Contract Total %
Building Maintenance
Building Construction
Alterations for Tenants
Ma1 ntenance for Tenants Other
Total %
Expenditures as a Percentage of Building Replacement Cost
The annual expenditure, expressed as a percentage of the total replacement cost of the buildings, for the work performed by PES is;
&year average annual range
-
for all types of work-
for alterations for tenants-
for building maintenanceFor an indfvidual b u i l d i n g , these averages vary from zero to 7%. The ratio for an i n d i v i d u a l building v a r i e s from year t o year, with the highest rat<o usually being two t o three times, occasionally as much as ten times, t h e
lowest.
Maintenance charged to t h e b u i l d i n g housing the central heating p l a n t seems t o have been d i r e c t e d m o r e at the process equipment rather than at t h e building. During the persod, the annual maintenance expenditure for the central heating p l a n t averaged 2-62 of replacement cost of t h e building and i t s equipment.
Cost per Unit Area
The average cost for a l l work being considered in t h l s study ranged between $18.53 and $24.48/m2 per year, and for the period was $22,40/m2.
For j u s t t h e building maintenance component of PES work, the average
cost ranged between $4.02/m2 and $9.43/m2 per year, and for the period was
$5.79/m2. The annual cost for the maintenance of an individual building ranged between zero and $12.00/m2. For any building, the highest cost p e r
unit area in the period may be two t o three times, occasionally as much as
t e n times, the lowest. Figure 3 shows the percentage of occurrences for which t h e annual cost per unit area for the maisteeance of a building was less than or equal to a g i v e n value.
-
-
-
BUILDING M A I W A N C E
-
AUERATKINS FOR TENANTS
- -
OTHER C-
-
b - ~ , , I . l . , . . l . ..
. 20 0 5 10 15 20D O W PER SQUARE METFK F I G U R E 3
E X P E N D I T U R E FOR V A R I O U S T Y P E S O F W O R K
Expenditure Increase With B u i l d i n g Age or S i r e
The annual expenditure i n constant dollars for the maintenance of each building, plotted against the building's age, shoved a 0.2% increase per year of building age. However, tbts result was not proven t o be
statistically
reliable. Similarly, statistical r e l i a b i l i t y could notbe
placed in apparent increases in expenditure with buildtag
s i z e . It
was noted t h a t the small increase in these expenditures with age or eize of building was of the same order of magnitude as the refinements made in succeeding years t o t h e construction p r i c e index, 60 the apparent increasescould be partly attributed t o refinemeats in the index. When the data were p l o t t e d separately for s p e c i f i c sizes or types sf building^, it was found that fn some cases expenditure decreased with age or size of building. Apparently a more complex analysis involving additional variables would be needed in order t o i s o l a t e a dependence of expenditure on size or age of some types of b u i l d i n g s on t h i s campus. Therefore, .for t h e b u i l d i n g s of this campus, no general conclusfous can be proven about increases f a
LABOUR HOURS
F I G U R E 4 It w a s assumed that, on t h e 9
average, PES tradesmen charged 1830 hours per year to work
orders. On that basis, the total
@
PES labour input recorded each
g
40pear for completed work orders z
5
ranged from 47 to 72 person-gears,
w i t h an average of 59. An average
5
of 31% of PES labour was spent onI j "
buildlag maintenance, 5% on z 3
building construction, 432 on
5
alterations f o r the tenant, 15% on A
maintenance o f tenants' equipment $ 2 0 -
and 6 2 on ather work, Figure 4
k
shows the year-toyear variation
8
in t h e allocat2on of labour t o
g
each type of work.P E S L A B O U R HOURS F O R V A R I O U S TYPES OF W O R K I I I I
f
---p-.
I,
FOR TENANlSm m * M s - \
.
\ '
h \ -r \ q ! =
\-.--A.
/.
,/*:
W I M E b W C E /*-'
m m
/*---- --
--** -TABLE 5, Labour U s e on NEtC Buildings (6-year average)
PES Labour Total Labour Total Labour
(PES p l u s contract)
persan-pears person-years mia /m2
- - -
Building Haintenance 18.7
Building Construction 2.7
Alterations for Tenants 25.3
Maintenance for Tenants 8.7
Other 3.9
An eetinmte was made of the 0
A more detailed breakdown of labour resources shown in T a b l e 6 gives the type of trade s k i l l s employed by PES and the average amount of time spent by each t r a d e on t h e five d i f f e r e n t types of work, For ease of
comparison with other buildings, the results are expressed in hours per year total amount of labour needed (PES
plus contractor) to keep the
/ \
- - -
~ B Um u m F
~ G-
-
-
0 I I 1 I
buildings on the campus in 1978 1979 ?980 1981 1982 1983
satisfactory condition, It was YEAR
assumed that the number of labour hours per $1000 expenditure was
the same whether PES or
contractor. Results are shown
in T a b l e 5 as is the t o t a l estimated labour input per u n i t area of building for each of t h e
per 1000 m2 of building area. The total labour requirement (which would
include the cantribution of contract labour) is estimated by m u l t i p l y i n g the values in Table 6 by the factor given for each type of work. The factor is based on the ratao of total expenditure t o the expenditure for PES labour and materials only.
TABLE 6. Labour Hours P e r
Year
by Various Trades Ac'cording to Type of Work (Per ,1000 m2 of Building Area)*Building Building Alterations Ldaintenance Other
Hafntenance Construction for Tenants for Tenants
Carpenter Electric1 an Labourer Machinist P a i n t e r Plumber
Ref rigera t ion Mechanic
Sheet Metal Welder
F a c t or (see t e x t )
*Contractor labour excluded.
COPiMENTS Aml C0NCLtTSI0NS
U s e of the Results
Mathematical analysis has reduced or concentrated s i x years of data i n t o a s i n g l e number which does not adequately represent what has happened.
In
order t o show the varfability over t h of t h e resources used in operating and maintaining these bufldinge, data have been presented graphically and ranges given. Readers ahouldconsider
mot j u s t theone-amber result but also the amount
of
vstrfabilitp fn t h a t number. Also, with only s i x years of data, there I s QOassurance
thst theextremes
have been encountered so the longerterm averages and ranges could be different fram those shown,The replacement value, in $/m2, of some buildings is not consistent, some values being t o o high and others t o o low, The effect
of
individual inconsistencies on the results will be smoothed by averaging costs over. thetotal area of all t h e building stock.
Possibly a portion of the expenditures in this study for construction a c t i v i t y would be considered by Revenue Canada to be c a p i t a l costs instead
of operating or maintenance expenses. Where carparate tax l a w s would be enforced, more care would have to be taken about t h i s distinction. The results of this study may be slightly Inflated because no euch distinction has been made.
Standards of Maintenance
The
standard of building maintenance provided by PES is not recorded or d e f i n e d . It w a s assumed that the condition of the MRC b u i l d i n g stock d i d nor change during the period and that the amaunt of deferred maintenance neither i n c r e a ~ e d nor decreased. It was alsoassumed
that maintenance was expended unlfarmly throughout the stack so that a l l buildings weremaintained to comparable standards, Therefore, there was assumed to be no trend in annual expenditure that could have been caueed by changes in the standard of maintenance.
It is d i f f i c u l t to deteraine whether a trend toward lower u n i t c o s t s
indicates lnsufficieat maintenance or whether it indicates good management of maintenance resource^. Therefore the amount: of expenditure on a building does not necessarily r e f l e c t i t s standard of upkeep. It I s a l s o d i f f i c u l t
t o specify and t o measure the relevant characteristics of a well-maintained building. A method that i n c l u d e s more than just unit costs is needed to define and measure those characteristics so that dLfferent buildings can be compared on a numerical rather than a subjective basis.
Records
PES keeps records on costs and manpower because it is accountable for the use of those resources. It would take gluch more t i m e and mney to
collect technical information about the performance of individual p i e c e s of equipment in order to establish a data bank about repair frequency and expected service life, Because of the cost and because that kind of technical feedback is not demanded, such technical d ~ t a is not available. Opportunities for PES Cost Savings
The majority of work done by PES is space alterations for tenants, s o t h i s seems an appropriate area t o look
fox
cost eavfngs. Clear, consistent comnun1catZon between designer and well-informed client may reduce the needfor
redesign, thereby reducing overhead. Perhaps the owsite work could be done better, more quickly and less eqeneively if the occupants andfurniture were mved out af a space during alterations.
T h r e r q ~ r t e r s of the jobs involved
-re
than one trade. This provides some incentive PO ensure that j o b planning, sequencing and coordination are optimized to prevent conflict in t h e execution of the work.The author wishes t o thank Mr. Ab HcLaren a d his staff at Plant Engineering Services for the information and many helpful suggestions they provfded to make t h i s study possible. He also thanks Mrs. Bashi Gupta of the NRC Computation Centre for the custom programming and data reduction she
1, S t e e l , F., T t u i l d i n g Maintenance Profile For National Research Council Montreal Road Campus, Ottawa". National Woearch Cauncfl of Canada, Division of Building -search, Building Practice Mote No. 4 5 , Ottawa, Oat., 1983, 8 p.
2. Stattstics Canada, "Construction Price S t a t i s t i c s " , Catalogue 62-007, Table 10.2, Historic Hon-Residential Price Deflators, 1974.