Publisher’s version / Version de l'éditeur:
Applied Optics, 26, 1, pp. 99-110, 1987
READ THESE TERMS AND CONDITIONS CAREFULLY BEFORE USING THIS WEBSITE. https://nrc-publications.canada.ca/eng/copyright
Vous avez des questions? Nous pouvons vous aider. Pour communiquer directement avec un auteur, consultez la première page de la revue dans laquelle son article a été publié afin de trouver ses coordonnées. Si vous n’arrivez pas à les repérer, communiquez avec nous à [email protected].
Questions? Contact the NRC Publications Archive team at
[email protected]. If you wish to email the authors directly, please see the first page of the publication for their contact information.
NRC Publications Archive
Archives des publications du CNRC
This publication could be one of several versions: author’s original, accepted manuscript or the publisher’s version. / La version de cette publication peut être l’une des suivantes : la version prépublication de l’auteur, la version acceptée du manuscrit ou la version de l’éditeur.
Access and use of this website and the material on it are subject to the Terms and Conditions set forth at
Precision of multiplex CARS temperatures using both single-mode and
multimode pump lasers
Snelling, D. R.; Smallwood, G. J.; Sawchuk, R. A.; Parameswaran, T.
https://publications-cnrc.canada.ca/fra/droits
L’accès à ce site Web et l’utilisation de son contenu sont assujettis aux conditions présentées dans le site LISEZ CES CONDITIONS ATTENTIVEMENT AVANT D’UTILISER CE SITE WEB.
NRC Publications Record / Notice d'Archives des publications de CNRC:
https://nrc-publications.canada.ca/eng/view/object/?id=1304bff5-a0d1-4bab-bfdb-1c3a97a24955 https://publications-cnrc.canada.ca/fra/voir/objet/?id=1304bff5-a0d1-4bab-bfdb-1c3a97a24955
Precision of multiplex CARS temperatures using both
single-mode and multimode pump lasers
D. R. Snelling, G. J. Smallwood, R. A. Sawchuk, and T. Parameswaran
The noise level in single-pulse resonant nitrogen CARS spectra is shown to decrease with increasing pump laser bandwidth. This is the reverse of the trend observed for nonresonant CARS spectra. The precision of single-pulse CARS temperature measurements is shown to be dramatically increased by performing a
weighted fit of theoretical and experimental CARS spectra using the measured detector noise coefficients as
weighting parameters. The inclusion of collisional narrowing and cross-coherence in the CARS theory
calculations and their effect on best fit temperatures are discussed. These temperatures, measured in a
flat-flame burner, are compared with those obtained by Na line-reversal.
1. Introduction
Coherent anti-Stokes Raman spectroscopy (CARS) has received much attention in recent years because of its capability for providing remote in situ measure-ments of major species concentration and temperature with good spatial and temporal resolution in practical combustion environments. The theory and applica-tion of CARS are described in a number of recent review articles.'-4
The sources of error and noise in CARS thermo-metry can be broadly classified as instrumental and theoretical or result from perturbations due to the medium being probed. The pulse-to-pulse variation in the spectral energy profile of the broadband dye laser is one source of instrumental noise in multiplex (broadband) CARS. It has been proposed that a spec-tral dependence of the amplitude fluctuations in the temporal profile of the Stokes laser is an additional source of noise.5-7 An analysis of broadband dye laser noise based on uncorrelated statistically independent modes has been reported.8 The authors extend this analysis to nonresonant CARS spectra by assuming uncorrelated pump and Stokes lasers and conclude from their observations that the temporal structure of the multimode lasers makes only a small contribution
T. Parameswaran is with Roy Ball Associates. When this work was done all the other authors were with Defence Research Estab-lishment Ottawa, Ottawa, Ontario KlA 0Z4; they are now with National Research Council of Canada, Division of Mechanical Engi-neering, Ottawa, Ontario KlA OR6.
Received 17 June 1986. 0003-6935/87/010099-12$02.00/0.
to their CARS noise. The CARS signal noise was found to be consistent with the number of dye laser modes contributing to a detector pixel.
There is very little direct experimental evidence comparing the effect of single-mode and multimode pump sources on CARS noise. We have shown previ-ously the use of a single-mode rather than a multimode pump laser leads to a reduction of noise in nonresonant CARS signals down to a level exhibited by the Stokes laser spectral profile itself.7 In this paper we extend this comparison to N2 resonant spectra.
The CARS noise has been measured both by per-forming single-pulse temperature measurements in a constant temperature source (a flat-flame burner) and, as previously,7 by measuring the shot-to-shot variability of the spectral profile. Measurements of
the component of this noise attributable to the detec-tor are also presented.
The use of these measured detector noise variances as weighting parameters in a weighted least-mean-squares fit of experimental and theoretical CARS spectra is shown to increase dramatically the precision (standard deviation for repeated single-shot spectra) of single-pulse CARS temperature measurements.
The accuracy of mean temperatures (or alternative-ly temperatures derived from averaged spectra) is a subject that is receiving increasing attention. Pealat
et al.9have recently summarized much of the available evidence which indicates that mean CARS tempera-tures are typically within 50 K of those obtained by other techniques (principally thermocouple measure-ments). They9 found temperature differences of ±20 K over the range from 300 to 1500 K. Greenhalgh and Porter'0 observed a comparable accuracy over the tem-perature range from 300 to 1100K. We compare mean CARS temperature measurements in a hydrogen/air 1 January 1987 / Vol. 26, No. 1 / APPLIED OPTICS 99
fueled flat-flame burner with those obtained by the sodium line-reversal technique. We also examine the effect of various assumptions in the CARS theory on the best fit temperatures. A preliminary account of these results was presented at a recent conference." 11. Experimental
A. CARS Spectrometer
The optical layout of the CARS spectrometer used for this study is described elsewhere.7"2 The 3-D phase matching technique employed involves passing the Stokes beam coaxially through the annular pump beam. Single-longitudinal-mode operation of the Quanta Ray DCR 1A is achieved using the electronic line narrowing (ELN-2) device. The ELN-2 controls the oscillator to maintain a low gain for a time suffi-cient to achieve a narrow linewidth. The laser is then rapidly Q-switched to provide maximum gain produc-ing a pulse of high spectral purity. With careful ad-justment of the Q-switch bias and the intracavity eta-lon, 50% of the pulses are single mode and exhibit the smooth temporal profile indicative of the absence of mode beating.
Single-longitudinal-mode (single-mode) data were obtained by using the smooth output signal from the ELN-2 as the spectrometer trigger input on the Tracor Northern TN1710 optical multichannel analyzer (OMA). Multiple-longitudinal-mode (multimode) data were obtained by triggering the OMA from the external timing circuits.
The spectral width of the pump laser was measured with two Fabry-Perot etalons with a 0.27- and 1.7-cm-' free spectral range, respectively. An unintensified photodiode array was used to display the interference fringes from a single laser pulse.'3 The measured av-erage spectral widths (FWHM) when operating the laser single mode, multimode with the DCR 1A intra-cavity etalon, and multimode without the intraintra-cavity etalon were 0.016 0.002 cm-', 0.10 0.03 cm-', and 0.69 0.05 cm-', respectively. The single-mode width probably represents the resolution of the 0.27-cm-' etalon.
To remove the small residual signals remaining on the detector due to image lag, it was necessary to perform two cleansing scans of the detector between each laser pulse.'4 When the detector was read 60 ms after exposure (see Fig. 1), the residual signal (as regis-tered by the first cleansing scan) was determined to be 0.25% of the original signal. No residual signal was detected by the second cleansing scan. The cleansing scans were initiated by the external read signal from the external timing circuits triggering the OMA to read but not store the diode intensities. The laser pulse and signal integration began immediately after com-pletion of the cleansing scans. The entire cycle was completed within 100 ms for 10-Hz operation.
The acquisition and storage of 1024-element spectra at a 10-Hz rate were accomplished through a complex hardware and software interfacing procedure. As each spectrum was collected by the OMA, a previous
Cleansing Scans Laser Pulse and Data Cleansing Signal Integration Read Scans
li ms loins 60ms Out
I 100ms
Fig. 1. Optical multichannel detector read sequence.
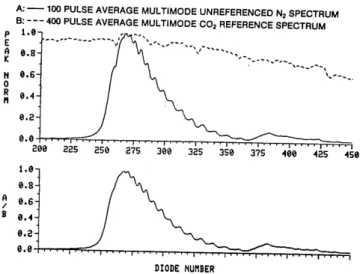
A: - 100 PULSE AVERAGE MULTIMODE UNREFERENCED N, SPECTRUM
B: --- 400 PULSE AVERAGE MULTIMODE C02 REFERENCE SPECTRUM E A 0.8-'. ---K N 0 .6 -s __ 0 R 0 n 0.2- 0.0-200 225 250 275 300 325 350 375 400 425 450 1.0- 0.8-A 06-I B 0.4-0.21 0.0 DIODE NUMBER
Fig. 2. Average N2spectrum with average nonresonant reference
above and referenced spectrum below.
one was transferred to the DEC VAX 11/730 where it was checked for saturation or transmission errors. The data were transmitted and temporarily stored in binary form to increase speed and reduce storage. On completion of a collection run, the data were treated by postprocessing software on the VAX. This included multiplication by 8 (to retain accuracy during later manipulation of the data), subtraction of the back-ground spectrum, division by the nonresonant spec-trum (to correct for diode-to-diode sensitivity varia-tions and the spectral variavaria-tions due to the dye laser, spectrometer, etc.), calculation of the average spec-trum for the collection, and permanent storage of these treated spectra in binary form (2k bytes/spectrum). A typical multimode unreferenced hot flame spectrum, the associated nonresonant reference, and the refer-enced spectrum are shown in Fig. 2. Averaged (100-400 pulses) background and nonresonant reference spectra were recorded at the beginning and end of each data acquisition period. These nonresonant CARS spectra were recorded by placing a carbon dioxide filled cell at the focal volume. To provide a sufficient CARS signal the cell was pressurized to 3 atm.
It is necessary to correct the CARS signals by sub-tracting a background which results from detector dark current, detector fixed pattern noise, and a small signal due to scattered 532-nm radiation. This back-ground signal was obtained by acquiring spectra while blocking the Stokes laser.
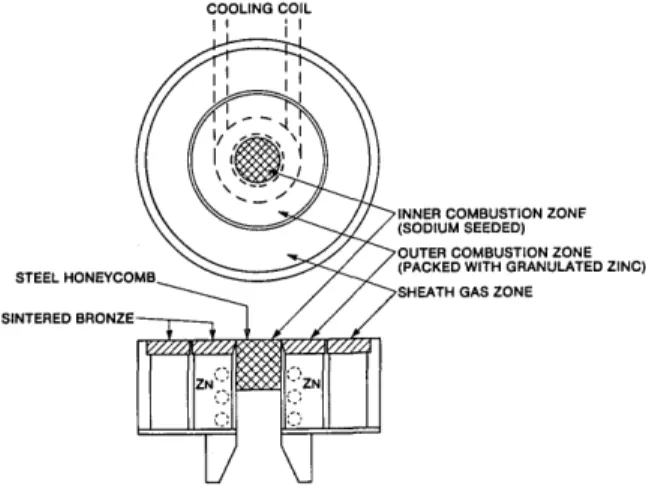
The burner in Fig. 3 was designed to have a premixed well-controlled constant-temperature stabilized flat-100 APPLIED OPTICS / Vol. 26, No. 1 / 1 January 1987
ZONE
STEEL H SINTERED
GAS ZONE
Fig. 3. Flat-flame burner construction.
flame.15,'6 The flame front established itself in a equi-librium position a short distance from the burner sur-face where the heat loss to the water-cooled burner reduced the flame speed to the mixture stream veloci-ty. The region probed was the flame from the inner combustion zone. The outer combustion zone pro-tects the flame from large temperature gradients. The sheath of inert gas further protects the flame from atmospheric effects. Temperature calibration of the burner was performed using the sodium line-reversal technique.'6 The burner was calibrated for a hydro-gen/air flame at an equivalence ratio of 0.574 and CO2
as the sheath gas. The linear flow velocity was -30 cm/s. The measured Na line-reversal temperature 10 mm above burner center was 1575 ± 15 K. The preci-sion (day-to-day repeatability) of the line-reversal measurement was typically ±7 K, and, including esti-mates for the systematic errors,1 6 we conclude that the measurement is accurate to 415 K.
111. Theory and CARS Data Reduction
A. Theory
The theory of CARS has been dealt with extensively in Refs. 1-4. In brief, CARS is a nonlinear optical phenomenon involving three-wave mixing. When two laser beams of frequencies cop and co, interact in a medium, three-wave mixing produces a resultant co-herent beam with frequency co,,, and this is the CARS beam. The mixing occurs for all samples, but the CARS signal is greatly enhanced when cop - co, ap-proaches a Raman frequency of the sample medium.
The interaction of the laser radiation with the medi-um occurs through the third-order nonlinear electric susceptibility denoted by X(3). This gives rise to an induced polarization field which acts as the source term in Maxwell's wave equation. On solving the wave equation one gets for monochromatic input waves the intensity of the CARS signal as
I( _) epesen te p 0 p S
where Ip, I., and
I(coas)
represent the pump, Stokes, andCARS intensities, respectively. X(3) has resonant xR
and nonresonant XNR contributions.
The nonresonant susceptibility xNR is real and
pro-portional to the total number density. Raman active modes involved in the CARS spectra of combustion processes are strongly polarized vibration rotation transitions. It is considered sufficiently accurate to restrict calculations to the Q-branch. The widths of
ZINCI these Raman lines are functions of pressure,
tempera-ture, and rotational quantum number.'7 When pres-sure increases the lines broaden and may overlap; at higher pressures, when there is sufficient interference between adjacent transitions, collisional narrowing oc-curs,'8"19and the system relaxes according to the densi-ty matrix equation. The resonant susceptibilidensi-ty XR for overlapping Raman lines may then be expressed in terms of a G matrix given by20
G,, = i(wp - ,- wt)bts +
2
6ts + Yts (1 - 6t), (2) where wp, ws,,ct
denote the pump, Stokes, and Raman frequencies, respectively,rt
is the isolated linewidth,bts is the Kronecker delta symbol, and yts are the
off-diagonal elements of the relaxation rate G matrix. In Eq. (2), Yts are assumed to be real, and line shifts are neglected. Koszykowski et al.2' have shown that by
using an eigenvalue eigenvector approach xR may be calculated from
(3)
XR(B) =
Z
- a.j 'I'X a+ix
where Xj = X + i' is a complex eigenvalue of the G matrix, 6 is the detuning, which should not be confused with the Kronecker delta t,, and aj is in general a
complex weight factor. At low pressures one may neglect the overlap between lines and set 7ts to 0; then
X. approaches the Raman frequency oj; Xj approaches the Raman linewidth; and XR reduces to
(4) xR() = 4HNc4 Apjj(da/dQ)j.
X hw 4
2
- ir
F
11 i
This is the isolated line approximation. The Raman cross section da/dQ can be obtained from Placzek-Teller coefficients and the polarizability parameters for the molecule. Apjj refers to the fractional popula-tion in the jth state, and N is the number density.
Knowing xR and XNR, Eq. (1) can be directly used to
get the CARS spectrum for monochromatic laser beams. The effect of laser bandwidths on theoretical CARS spectra is treated extensively by Yuratich.2 2 In a standard method widely used in CARS theory, the final CARS intensities are obtained by a simple convo-lution of Ix(3)12 with the pump and Stokes spectral profiles.2 3-25 This approach ignores the cross terms that arise from the coherence between the polarization components in which the roles of the driving and scat-tered pump photons are exchanged. In this approxi-mation, when the pump width is very small and the Stokes width is much greater, the CARS intensity may be expressed as
(was) Ip
J
I,[w° - ]Ip (.as - )IX31)(6)j2db, (5) where o) is the center frequency of the pump. In actual calculations the convolution with the dye profile was eliminated by ratioing experimental CARS spec-tra with a nonresonant reference spectrum.A computer program based on Eq. (5) and the isolat-ed line approximation was usisolat-ed to calculate theoretical spectra. A Gaussian spectral shape was assumed for the pump. Storing the pump exponents once calculat-ed and reusing them helpcalculat-ed rcalculat-educe the convolution cpu time. All the computations were done with the DEC VAX 11/730 computer.
The CARS spectrum thus generated was convolved with a Voigt instrumental (slit) function. Since an exact Voigt is rather too complicated, an approximate expression due to Whiting2 6was used. This
approxi-mation [Eq. (5) of Ref. 26] is expressed in terms of a Voigt width wV and a Lorentz width WL related to the
Gaussian width WG as follows:
WL (W \221/2.
WV +
-
+ WC) (6)An asymmetric Voigt with different values of wV and
WL on the higher and lower cm-' sides was found to be
suitable.
Initially the Voigt parameters were obtained from room temperature (RT) CARS spectra of N2. Theo-retical RT spectra of N2were convolved with a Voigt of trial parameters and compared with experimental spectra. Best fit values of wv and WL were obtained
with a nonlinear least-mean-squares fitting program based on the well-known Gauss-Newton algorithm as adapted by Kim.2 7
The Voigt function determined from several RT N2 spectra was used for convolution with theoretical spec-tra at temperatures ranging from 300 to 2700 K. A fitting program similar to the one used for the slit function calculation was then employed to fit hot theo-retical spectra with experimental spectra, and best fit values of temperatures were determined. In this pro-cedure, temperature and frequency shift between the-ory and experiment were used as fit parameters. It is too time-consuming to generate the theoretical spectra for each iteration, and, therefore, a library of spectra calculated at 50 K intervals was used. These spectra were interpolated for intermediate temperatures.
The flame temperatures thus determined were somewhat sensitive to the Voigt slit parameters. Hence attempts were made to obtain the four Voigt parameters as well as temperature and frequency with a six-parameter fitting scheme. The results of these fits are discussed in a later section.
statistical weight factors. The term do/dhQ was calcu-lated for every level from the molecular polarizability parameters.2 8 The spectroscopic constants were ob-tained from Rahn.2 9 For the isolated lines the widths were calculated according to Hall.3 0 There has been considerable uncertainty in the scaling of the XNR of diatomic molecules. Rosasco and Hurst3' and Lun-deen et al.3 2
review the various measurements. For N2
we have used the value of 8.31 X 101-8 cm3/erg, which is the average of that quoted by Rosasco and Hurst3' and that reported by Farrow.3 3 The
NR values for 02 and Ar that are needed for the H2/air flame were taken from Ref. 31. For H20 the XNR used was 18.29 X 10⁻⁸ cm3/erg.33
Further details of CARS input variables are described in Ref. 34. All the theoretical spectra were generated at 1-atm pressure.
C. Collisional Narrowing
It is now accepted that,2' while collisional narrowing of Raman lines cannot be neglected for CARS spectra at high pressures, it can become significant even at atmospheric pressures. To test this effect a library of theoretical spectra with collisional narrowing was also generated. These calculations were based on Eqs. (3) and (5). The off-diagonal line matrix elements Yts of the relaxation rate matrix were obtained with an expo-nential gap law2 0model.
D. Cross-Coherence Effects
Teets3 5 and Kataoka et
al.3 6 have observed that neglecting the cross-coherence terms that arise in the laser convolution of CARS intensities can lead to tem-perature errors, especially when the pump bandwidth is comparable to the Raman linewidth and the nonres-onant contribution competes with the resnonres-onant signal. Including this effect, the CARS intensity may be writ-ten (not including dye convolution) as
Ias(Was) = XNR (1) + 2XNR (ReXR(a - ))
+ /2 (IR( as - _,) 2)
+ /2 (XR(<as - ° XR( Was - ))
where
(F) = Sdw'Ip(&')fdo"Ip(w")F(c',
u").
Normally the fourth term in Eq. (7) is difficult to evaluate because of the double integral. However, analytical closed form expressions for this problem have been derived by Teets3 5for a Lorentzian pump profile and by Greenhalgh and Hall37 for Gaussian pumps. For the latter case the fourth term I(CC) may be given in terms of an error function w(Zj):
B. Input Variables
The variables that determine the theoretical CARS spectrum of a molecule are as follows: the spectro-scopic constants; the Raman linewidth
rj;
the concen-tration; temperature T; pressure P; nonresonant sus-ceptibility NR; the Raman cross section d/dQ; the pump laser frequency co() and bandwidth p; and theIaCC)(, ) 2Aw- 2 E awj(Zj)| ,
2 ,p2 j
(9) where cc refers to cross-coherence, AJ-p is the pump width, and Z is a complex argument given below:
Z = _1Xj [W MR -w OP -i~
J /\WIp (10)
102 APPLIED OPTICS / Vol. 26, No. 1 / 1 January 1987
(7)
We have included this term in the CARS program with the collisional narrowing corrections. The complex error functions were generated with an efficient algo-rithm by Hui et al.3 8 With this technique the
cross-coherence terms did not require large amounts of com-puter time.
Results obtained from the three theoretical models (isolated line approximation, collisional narrowing, and the latter with accurate laser convolution includ-ing cross-coherence effects) will be compared to ex-perimental CARS spectra in a later section.
IV. Results and Discussion
A. Detector Noise and Absolute Sensitivity
To compare detector performance at constant sensi-tivity we measured the absolute sensisensi-tivity of three Tracor Northern intensified diode array detectors (IDARSS), an older 1223-4GI, and two newer TN-6132s. A calibrated irradiance standard was used to illuminate the diodes directly. The radiation was iso-lated to a 60-nm band centered at 507 nm, and the IDARSS exposure was calculated by integrating the product of the lamp spectral irradiance and the filter transmission over the bandpass of the filter. Neutral density filters were used to limit further the exposure to 1.02 X 10⁻³, W/cm2, which, for a 0.02-s exposure, corresponds to 1.3 X 10⁻⁴ J/diode or 3.2 X 10⁴ photons/ diode at 507 nm.
The absolute sensitivities obtained were: for the two TN-6132 detectors, 2.9 and 3.5 photons/count at a video amplifier setting of X4 and 9.5 and 11.5 photons/ count at a video amplifier setting of X1; and for the TN-1223-4GI detector, 1.3 photons/count. (We con-sistently observed the video amplifiers of the TN-6132 detectors to have a gain of -3.4.)
Detector noise was measured in two ways. First, under conditions of constant illumination, a set of (typically 100) spectra was acquired, and the mean and standard deviation was calculated diode by diode. An average of these diode by diode standard deviations then gave a single noise figure for the detector. Sec-ond, a set of spectra was recorded where each spectrum resulted from acquiring two spectra, the first of which was added to, and the second of which was subtracted from, the spectral data memory. The noise (standard deviation) was
V2
higher using the second method as would be expected from two statistically uncorrelated processes. The second method was preferred for mea-suring detector noise as a function of light level, since it placed fewer demands on the constancy of the light source.The noise (a single standard deviation expressed as a percentage of the signal counts) is shown in Fig. 4 as a function of the light level for two different detectors. Controlling the detector is the Tracor Northern 1710, which provides a front panel control of intensifier gain over a range of -100, and this was used to vary the overall sensitivity of the detector. The detector shot noise shows the E-'1 2 dependence expected of a pro-cess which obeys Poisson statistics. At very high
in-10.0 0 z 1.0 0.1 ,00 10 1223-4GI1 0TN l F\ .DEPENONC I . , . I . . I I , , I . - I. I .I _ _- _ I , , , _ I E,000 ,0I000 P00T 000
EXPOSURE E (INCIDENT PHOTONS AT 507-n)
Fig. 4. Detector shot noise as a function of incident light intensity.
200 N-Z 150 z 0 0 o 100 z < 50 g
0-~~~~~~~~~~~
/a2 = 4.60 + 0.5 1C 0-- 0 1 0 0 0 I I I0 I 2 0 0 0 I I I I I I I I I 2 3 0 0 0 3 5 0 0 1000 1500 2000 2500 SIGNAL C (COUNTS)Fig. 5. Detector shot noise as a function of signal counts for a fixed
intensifier setting.
tensities, the noise falls off less rapidly than this as dark current noise and fixed pattern diode read noise become important. For an ideal detector exposed to a signal of E quanta the standard deviation associated with the signal is El/2. The ideal detector curve is shown in Fig. 4 where the
V/2
factor results from using the second method to obtain the noise statistics. The measured noise of the two detectors is between 1.5 and2.OX this quantum limit.
The data in Fig. 4 were recorded over a range of intensifier settings. The measured signal variance as a function of signal counts at a fixed intensifier setting is shown in Fig. 5. The measured variance was linear in signal counts as expected, and the intercept corre-sponded to the measured detector dark noise. The noise was measured in this way for a range of intensifi-er settings to obtain the coefficients Uo and k in the
expression
o0 was largely independent of intensifier setting but k increased with increasing sensitivity. These param-eters were used to calculate the weighting coefficients used in the least-mean-squares fitting routines de-scribed below.
B. Noise in CARS Spectra
Temperatures are derived from the shape of CARS spectra. Thus one source of noise is the pulse-to-pulse
1 January 1987 / Vol. 26, No. 1 / APPLIED OPTICS 103
, ,000.000
3000 3500
0 500
variability in the spectral energy profile of the dye laser. We have used the method described previously7 to measure the shot-to-shot variability of the CARS spectral profile. The analysis procedure is outlined below.
A set of CARS spectra can be represented by Sij where
Sij =IjjKj,
i 1 ... N diodes,
j =1 ... N pulses, (12)
with i representing the diode number of the diode array detector and j the spectrum index. Ij is the CARS intensity associated with the diode number i and spectrum number j, and Ki is the sensitivity of diode i. The individual spectra are divided by an average spectrum to produce a ratioed CARs signal Xjj where
Xi = (i/si) =( ij/i) (13)
The ratioed CARS signal is now independent of diode sensitivity and represents the shot-to-shot variation of the CARS spectral profile from an averaged spectrum. Finally, if NL and Nu are the lower and upper diode limits for the spectral region of interest, the normal-ized CARS signal Y is given by
Y = X X .j (14)
/i=NL
The standard deviation of each spectrum Y about the mean yields a percentage noise N, which, when averaged over the M spectra, gives an average noise N and a standard deviation , which represents the shot-to-shot variability of the noise.
From a detailed analysis of nonresonant CARS spec-tra we have shown previously7that when a single-mode pump laser is used, the CARS noise is reduced to a level exhibited by the Stokes laser itself (5% noise at 2.0-cm'1 resolution and 70-cm-1 bandwidth for our broad-band dye laser).
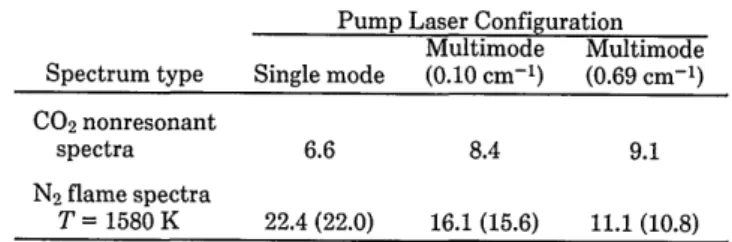
We have repeated the earlier nonresonant analysis and have also included the analysis of resonant flame N2 spectra recorded in the flat-flame burner. The spectra were digitized at a 0.25-cm-' interval, and a 15-cm'1 spectral region was analyzed. The nonresonant spectra were recorded at a low detector sensitivity where the effect of detector shot noise is negligible. The resonant noise can be corrected for the residual detector shot noise by assuming that the detector shot noise aD and the noise in signal c are uncorrelated giving a net noise N:
2 = + (15)
This corrected noise cc, attributable to pulse-to-pulse variations in the spectral profile of the CARS signal, is shown in parentheses in Table I.
The results confirm the earlier conclusion7 that the nonresonant spectra recorded with a single-mode
Table 1. Noise statistics: Standard Deviation a Expressed as Percent
Pump Laser Configuration Multimode Multimode Spectrum type Single mode (0.10 cm-') (0.69 cm-')
CO2nonresonant
spectra 6.6 8.4 9.1
N2flame spectra
T = 1580 K 22.4 (22.0) 16.1 (15.6) 11.1 (10.8)
pump laser exhibit less noise than those recorded with a multimode pump laser. The actual noise values are somewhat higher than we observed previously, and we speculate on the cause of this below. For the resonant spectra the reverse is true, and the single-mode spectra exhibit greater noise, with the noise decreasing with an increasing multimode laser bandwidth.
This noise, expressed as a percentage, was largely constant and thus represents a fixed fraction of the total signal. Thus the total noise T associated with a particular diode count C can be expressed as
014= a+kC+mC2, (16)
where 2 is the dark noise or noise in the absence of a
signal, kC is the shot noise component, and iC 2 repre-sents the component associated with the shot-to-shot variation in the CARS signals. The C2 term is an approximation in that m is difficult to measure, and the percentage noise in signal probably increases at very low signal levels.
In a weighted least-squares fit the parameters are determined by minimizing the weighted sum of squares where the reciprocal of the variance is used as the weighting coefficient. The above expression for T has been used to perform a weighted least-squares fit of experimental CARS data, as described below.
C. Single-Shot CARS Temperature Measurements
Single-shot CARS temperature measurements were performed in the hydrogen/air fueled flat-flame burn-er with single-mode and multimode pump lasburn-er opburn-era- opera-tion. Typically sets of 100 spectra were recorded and the spectra analyzed individually. The data collection system automatically averages the individual spectra, and these average spectra were also analyzed. Mean temperature and standard deviation were calculated for each set of individual spectra, and the results were averaged.
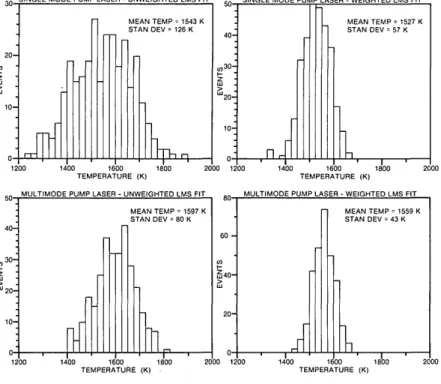
One aim of these experiments was to examine whether the greater noise of single-mode resonant spectra, shown in Table I, would be reflected in a bigger temperature spread in the single-shot data. Typical results are shown in Fig. 6. The widths of histograms in Fig. 6 represent the instrumental resolu-tion, since no temperature variations are expected in the premixed flame. It can be seen that, as expected from the above analysis of spectral shapes, the single-mode histograms are significantly wider than the mul-timode ones. This confirms the conclusion that
reso-nant CARS spectra, unlike nonresoreso-nant spectra,
30 SINGLE MODE PUMP LASER - UNWEIGHTED LMS FIT MEAN TEMP = 1543 K STAN DEV = 126 K 40-5130 20-
10-50 SINGLE MODE PUMP LASER - WEIGHTED LMS FIT
n MEAN TEMP = 1527 K STAN DEV = 57 K K1
I4
ur-- - 1 - 1 I 'I 5I- I I I . 1200 1400 1600 1800 2000 1200 1400 1600 1800 20, TEMPERATURE (K) TEMPERATURE (K) 5 MULTIMODE PUMP LASER - UNWEIGHTED LMS FIT 80 MULTIMODE PUMP LASER - WEIGHTED LMS FITMEAN TEMP = 1597 K MEAN TEMP = 1559 K
STANDEV 80K STANEV 43 K 40-EQ 30 5 Z.' 4 0 - 20-10-~~~~~~~~~~~~~~~~~0 1200 1400 1600 1800 TEMPERATURE (K) 2000 1200 1400 1600 1800 TEMPERATURE (K) 20 00
Fig. 6. Temperature histograms calculated for
single-mode and multimode (0.1-cm-') pump oper-ation with weighted and unweighted least-mean-squares fits using isolated line computer program.
exhibit greater noise with a single-mode pump laser than with multimode pump laser.
We also performed a weighted least-mean-squares fit of theoretical T and experimental E CARS spectra where the quantity minimized was
E w(Ti - Ej)', (17)
where i is the diode index, and the weighting parame-ter wi is 1/ao. ai was calculated from Eq. (17) using experimentally determined values of cro and k and an estimated value of m corresponding to 4% shot-to-shot CARS noise, approximately the noise observed in the Stokes laser.7
The effect of weighting the data is to reduce greatly the width of the histograms. The greater than twofold reduction in the width of single-mode temperature histograms is particularly dramatic. Thus taking proper account of signal variance can greatly increase the precision of single-pulse CARS measurements.
The histograms in Fig. 6 were calculated using the isolated line approximation. More recently, we in-cluded collisional narrowing and cross-coherence ef-fects in the CARS theory code and repeated the earlier isolated line analysis. Essentially the same reductions in standard deviation were obtained when these effects were included, as demonstrated in Tables II, III, and IV. In addition it can be seen from a comparison of Tables III and IV that increasing the spectral width of the multimode pump laser from 0.10 to 0.69 cm-' results in a reduction in standard deviation. Weight-ing reduces the standard deviation to -3% of the aver-age temperature for the larger spectral bandwidth. The effect of the choices of weighting coefficients on the average temperatures and average standard devi-ations obtained from all the single-pulse data is also
shown in Tables II, III, and IV. The standard devi-ations are largely insensitive to the amount of CARS noise included in the weighting coefficients. Howev-er, a larger CARS noise contribution resulted in a greater temperature shift.
While preparing this manuscript, we learned of simi-lar results obtained by Barton and Garneau.3 9 They observed standard deviations of 75 K multimode (no intracavity etalon), 91 K (multimode with intracavity etalon), and 102 K (ELN operating but no single-mode conditional sampling) for a 2100 K flame. These trends are consistent with our observations.
Greenhalgh and Porter'0 have reported a depen-dence of standard deviation on a CARS signal level. We have collected the data in Tables II-IV at approxi-mately constant CARS intensity to minimize such po-tential effects. In separate experiments we have
sub-sequently investigated the effect of a fivefold
reduction in CARS intensity. The standard devi-ations observed were 70.2 ± 4.0 and 72.4 t 4.8 K (for a 0.69-cm1 pump) at normal and reduced CARS inten-sity, respectively. Thus, unlike Greenhalgh and Por-ter,10we observe no dependence of standard deviation on a CARS signal level. This result is not surprising since the average detector shot noise only increases from -2 to -4% with decreasing CARS signal and is substantially less than the measured noise-in-signal
(Table I).
The cause of the systematic temperature shifts with weighting is not clear. However, it should be noted that the weighted fits are more sensitive to the value of the nonresonant susceptibility (xNR) used in calcula-tion of the theoretical spectra. We have examined the effect of changing XNR by 10% on the best fit
tempera-tures with weighting (4% CARS noise) and without. The fit to the single-mode data (including collisional 1 January 1987 / Vol. 26, No. 1 / APPLIED OPTICS 105
20-Z
-
Table II. Effect of Weighting Coefficients on Analysis of Single-Pulse Single-Mode Data with Collisional Narrowing Included In CARS Theory
Average temperature Standard deviation
(K) (K) Weighting 1563 131 + 17 None 1551 71 + 5 Detector shot noise only 1531 59 + 6 Detector shot noise +4% CARS noise 1492 61 ± 7 Detector shot noise +20% CARS noise
Note: Error limits are 95% confidence intervals.
Table ll. Effect of Weighting Coefficients on Analysis of Single-pulse multimode (0.10-cm-1) Pump Laser Data with Collislonal Narrowing and
Cross-Coherence Included in CARS Theory
Average temperature Standard deviation
(K) (K) Weighting 1586 88 5 None 1554 51 3 Detector shot noise only 1526 45 + 2 Detector shot noise +4% CARS noise
Note: Error limits are 95% confidence intervals.
Table IV. Effect of Weighting Coefficients on Analysis of Single-Pulse Multimode (0.69-cm'1) Pump Laser Data with Collisional Narrowing and
Cross-Coherence Included in CARS Theory
Average temperature Standard deviation
Tav aT (K) (K) Weighting 1602 71 + 6 None 1555 46 4 Detector shot noise only 1532 42 + 5 Detector shot noise +4% CARS noise
Note: Error limits are 95% confidence intervals.
narrowing) produced temperature changes of 9 K (un-weighted fit) and 18 K ((un-weighted fit). The corre-sponding numbers for the 0.1-cm-1 multimode data (with the effect of cross-coherence included) were 13 and 24 K. A decrease in NR leads to an increase in the fitted temperatures. Thus a 20% decrease in the value of NR used would eliminate about one-half of the single-pulse temperature shifts observed in Tables II and III and would entirely eliminate the similar but smaller shifts observed in fitting the multipulse aver-aged spectra.
Another possibility is that, although care was taken to avoid nonlinear behavior of the diode array
detec-tor,2 some small residual effect remained. If so, the weighted best fit temperatures would be expected to be lower because of their greater emphasis on the lower intensity portion of the spectrum.
The selection of weighting coefficients appears to be a compromise between reducing the standard devi-ation and avoiding temperature shifts. Weighting places emphasis on the lower intensity parts of the CARS spectrum and thus the need, for example, to know xNR (and hence composition) accurately. The nonresonant background can be eliminated [with an accompanying large (sixteen fold) reduction in CARS signal]. However, unspecified temperature shifts have been observed in fitting background-free spec-tra.9 Weighting with terms associated with detector noise only is sufficient to realize most of the reduction in standard deviation while minimizing the tempera-ture shifts.
Pealat et al.9 have also performed weighted fits of experiment to theory. On the basis of an analysis of Poisson noise they minimized
I
Ti(lnE, - nT)2,where the theoretical intensities T were used as weighting parameters. They did not compare weight-ed and unweightweight-ed fits. Their weighting scheme is equivalent to a linear fit with a weighting coefficient of
1/Ti and would thus be expected to have a similar effect to weighting with o = m = 0 in Eq. (16). They note that, if the T weighting is neglected in their fits, a temperature bias results. Since this latter weighting scheme would be equivalent to setting = k = 0 in Eq. (16) and retaining only the CARS noise term, this is consistent with our observation of temperature shifts with larger values of m. It should be noted that the presence of the c0 term in Eq. (16) limits the emphasis put on the very low intensity portion of the CARS spectrum.
The use of a multimode laser clearly confers an advantage in reducing the single-shot CARS noise and thus reducing the temperature spreads observed with
repeated single-shot temperature measurements.
With this advantage comes the greater complexity of the CARS theory calculations, although the recently developed analytic solutions35 3 7 of the cross-coher-ence effects minimize this difficulty. The possible effect of pump laser field statistics on the ratio of the resonant to nonresonant CARS signal4O41 is a problem which can be avoided by using a single-mode pump laser. For some lasers, the ratio of nonresonant to resonant CARS signal is found to increase4 0,41 with increasing correlation between the pump laser compo-nents. If such increases occurred in our experiments, they would require use of an artificially high value of
XNR to fit the spectra, which, as noted above, would
increase the discrepancy between the weighted and unweighted fits. Furthermore, any increase in XNR
would lower the best-fit multimode temperatures in Table V that are already at the lower limits of agree-106 APPLIED OPTICS / Vol. 26, No. 1 / 1 January 1987
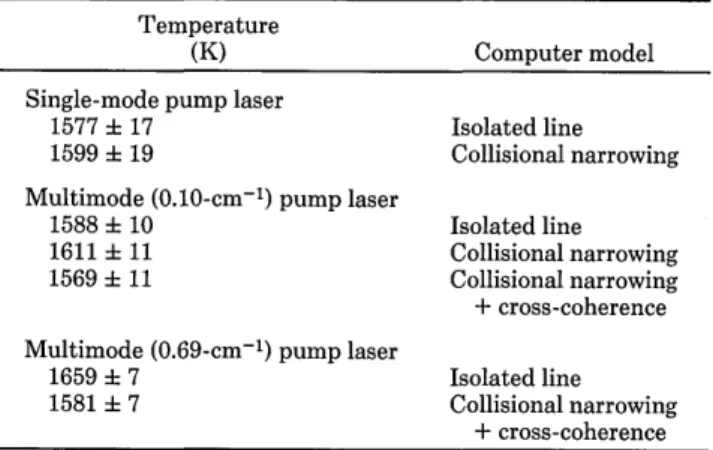
Table V. Summary of Multipulse CARS Temperature Measurements 10 mm above Burner Center
Temperature
(K) Computer model
Single-mode pump laser
1577 ± 17 Isolated line
1599 i 19 Collisional narrowing
Multimode (0.10-cm-1) pump laser
1588 i 10 Isolated line
1611 + 11 Collisional narrowing
1569 ± 11 Collisional narrowing
+ cross-coherence
Multimode (0.69-cm-1) pump laser
1659 i 7 Isolated line
1581 ± 7 Collisional narrowing
+ cross-coherence
Note: Error limits are 95% confidence intervals.
ment with both the single-mode pump laser tempera-tures and the Na line-reversal temperatempera-tures.
A quantitative evaluation of the reduction of CARS noise with increasing pump laser bandwidth does not appear possible in the present state of the emerging theories of CARS noise. We have attempted to model this process by computing the quantity
___ =
[E
(Ik)2] / (Ik~,which represents the noise attributable to k-indepen-dent modes of intensity Ik.8 cr is the standard
devi-ation, and the () brackets indicate a time average. We have taken the Stokes laser mode spacing to be 0.01 cm-' (approximately the lowest-order TEMoo mode spacing), and Ik was calculated as the pump convolved CARS intensity at the 0.01-cm-' interval. The sum-mation was performed over all the I values falling under the envelope of the Voigt instrument function, and the ratio v/(I) was calculated as a function of frequency (cm-') for pump laser widths (FWHM) of 0.69, 0.1, and 0.016 cm-' (approximately single-mode conditions). The theoretical noise spectra exhibited peaks which coincided with the peaks in the CARS spectrum, and the noise increased with decreasing pump laser bandwidth. The average noise in the 1-0 band was -17% (0.016 cm-'), 12.5% (0.10 cm-'), and 6.2% (0.69 cm-'), where the pump laser bandwidths are in parentheses. The noise, calculated in a similar way, for a purely nonresonant spectrum was 5.6% indepen-dent of pump laser bandwidth.
The experimental noise figures in Table I show a similar trend with pump laser bandwidth, but the ab-solute values are somewhat higher. The experimental resonant noise spectra also exhibited peaks which co-incided with those of the CARS spectrum itself, but, unlike the theoretical noise spectra, they did not ex-hibit the falloff of noise in the region of the 2-1 band
and beyond (21,060-21,100 cm-'). This may be due to the increasing importance of uncorrected detector shot noise in these low-intensity portions of the CARS spec-trum.
Nonresonant experimental spectra demonstrate in-creasing noise with inin-creasing laser bandwidth (Table I), a fact not predicted by the calculations discussed above. This may be attributable to amplitude fluctu-ations in the temporal profile of the Stokes laser, which increase with increasing pump laser bandwidth.7
These amplitude fluctuations7 were invoked5-7 to explain the increase in noise observed when a multi-mode pump laser (rather than the temporally smooth single-mode pump laser) was used to pump the Stokes laser and excite the nonresonant CARS spectra. The amplitude fluctuations in our system7appear to result from the Stokes laser attempting to follow the tempo-ral behavior of the pump laser.
In summary, the observed behavior can be viewed as resulting from (spectral) averaging over a greater num-ber of Stokes laser modes as the bandwidth of the pump laser increases. This beneficial averaging is offset by an increase in noise due to an increase in the amplitude fluctuations of the Stokes laser with in-creasing pump laser bandwidth. The spectral averag-ing will be particularly important in the flame spectra where very few Stokes modes contribute to the excita-tion of the narrow (0.03-0.04-cm-1) Raman resonances when a single-mode pump laser is used. In this regard the dual-broadband CARS approach of Eckbreth and Anderson4 2should, as noted by the authors, result in reduced noise because of the use of two statistically independent dye sources, which should reduce both sources of noise discussed above.
At lower temperatures or higher pressures the bene-ficial averaging resulting from the larger pump laser bandwidth would be expected to decrease because of the increased Raman linewidths. As the Raman linewidths increase the noise behavior observed with nonresonant CARS spectra should be approached.
D. Multipulse Average CARS Temperature Measurements
The question of the accuracy of the flat-flame burn-er CARS tempburn-erature measurements and their depen-dence on including collisional narrowing and cross-coherence effects in the CARS theory is more readily addressed by analyzing multipulse averaged CARS spectra. The true mean temperature should be equal to the temperature obtained from an average spectrum for an isothermal source such as our flat-flame burner. A 100-pulse average single-mode CARS flame spec-trum and a best-fit theory specspec-trum calculated with collisional narrowing effects included in the CARS code are shown in Fig. 7. The spectrum was recorded 10 mm above the burner surface on the center line. The estimated sodium line-reversal temperature 10 mm above the burner surface was 1593 i 18 K. CARS
temperature measurements taken along the Na line-reversal axis showed that the center line temperature was some 18 K hotter than the average temperature observed over the Na seeded region of the flame. Thus the observed sodium line-reversal temperature of 1575 i 15 K was increased by this amount to give the esti-mated center line value of 1593 ± 18 K.
e.e8
E 0.06_ EXPERIMENTAL N, CARS SPECTRUM L H,/AIR FLAT FLAME 0 = 0.575
T THEORETICAL LMS FIT, T = 1594 K U E I 0.04-T E 0.00-21050 21070 21090 2110 21130 211150 UAuENUMBER
Fig. 7. Experimental single-mode N2CARS flame spectrum com-pared with a best fit theory spectrum calculated with collisional
narrowing included.
Over a period of six months we recorded a series of multimode and single-mode 100-400-pulse average CARS spectra 10 mm above burner center. The data were initially analyzed using the isolated line approxi-mation for the Raman lines and later by including the effects of collisional narrowing and cross-coherence. We have also examined the consistency of the instru-mental (slit) function by determining the four Voigt parameters from both room temperature and flame spectra. The room temperature instrument function was routinely used to obtain the temperatures report-ed here. The average temperatures so obtainreport-ed are summarized in Table V. Including collisional narrow-ing increases the best-fit temperatures of snarrow-ingle-mode and the 0.1-cm'1 multimode pump laser data by 20-25 K, and the final temperature derived from the single-mode data is in excellent agreement with the Na line-reversal temperature. With collisional narrowing in-cluded, the instrument (slit) functions determined from either single-mode room temperature or flame N2 spectra were essentially identical. With the isolated line model the room temperature slit function was 10-15% narrower than that derived from hot spectra.
With multimode data cross-coherence must also be included in the calculations, and as shown in Table V the effect is to lower the best fit temperatures -40 K. Collisional narrowing and cross-coherence have oppos-ing effects on best-fit temperatures, and the final perature is only 19 K less than the isolated line tem-perature. This cancellation is a function of the assumed pump bandwidth since an attempt to fit to the data with an assumed 0.4-cm'1 pump laser band-width (the laser manufacturer's specification) pro-duced a final best fit temperature of 1531 K, some 57 K lower than the isolated line temperature and 62 K lower than the Na line-reversal temperature. The
0.1-cm'I
pump laser result of 1569 i 11 K is in satisfactoryagreement with the Na line-reversal temperature of 1593 ± 18 K. The instrument function was very simi-lar to that derived from the single-mode data.
The effect of neglecting collisional narrowing and cross-coherence is much more marked for the
0.69-cm-l multimode data. -The isolated line best fit tem-perature of 1659 K is in poor agreement with the sodi-um line-reversal temperature and with the single-mode temperatures. With collisional narrowing and cross-coherence effects included in the code, the best-fit temperature of 1581 is in excellent agreement with the Na line-reversal temperature of 1593 K.
Reducing XNR by 20% gives approximate best fit temperatures of 1617 ± 19 K (single-mode) and 1595 i 11 K (multimode 0.10 cm-') in equally good agreement with the line-reversal temperature of 1593 ± 18 K.
We conclude that it is necessary to include the ef-fects of collisional narrowing and cross-coherence to predict correctly CARS temperatures in atmospheric pressure flames. With these effects included the cal-culated temperatures are within 25 K of the Na line-reversal temperatures for both multimode and single-mode pump laser data.
E. Stokes Laser Noise
With the large number of modes excited in the Stokes laser there is the possibility6of selective focus-ing of these modes whereby the lower-order modes may focus more tightly and thus more efficiently wave mix with the pump laser field. In our earlier work we saw no evidence of this, but the astigmatism produced by a tilted CARS focusing lens may have masked any effect.
As noted above the observed nonresonant noise (8.0% with a 70-cm-' analysis bandwidth) with a sin-gle-mode pump laser was higher than that observed previously7 (5.7%). We, therefore, investigated the effect of adding a beam expansion telescope to the Stokes laser with a magnification of 1.0, with lenses chosen to deliberately induce some spherical aberra-tion. With this arrangement the CARS intensity dropped a factor of -2, and the observed nonresonant noise was 5.5%. When the telescope was removed the, noise returned to the previous 8.0%.
The 5.5% noise is approximately equal to the 5% noise previously observed in the Stokes laser itself.7 A plausible explanation of this observation is that the spherical aberration introduced in the Stokes laser blurred any tendency for selective focusing of various modes. Thus the pump laser wave mixed with a Stokes laser whose modes were effectively spatially averaged.
V. Conclusions
From an analysis of both the shot-to-shot variation in spectral shape of CARS spectra and the standard deviation of the temperatures calculated from them, we conclude that increasing the pump laser spectral bandwidth decreases the CARS noise. The use of a multimode pump laser is clearly indicated for the gen-eration of low-noise resonant spectra at low to moder-ate pressures.
The precision of the single-pulse temperature mea-surements can be dramatically increased by perform-ing weighted fits of theoretical and experimental CARS spectra. The weighting coefficients were de-108 APPLIED OPTICS / Vol. 26, No. 1 / 1 January 1987
rived from experimental measurements of detector noise and noise in the CARS signal itself.
To obtain accurate temperature measurements in atmospheric pressure flames, it is necessary to include collisional narrowing (for both single-mode and multi-mode) and cross-coherence (multimode only) effects in the CARS theory. With the appropriate effects in-cluded, both the single-mode and multimode pump laser data gave flame temperatures which agreed with Na line-reversal to better than 25 K at 1600 K.
The authors would like to acknowledge the help provided by the United Technologies Research Center (UTRC) in supplying a copy of the original isolated line program. T. Parameswaran would like to thank R. J. Hall of UTRC for continued help and advice on the development of the computer programs needed for generating the theoretical CARS spectra.
The authors would also like to acknowledge the help of F. D. Findlay for participation in the sodium line-reversal measurements and contributions to develop-ment of CARS spectroscopy at DREO.
References
1. S. A. J. Druet and J. P. E. Taran, "CARS Spectroscopy," Prog. Quantum Electron. 7, 1 (1981).
2. R. J. Hall and A. C. Eckbreth, "Coherent Anti-Stokes Raman Spectroscopy (CARS): Application to Combustion Diagnos-tics," in Laser Applications, Vol. 5, J. F. Ready and R. K. Erf, Eds. (Academic, New York, 1984), pp. 213-309.
3. A. B. Harvey, Ed., Chemical Applications of Nonlinear Raman Spectroscopy (Academic, New York, 1981).
4. J. W. Nibler and G. V. Knighten, "Coherent Anti-Stokes Raman
Spectroscopy," in Raman Spectroscopy of Gases and Liquids,
A. Weber, Ed. (Springer, Berlin, 1979), pp. 253-299.
5. A. C. Eckbreth, G. M. Dobbs, J. H. Stufflebeam, and P. A. Tellex, "CARS Temperature and Species Measurements in Augmented Jet Engine Exhausts," Appl. Opt. 23, 1328 (1984).
6. A. C. Eckbreth and J. H. Stufflebeam, "Considerations for the Application of CARS to Turbulent Reacting Flows," Exp. Fluids 3, 301 (1985).
7. D. R. Snelling, R. A. Sawchuk, and R. E. Mueller, "Single-Pulse CARS Noise: A Comparison Between Single-Mode and Multi-mode Pump Lasers," Appl. Opt. 24, 2771 (1985).
8. D. A. Greenhalgh and S. T. Whittley, "Mode Noise in Broad-band CARS Spectroscopy," Appl. Opt. 24, 907 (1985).
9. M. Pealat, P. Bourchardy, M. Lefebvre, and J. P. Taran,
"Preci-sion of Multiplex CARS Temperature Measurements," Appl. Opt. 24, 1012 (1985).
10. D. A. Greenhalgh and F. M. Porter, "CARS Applications in
Chemical Reactors, Combustion and Heat Transfer," in Pro-ceedings, First International Laser Sciences Conference,
Dal-las (Nov. 1985).
11. D. R. Snelling, G. J. Smallwood, R. A. Sawchuk, and T. Parames-waran, "Nonlinearity and Single Shot Noise Problems in CARS Spectroscopy," at Sixty-seventh AGARD PEP Meeting on Ad-vanced Instrumentation for Aeroengine Components, Philadel-phia (May 1986).
12. D. R. Snelling, R. A. Sawchuk, and G. J. Smallwood, "Multi-channel Light Detectors and Their Use for CARS Spectrosco-py," Appl. Opt. 23, 4083 (1984).
13. M. B. Morris and T. J. Mcllrath, "Portable High-Resolution
Laser Monochromator-Interferometer with Multichannel
Elec-tronic Readout," Appl. Opt. 18, 4145 (1979).
14. L. P. Goss, D. D. Trump, B. G. MacDonald, and G. L. Switzer,
"10 Hz Coherent Anti-Stokes Raman Spectroscopy Apparatus
for Turbulent Combustion Studies," Rev. Sci. Instrum. 54, 563 (1983).
15. J. P. Botha, and D. B. Spalding, "The Laminar Flame Speed of Propane/Air Mixtures with Heat Extraction from the Flame,"
Proc. R. Soc. London Ser. A 225, 71 (1954).
16. D. R. Snelling and M. Fischer, "Design and Calibration of a
Flat-Flame Burner using Line-Reversal Techniques," Technical Note 85-4, Defence Research Establishment Ottawa, Canada
(1985).
17. F. Printer, "Dependence of the Width of the Rotational Raman Lines of N2and CO2on the Quantum Numberj," Opt. Spectrosc.
USSR 17, 428 (1964).
18. A. D. May, J. C. Stryland, and G. Varghese, "Collisional
Narrow-ing of the Vibrational Raman Band of Nitrogen and Carbon
Monoxide," Can. J. Phys. 48, 2331 (1970).
19. J. Bonamy, L. Bonamy, and D. Robert, "Overlapping Effects
and Motional Narowing in Molecular Band Shapes: Applica-tion to the Q-Branch of HD," J. Chem. Phys. 67, 4441 (1977). 20. R. J. Hall, "Coherent Anti-Stokes Modelling for Combustion
Diagnostics," Opt. Eng. 22, 322 (1983).
21. M. L. Koszykowski, R. L. Farrow, and R. E. Palmer,
"Calcula-tion of Collisionally Narrowed Coherent Anti-Stokes Raman
Spectroscopy Spectra," Opt. Lett. 10, 478 (1985).
22. M. A. Yuratich, "Effect of Laser Linewidth on Coherent
Anti-Stokes Raman Spectroscopy," Mol. Phys. 38, 625 (1979). 23. R. J. Hall, "CARS Spectra of Combustion Gases," Combust.
Flame 35, 77 (1979).
24. R. L. Farrow, P. L. Mattern, and L. A. Rahn, "Comparison
Between CARS and Corrected Thermocouple Temperature Measurements in a Diffusion Flame," Appl. Opt. 21,.3119
(1982).
25. T. Lasser, "An Alternative Method for CARS Spectra Convolu-tions," Opt. Commun. 35, 447 (1980).
26. E. E. Whiting, "An Empirical Approximation to the Voigt Func-tion," J. Quant. Spectrosc. Radiat. Transfer 8, 1379 (1968). 27. H. Kim, "Computer Programming in Physical Chemistry
La-boratory," J. Chem. Educ. 2, 120 (1970).
28. C. M. Penney, R. L. St. Peters, and M. Lapp, "Absolute Rota-tional Raman Cross Sections for N2, 02, and C02," J. Opt. Soc. Am. 64, 712 (1974).
29. L. A. Rahn, Sandia National Laboratories, unpublished results. 30. R. J. Hall, "Pressure Broadened Linewidths for CARS
Thermo-metry," Appl. Spectrosc. 34, 780 (1980).
31. G. J. Rosasco and W. S. Hurst, "Measurement of Resonant and
Nonresonant Third Order Nonlinear Susceptibilities by
Coher-ent Raman Spectroscopy," Phys. Rev. A 32, 281 (1985).
32. T. Lundeen, S. Y. Hou, and J. W. Nibler, "Nonresonant Third
Order Susceptibilities of Various Gases," J. Chem. Phys. 79, 6301 (1983).
33. R. L. Farrow, Sandia Laboratories, Livermore, CA; private
com-munication.
34. T. Parameswaran and D. R. Snelling, "A Computer Program to Generate Coherent Anti-Stokes Raman Spectra," Technical Note 81-18, Defence Research Establishment Ottawa, Canada
(1982).
35. R. E. Teets, "Accurate Convolutions of Coherent Anti-Stokes
Raman Spectra," Opt. Lett. 9, 226 (1984).
36. H. Kataoka, S. Maeda, and C. Hirose, "Effects of Laser Line
Width on the Coherent Anti-Stokes Raman Spectroscopy
Spec-tral Profile," Appl. Spectrosc. 36, 565 (1982).
37. D. A. Greenhalgh and R. J. Hall, "A Closed Form Solution for
the CARS Intensity Convolution," Opt. Commun. 57, 125
(1986).
38. A. K. Hui, B. H. Armstrong, and A. A. Wray, "Rapid
Computa-tion of the Voigt and Complex Error FuncComputa-tions," J. Quant.
Spectrosc. Radiat. Transfer 19, 509 (1978).
39. S. A. Barton and J. M. Garneau, Defence Research
Establish-ment Valcartier, Quebec City; private communication.
40. L. A. Rahn, R. L. Farrow, and R. P. Lucht, "Effects of Laser
Field Statistics on Coherent Anti-Stokes Raman Spectroscopy
Intensities," Opt. Lett. 9, 223 (1984).
41. R. L. Farrow, L. A. Rahn, and R. P. Lucht, "Effect of
Non-Gaussian Pump Fuels Statistics on Unresolved CARS Spectra,"
in Proceedings, Ninth International Conference on Raman
Spectroscopy (Chemical Society of Japan, Tokyo, 1984), pp. 340-341.
42. A. C. Eckbreth and T. J. Anderson, "Dual Broadband CARS for Simultaneous Multiple Species Measurements," App. Opt. 24,
2731 (1985).
Meetings continued from page 90 18-20 SIAM Conf. on Optimization, Houston Soc. for
Indus-trial & Applied Mathematics, 14th Fl., 117 S. 17th St., Phila., PA 19103
1987
April
13-17 Laser Safety: Hazards, Inspection & Control course,
San Francisco LaserInst. of Amer.,5151 Monroe St., Toledo, OH 43623
14-17 Antenna Analysis, Design, & Measurements course,
Tempe Ctr. for Professional Development, Coll. of Eng. & Applied Sciences, AZ State U., Tempe, AZ 85287
20-24 Fundamentals & Applications of Lasers course, San
Francisco Laser Inst. of Amer., 5151 Monroe St., Toledo, OH 43623
27-1 May Conf. Lasers & Electro-Optics, Baltimore OSA Mtgs. Dept., 1816 Jefferson P1., N.W., Wash., DC
20036
27-1 May Int. Quantum Electronics Conf., Baltimore OSA Mtgs. Dept., 1816 Jefferson Pl., N.W., Wash., DC
20036
28-30 Fiber Optics course, London Sira Ltd., South Hill, Chislehurst, Kent BR7 5EH, UK
30 Optical Micro Metrology of Surfaces Mtg., London D.
Swift, Pilkington P E Ltd., Glascoed Rd., St. Asaph, Clwyd, LL17 OLL, UK
May
4-7 Advanced Industrial Laser Safety Officers course, San Francisco Laser Inst. of Amer., 5151 Monroe St., Toledo, OH 43623
11 Intro. to Acoustic Emission for Nondestructive Testing course, Norman D. Egle, 865 Asp Ave., Rm. 212,
Oklahoma U., Norman, OK 73019
11-15 Applied Optics course, Las Cruces L. Radziemski
Physics Dept., NMSU, Las Cruces, NM 88003 11-15 SID'87, New Orleans M. Goldfarb, Palisades Inst. for
Res. Services Inc., 201 Varick St., New York, NY
10014
12-15 Int. Symp. on Optical Particle Sizing: Theory and Prac-tice, Rouen G. Gouesbet, Dept. Chem. Eng., INSA de Rouen, BPO8, 76130 Mont-Saint-Aignan, France 13-15 7th Int. Workshop on Expert Systems & Their
Applica-tions, Avignon Agence de l'Informatique, Tour Fiat, 92084 Paris-La Defense, Cedex 16, France
18-21 Modern Experimental Spectroscopy course, Las Cruces
Laser Inst. of Amer., 5151 Monroe St., Toledo, OH
43623
27-29 6th Int. IPAT Mtg., Brighton D. Cowan, Tech. Media Services, 62 Kelvingrove St., Glasgow G3 7SA, UK
June
15-28 The Effects of Modes of Formation on the Structure of Glass Conf., Nashville D. Kinser, Box 1689-B,
Van-derbilt U., Nashville, TN 37235
15-29 Disordered Solids: Structures & Processes course, Erice, Italy B. Di Bartolo, Dept. Physics, Boston
Coll., Chestnut Hill, MA 02167
17-25 21st Session of the Int. Commission on Illumination,
Venice W. Budde, NRC, Ottawa, Canada KIA OR6 21-25 5th National Synchrotron Radiation Instrumentation Conf., Madison R. Ward, Synchrotron Radiation Ctr., 3725 Schneider Dr., Stoughton, WI 53589 22-26 Laser Mtg., Munich Kallman Assoc., 5 Maple Ct.,
Ridgewood, NJ 07450
22-26 Optical Image Processing & Pattern Recognition course,
Madison F. Drake, Eng. Professional Development Dept., U. WI, 432 N. Lake St., Madison, WI 53706 22-26 8th Int. Conf. on Laser Spectroscopy, Are S. Svanberg,
Box 118, S-221 00 Lund, Sweden
29-30 Color Appearance Top. Mtg., Annapolis OSA Mtgs.
Dept., 1816 Jefferson Pl., N.W., Wash., DC 20036
July
1-3 Color Vision Deficiencies Int. Symp., Annapolis B.
Drum, Johns Hopkins U., School of Medicine, Wil-mer Ophthalmological Inst., 601 N. Broadway B-27, Baltimore, MD 21205
1-4 Computer Assisted Radiology Mtg., Berlin IEEE, 345
E. 47th St., New York, NY 10017
17-22 40th Ann. SPSE Conf. & Symp. on Hybrid Imaging
Systems, Rochester D. Wilkalis, P.O. Box 821, Fair-port, NY 14550
110 APPLIED OPTICS / Vol. 26, No. 1 / 1 January 1987