HAL Id: hal-02972499
https://hal.archives-ouvertes.fr/hal-02972499
Submitted on 29 Nov 2020
HAL is a multi-disciplinary open access
archive for the deposit and dissemination of
sci-entific research documents, whether they are
pub-lished or not. The documents may come from
teaching and research institutions in France or
abroad, or from public or private research centers.
L’archive ouverte pluridisciplinaire HAL, est
destinée au dépôt et à la diffusion de documents
scientifiques de niveau recherche, publiés ou non,
émanant des établissements d’enseignement et de
recherche français ou étrangers, des laboratoires
publics ou privés.
User Group Analytics Survey and Research
Opportunities
Behrooz Omidvar-Tehrani, Sihem Amer-Yahia
To cite this version:
Behrooz Omidvar-Tehrani, Sihem Amer-Yahia. User Group Analytics Survey and Research
Opportu-nities. IEEE Transactions on Knowledge and Data Engineering, Institute of Electrical and Electronics
Engineers, 2020, �10.1109/TKDE.2019.2913651�. �hal-02972499�
User Group Analytics
Survey and Research Opportunities
Behrooz Omidvar-Tehrani, Member, IEEE, and Sihem Amer-Yahia, Member, IEEE
Abstract—User data can be acquired from various domains and is characterized by a combination of demographics such as age and occupation, and user actions such as rating a movie or recording one’s blood pressure. User data is appealing to analysts in their role as data scientists who seek to conduct large-scale population studies, and gain insights on various population segments. It is also appealing to users in their role as information consumers who use the social Web for routine tasks such as finding a book club or choosing a physical activity. User data analytics usually relies on identifying group-level behaviors such as “Asian women who publish regularly in databases”. Group analytics addresses peculiarities of user data such as noise and sparsity to enable insights. In this survey, we discuss different approaches for each component of user group analytics, i.e., discovery, exploration, and visualization. We focus on related work which arises from combining those components. We also discuss challenges and future directions of having an all-in-one system, where all those components are combined. This survey has been presented in the form of two tutorials [1], [2]. Index Terms—User data, user group, user group analytics.
F
1 I
NTRODUCTIONU
SERdata is of interest to analysts in their role as datascientists who seek to conduct large-scale population studies, and gain insights on various population segments. It is appealing to users in their role as information con-sumers who use the social Web for routine tasks such as finding a book club or choosing a restaurant. It is also useful to domain experts who seek to understand their users.
We define user data analytics as a collection of methods and tools to extract value from user data. It relates to a special field of business analytics, referred to as behavioral analytics [3]. The goal of behavioral analytics is to unveil insights into the behavior of consumers on eCommerce plat-forms, online games, IoT and web and mobile applications. For example, in e-commerce and retail, behavioral analytics serves product recommendations and predicting future sale trends. In online gaming, predicting usage trends shapes future releases. Similarly, determining how users use an application helps predict future usage and preferences in application development.
A common way of analyzing user data is user group analysis whose purpose is to breakdown users into groups to gain a more focused understanding of their behavior. We refer to that as User Group Analytics (UGA). UGA helps analysts make better and faster decisions [4] with higher certainty [5]. UGA also addresses peculiarities of user data such as noise and sparsity. UGA is useful to social scientists who look to conduct large-scale population studies. UGA is also useful in forming suggestions of alike people when looking for a restaurant or a fan club [6], [7].
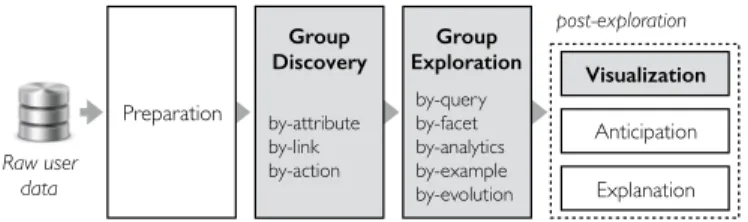
For the purpose of this survey, we propose to organize the different components that form UGA into a single architecture depicted in Fig. 1. UGA starts from raw user
• Affiliation. Univ. Grenoble Alpes, CNRS, Grenoble INP, LIG, F-38000 Grenoble France / Institute of Engineering
• E-mail. [email protected] Raw user data post-exploration Group Exploration Explanation Visualization Recommendation Preparation Group Discovery Storytelling Statistical analysis by-query by-facet by-analytics by-example by-evolution by-attribute by-link by-action Raw user data post-exploration Group Exploration Explanation Visualization Anticipation Preparation Group Discovery by-query by-facet by-analytics by-example by-evolution by-attribute by-link by-action
Fig. 1. User group analytics framework.
data and discovers groups that reflect the behavior of a set of users, e.g., “Asian women who publish regularly in databases”. User data must first be cleansed and enriched [8] before group discovery (i.e., Preparation component in Fig. 1.) Once groups are discovered, there are still two challenges before turning results into insights.
• First, there may be millions of groups. An exhaustive scan
through all groups is not possible for analysts [9]. The
group explorationcomponent is designed to address this
challenge. It operates on the results of group discovery in an iterative manner. It provides means to analysts to navigate in the space of resulting groups.
• Second, groups need to be rendered in a
human-understandable form. To tackle this challenge, a post-exploration layer is designed to include auxiliary mod-ules for rendering exploration results, including mapping them to visual variables [10], [11], [12], anticipating con-tent and action recommendations [13], and explaining groups [14]. Explanations are provided for anomalies, outliers and interventions [15], [16], [17]. Although some anticipation will be discussed in this survey, our focus will be on group visualization. When analyzing aggregated data (such as user groups), human brains perform better on visual elements than textual information [4].
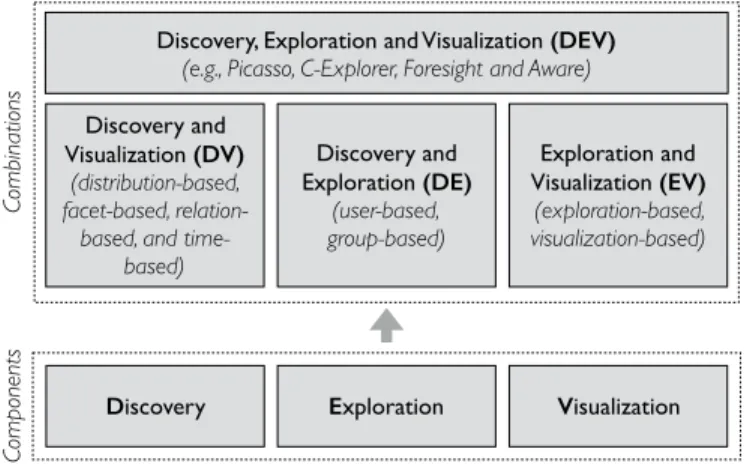
Exploration Discovery Visualization Discovery and Exploration (DE) (user-based, group-based) Discovery and Visualization (DV) (distribution-based, facet-based, relation-based, and
time-based) Exploration and Visualization (EV) (exploration-based, visualization-based) Co m po ne nt s Co m bi nat io ns
Discovery, Exploration and Visualization (DEV) (e.g., Picasso, C-Explorer, Foresight and Aware)
Fig. 2. UGA components and their combinations.
exploration and visualization of user groups. These compo-nents are highlighted in Fig. 1.
As analysts are empowered with expressive tools, their user data analysis needs grow. As a result, an ideal UGA system should collectively benefit from the functionalities of all its components. While a UGA task can be formulated only in terms of a single component, recent applications often require to combine some of those components. In this survey, we first review related work in UGA for each component separately and then focus on their combinations. We then discuss recent work which brings all the pieces together, and the challenges behind building an all-in-one UGA. Fig. 2 illustrates different components of UGA and their combinations.
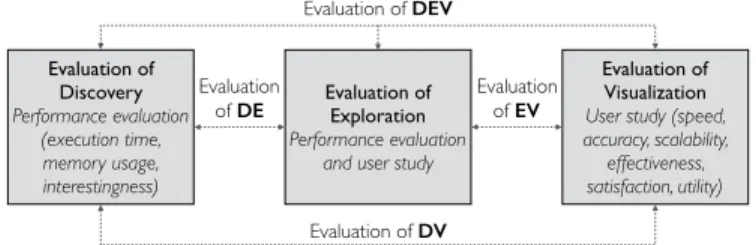
Various evaluation protocols are proposed separately for each UGA component. Group discovery is often evaluated using efficiency measures such as response time and mem-ory needs. Visualization is usually measured qualitatively by a user study. Exploration evaluation is in-between and often employs both qualitative and quantitative measures. In Section 5.4, we review different evaluation strategies for each UGA component and their combinations. We also dis-cuss future directions of designing an evaluation approach for an all-in-one UGA.
The survey is organized as follows. In Section 2, we pro-vide a generic model for user data and user groups. Then we review past (single components of UGA), current (pairwise combinations of UGA components), and future trends (all-in-one UGA) in user group analytics. Section 3 describes the past by covering related work for each individual UGA component. Section 4 discusses the current status of UGA frameworks and focuses on combining UGA components. Then in Section 5, we discuss the future of UGA and present challenges and opportunities of building an all-in-one UGA system. We conclude in Section 6. We note that this survey has been presented in the form of two tutorials [1], [2].
2 U
SERG
ROUPM
ODEL ANDU
SEC
ASESGiven a set of users U and a set of items I, we define user data as a database D of tuples hu, i, vi which represent a value v ∈ R induced by an action such as browsing, tagging, or rating, of user u ∈ U , on item i ∈ I. The notation used in this paper is summarized in Table 1.
TABLE 1 Notation reference D User dataset A Attributes U Users ρ Discovery objective I Items θ Exploration type G User groups V Visual variables
This generic data model describes multiple user datasets in the literature, such as 1.7M research publishing actions of
database researchers1 [18], 5B tweets [19], 300M customer
receipts from a retail chain of 1,800 stores [20], 10M rating
records from MOVIELENS2 [21], 50M artist ratings from
LASTFM3 [22], 1M electronic health records (EHR) [23]
and about 200K book ratings from BOOKCROSSING4 [24].
For instance in MOVIELENS, the tuple hJohn, Titanic, 4i
describes that the user John rated the movie Titanic with a score of 4. Also for the tweets dataset, the tuple hTiffany, tweet id , Hemophiliai describes that Tiffany tweets about Hemophilia.
Fig. 3. Pre-defined user groups in IMDb.
Attributes. Users and items have attributes drawn from
a set A. Instances of user attributes are age, gender, diet, political orientation, and occupation. Instances of item at-tributes are book author, movie director, tweet language, and treatment duration. The choice of what constitutes an attribute is application-dependent. For instance, a user on a collaborative rating site may have an “age” and “gender”, and a book has an “author” and “publisher”.
Social links. A social link hu, u0, link typei depicts the
potential bond between a pair of users u and u0 where
link type may represent co-authorship [25], affinity [26] or friendship [27].
2.1 User Groups
User data analytics is often conducted via user groups. Data scientists conduct large-scale population studies and gain
1. DM-Authors dataset: http://dx.doi.org/10.18709/PERSCIDO.2016.10. DS32.
2. MovieLens dataset: https://grouplens.org/datasets/movielens/. 3. LastFM dataset: https://labrosa.ee.columbia.edu/millionsong/lastfm. 4. BookCrossing dataset: https://grouplens.org/datasets/book-crossing/.
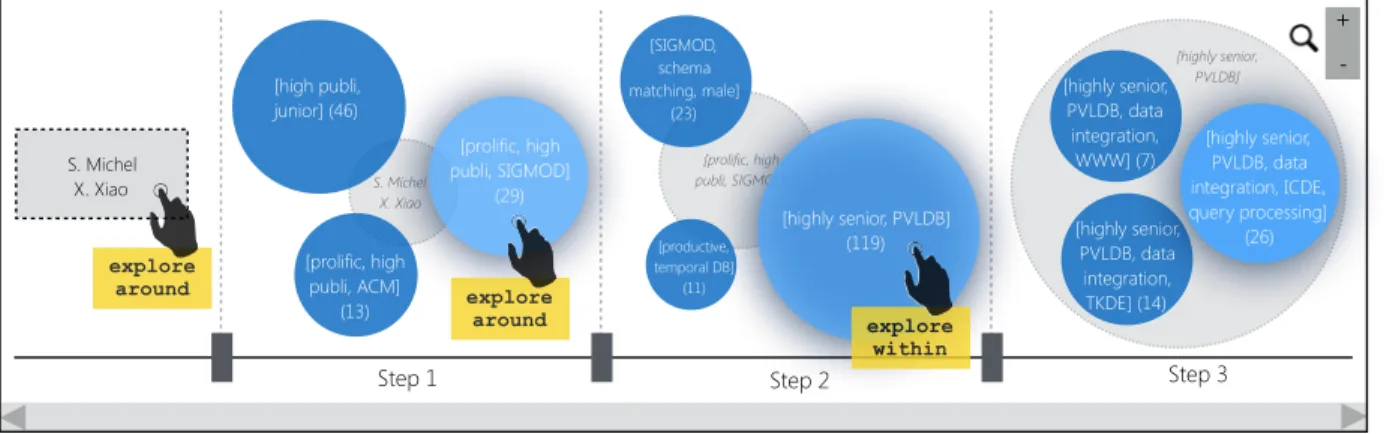
[prolific, high publi, SIGMOD] S. Michel X. Xiao Step 1 + -4 find group [high publi, junior] (46) Step 2 Step 3 [prolific, high publi, ACM] (13) [highly senior, PVLDB] (119) [productive, temporal DB] (11) explore around explore within [highly senior, PVLDB, data integration, TKDE] (14) [highly senior, PVLDB, data integration, ICDE, query processing] (26) [highly senior, PVLDB, data integration, WWW] (7) S. Michel X. Xiao explore around [SIGMOD, schema matching, male] (23) [prolific, high publi, SIGMOD] (29) [highly senior, PVLDB]
Fig. 4. UGA use case for domain experts: WebDB 2014 program committee formation.
insights on the preferences of different population segments. Information consumers explore alike user groups to be inspired for routine tasks such as choosing a restaurant or picking a TV subscription. Domain experts need to under-stand their users and their actions to be able to predict future actions and detect abnormal behavior. Fig. 3 illustrates
pre-computed user groups proposed in IMDb5 for the movie
Titanic. This breakdown shows groups like female teenagers and young female reviewers whose rating average differs from the overall average (8.6 and 8.3 respectively, versus the overall average of 7.8).
A user group g is a subset of U whose members have common attributes (e.g., having the same gender and occu-pation) and common actions (e.g., watching the same set of movies). For instance a user group g = [hgender, femalei, hage, youngi, Titanic] describes young female users who rated the movie Titanic. Throughout this survey, whenever it is clear from the context, we use the word group instead of user group. Also, when attributes are clear from the context, we will show group labels in a more concise form, e.g., g = [female, young, Titanic].
We use G to denote the set of all user groups. |G| is equal to the size of the powerset of attribute values and items. For instance, with |I| = 5, |A| = 4 and 3 values per attribute,
|G| will be 2(5+4×3)which is in the order of 105.
In the literature, user groups have been referred to with different terms, such as communities [28], [29], tribes [30], cliques [31], cohorts [32], teams [33], segments [34], patterns [35], [36], cubes [13], clusters [37], [38] and partitions [39]. For in-stance, clusters and partitions are assumed to represent non-overlapping user groups. Teams are sometimes used to refer to groups with one member as a leader. Communities are considered as groups whose social links are more important than their attributes.
2.2 Use Cases
We present few use cases which illustrate different applica-tions of UGA and its components in real world. Each use case captures a specific kind of users, i.e., data scientists, domain experts, and information consumers.
5. The Internet Movie Database (IMDb): http://www.imdb.com
Use Case 1 (Telecom Customers). Suzanne is a data scientist in a telecom company. She wants to discover groups of customers with common stories as ad targets. To find interesting groups, she explores similar ones. Then, she
visualizesa subset of interest for visual inspection. She
finds two promising groups, i.e., all-day customers requir-ing 2 SIM cards for the same smartphone and customers who mainly use their phone during breaks. Those will constitute her target for ads.
Use Case 2 (Expert-Set Formation). Martin is WebDB 2014
program chair6(i.e., a domain expert). He wants to build
a program committee formed by geographically dis-tributed male and female researchers with different se-niority and expertise levels. He explores various groups of researchers visually (Fig. 4). Starting from a seed set, the system discovers few groups out of which the group described as [prolific, high publications and pub-lishing in SIGMOD], has 29 geographically-distributed and gender-distributed researchers. Martin chooses few candidates for the committee and proceeds to the next iteration to find other members.
Use Case 3 (Quantified-Self). Mary, an information con-sumer, has over 100 ratings on BookCrossing. She is looking to join an online book club where she can engage in stimulating debates. Mary needs to discover and
ex-ploregroups with whom she highly agrees or disagrees,
i.e., those whose rating distribution is very close or very far to hers. As there exists one thousand groups within her criteria, she visualizes those groups to achieve a big picture for a better comparison.
3 UGA C
OMPONENTSUGA can be performed along three different components: discovery, exploration, and visualization [40]. A UGA task may be defined on each component individually or on a combination of components. An analyst may opt to focus on groups mined from raw user data (Section 3.1). Another may want to explore those groups further (Section 3.2). Another one may decide to visually analyze groups (Section 3.3). In this section, we review those components.
3.1 User Group Discovery
User group discovery refers to a set of approaches which derive value from user data in the form of user groups. For instance, discovery helps Suzanne, in Use Case 1, find groups as ad targets. The challenge in group discovery is the ever-increasing complexity of user data: it is not clear apriori which entities in user data (attributes, links, actions) should be leveraged to form groups.
3.1.1 Discovery process
Discovery is a function discover (D, ρ) → G which admits as input the user data D and an objective ρ, and returns the set of groups G where ρ(G, D) is optimized. A discovery approach can be as straightforward as a SQL query (i.e., a group-by statement), or as sophisticated as tracking evolu-tions in temporal user groups. In [41], [42], several discovery objectives are listed.
3.1.2 Types of group discovery
User groups are discovered using common attributes, links, and actions of users.
Attribute-based discovery. Such discovery methods
con-sider users as individual entities and leverage their common attributes to form groups. Representative discovery aims to mine groups that best represent a subset of users [43]. In [44], [45], a multi-objective group discovery method is pro-posed to optimize several objectives simultaneously, such as coverage of users, homogeneity of actions, and diversity of groups. In [46], an LSTM-based discovery method is proposed to discover patients’ sub-cohorts and facilitate therapeutic intervention.
Link-based discovery. Such discovery methods leverage
explicit connections between pairs of users, such as affinity, following, and friendship. Social discovery is a body of work which leverages social links to discover user groups in form of communities [47], [48], [49], [50], [51], [52]. This means that the user data is divided into communities, such that users within the same community tend to be connected by links, while those within different communities tend not to be connected. One common objective is Newman’s modularity [28] with the intuition of forming communities with stronger internal connectivity than external connectiv-ity. Another common objective is the density of social links in communities. In [53], a hierarchy of dense user communities is mined. Inversely, tenuous communities are mined in [54]. Various application-dependent objectives are also pro-posed in the literature which exploit social links. CRAQ leverages social links as collaboration probabilities and max-imizes the collective informative power of Twitter user groups for answering a question on the platform [55].
ENGTFP (Engaging Team Formation Problem) leverages
social links as engagement capacity values and maximizes this capacity in an online social network [33]. LDMS leverages social links as affinities and maximizes a score (LinkedIn Decision Maker Score) to identify groups of “sales decision
makers” in LinkedIn7 [56]. Also in [57], social links are
considered as social closeness and the total social distance from a group initiator (leader) is minimized.
7. http://linkedin.com
Action-based discovery. Action-based discovery mines
groups based on their common actions [37]. The most com-mon objective in this category is support, which counts the number of actions that constitute a group [38]. In case user actions are associated to time and location, time-based and location-based discovery are proposed, respectively. Time-based discovery. In [58], [59], [60], [61], the evolution of group actions (e.g., transition of trending topics, patterns of group appearance and disappearance) is mined. Also in [62], a group with an exceptional transition behavior is discovered (e.g., US users are more likely to listen to Reggae after listening to World music). The common objective in time-based discovery is drift, i.e., the sudden change in user actions.
Location-based discovery. Urbanity [63] models the dynam-ics of user’s actions in urban environments and discovers spatiotemporal hotspots of where group actions concentrate using a spatial density objective.
3.1.3 Discovery alone is not enough for UGA
Discovery alone is the method of choice for UGA when there is a clear question in the mind of the analyst to be formu-lated as an optimization problem. However, there are cases where group discovery alone is not enough. For instance, it is nearly infeasible for Suzanne in Use Case 1 to inspect all discovered groups of customers one by one to find groups of interest for advertisement. Since discovery is a one-shot process, it is incapable of handling exploratory scenarios where the analyst’s question evolves and improves in time. In such cases, the analyst needs to interact with found groups to validate different hypotheses. In other words, there is a need for the analyst to be inside the analytics loop. 3.2 User Group Exploration
Exploration refers to a set of approaches which enable interaction with user groups. It is part of a trending re-search direction called Human-in-the-Loop Data Analytics (HILDA) where people are involved in the data analytics process. Exploration helps analysts navigate the space of user groups (i.e., G) to obtain insights and validate their hypotheses [64]. For instance, exploring groups in a social network helps discover influential tags [65]. The challenge in group exploration is information overload, i.e., the space of all possible groups is huge, and the human cognitive perception capacity is limited [9].
In many exploration scenarios, the analyst only has a par-tial understanding of her needs and seeks to refine them as she extracts more insights from the data. For instance, Martin in Use Case 2 has a vague goal in mind (i.e., constructing a PC) and exploration helps him follow his directions of interest on researcher groups to progressively build the committee. Hence it is crucial to exploit the analyst’s feedback to im-prove exploration.
3.2.1 Exploration process
Each analysis session may contain a sequence of iterations whose transition is formed by exploration. Exploration is a function explore(g, θ) → P(G) which admits as input a group g ∈ G and an exploration type θ and returns a set of
groups (P(G) is the power-set of G). The exploration type specifies the analyst’s needs that the exploration should be based upon.
3.2.2 Types of group exploration
Exploration is a navigation in the space of user groups. At each iteration, the analyst increases her partial understand-ing of the analysis task. This awareness can be captured in different forms, such as queries, facets, distributions, examples, and evolutions. According to different ways of capturing the analyst’s needs, we recognize the five follow-ing exploration types: query, facet, analytics, by-example, and by-evolution.
By-Query. The parameter θ consists of predicates on
at-tributes and items which form a query. In each iteration of the analysis session, the analyst formulates a query and the exploration system returns groups which satisfy the query predicates. The analyst will then update her query iteratively with the new acquired knowledge in previous iterations and the system provides other groups in line with the analyst’s need [66], [67]. Note that query formulation requires a knowledge of the dataset and the query language, which is not always the case. Implementations of by-query exploration are as follows.
Explore next returns next possible groups for a given query. In [66], [68], a query is formulated in terms of constraints, and the next available group satisfying the constraints will be returned. In [69], the next random group is returned which is in line with feedback constraints of the analyst. Explore best region forms a query based on location attributes. In [65], [70], a spatial rectangle is given as query constraints and all groups within that rectangle are returned. There exist many applications for the explore best region implementation, including location-based advertisement targeting [63] and signage localization for marketing a new product [70]. Online community search. In [71], [72], [73], the problem of online community search is addressed, where the query is a set of users, and the task is to find a densely connected subset of U that contains those users.
By-Facet.The parameter θ consists of attribute-value pairs
(i.e., facets) which appeal interesting to the analyst. The exploration system returns groups whose members satisfy requested facets. For instance, if hgender, femalei is given as an attribute-value pair in θ, a group of female students would be a good candidate for exploration. In the next iterations, the analyst adds or removes facets to receive new groups. Comparing to by-query exploration, by-facet exploration reduces the burden on the analyst specifically on datasets with many attributes [74], [75]. One implemen-tation of by-facet exploration is Split which admits as input an attribute a ∈ A and returns one group per a’s value [13], [76]. The union of returned groups cover all users and the pairwise intersection of those groups yields an empty set. This by-facet implementation is equivalent to drill-down function in OLAP [13].
By-Analytics.The parameter θ consists of a desired
distribu-tion of user acdistribu-tions. The exploradistribu-tion system returns groups whose distribution is similar to the input. For instance
in [77], a desired histogram of rating scores is given and k groups with similar rating score distributions are returned. By-analytics exploration requires a knowledge of the user data and its underlying distributions. Implementations of by-analytics exploration are as follows.
Summarize returns groups with summarized input distribu-tions. In [78], two groups are given as input, and a group with common distribution characteristics of input groups is returned. For instance, if the members of both input groups tend to rate with low scores, a group with an average score of 2.0 (out of 10) would be returned as their summary. Redescribe returns a group with an identical distribution with the input group but different description [79]. For instance, if an increasing distribution (i.e., less ratings for the lower scores and more ratings for the higher scores) of the movie Titanic is described with the group [female, young], it can be redescribed by the group [female, teenager], as both groups rate Titanic in the same way (see Fig. 3).
Contrast returns a group whose distribution is totally differ-ent from the given group [80]. For instance, Martin in Use Case 2 may be interested to bring diversity in PC selection by exploring researcher groups who are entirely different from the ones he is currently investigating on.
By-Example.The parameter θ consists of group examples.
The analyst provides examples of what she needs to get and the system explores other groups similar to those provided examples. Example-based exploration is beneficial where the analyst is not able to express her needs otherwise [40], [81]. Implementations of by-example exploration are as fol-lows.
Remove prunes G by removing all groups similar to the given group [36], [82].
Neighbors returns k nearest neighbors of the given group [29], [83].
Explore around returns k similar groups to the input group with maximal diversity (i.e., they are as distinct as possible from each other). Also Explore within returns k sub-groups of the input group with maximal coverage [18] (see Fig. 4).
By-Evolution. The parameter θ consists of a group and a
desired point in time (timestamps, period, season, semester) and the system returns the evolved status of the group of in-terest at that time. An implementation of by-evolution is [58] where analysts can observe the evolution of communities over time.
Which exploration type to choose? Data scientists often
choose by-query exploration to quickly discover subsets of interest. However, it is only possible in case of a full knowledge of the users and the analysis task. Domain experts have often a good understanding of their data but they do not know how to form queries. Their method of choice is then by-facet, by-evolution, or by-analytics ex-ploration. Information consumers prefer to use by-example exploration. If they know domain attributes (e.g., in case of Amazon or eBay electronic commerce sites), then by-facet exploration can also be considered. However, with new evolving needs for UGA, the aforementioned categorization
TABLE 2
Mapping visual variables to group characteristics Visual variablesV MappingsV(G)
Circle (Shape) Group
Size Number of members
Line Between two groups in case they are related
Line width Number of users in commonbetween a pair of groups Color intensity attribute (e.g., age, education)Value of an ordinal
Distinct colors Value of a categorical attribute (e.g., gender, occupation)
between different roles is fading away and different roles may leverage different exploration strategies.
3.2.3 Exploration alone is not enough for UGA
Exploration enables a natural dialog between analysts and user groups. Enabling interaction provides customization (i.e., better understanding of the analyst’s partial needs) and a better handling of heterogeneity [84]. When the question is not clear in the mind of the analyst, exploration is the method of choice for UGA as it enables iterative exploratory scenarios. However, there are cases where exploration alone is not enough. First, the result of exploration is not nec-essarily designed to be fully comprehensible and readable by analysts. Second, since user data is voluminous, noisy and sparse, direct interactions with it may not easily and quickly lead to insights. For instance, Mary in Use Case 3 cannot make sense of similar and dissimilar groups without visualizing them, because she cannot easily compare groups with each other.
3.3 User Group Visualization
Visualization refers to a set of approaches which enable sensemaking of user groups using visual variables [85]. It adds value to insights with the use of visual views rather than textual or tabular content [86]. The challenge in group visualization is clutteredness, i.e., numerous overlapping groups make it almost infeasible to visually make sense of groups. A visualization component consists of the fol-lowing building blocks: views, visual variables, and visual elements.
• View. A view contains one possible visual representation
of user groups. The representation may be in the from of a histogram, a pie-chart or separated clusters. In many scenarios, analysts may be provided more than one view for a set of user groups to inspect various aspects of their analysis goal.
• Visual variable. A representation is formed by one or
several visual variables (encodings), such as lines, ticks, colors and shapes. Obviously, visual variables alone do not carry any semantics. We denote visual variables as V.
• Visual element. An instantiation of a visual variable is
called a visual element. Each visual element carries a semantics. For instance, an element leverages size (i.e., a visual variable) to illustrate the number of group mem-bers. For instance in Fig. 4, user groups are illustrated using overlapping circles.
3.3.1 Visualization process
At the core of visualizing user groups sits a mapping function visualize(G ⊆ G) → V(G) which associates G’s characteristics (size, members in common, description, etc.) to visual variables, i.e., V(G) in each view. Table 2 contains common visual mappings for user groups. The visualize() function is responsible to set scales, projections, axes, leg-ends and marks [87]. A visualization approach may opt for visualizing groups with their members or as atomic concepts.
3.3.2 Types of group visualization
The literature contains very few approaches for visualizing user groups. Traditionally, this is performed directly on raw user data using off-the-shelf visualization products and
libraries such as Tableau8, Spotfire9, QlikView10, Gephi11,
D312, OpenGL13and HTML Canvas (SVG). Applied directly
on raw data, these solutions are mostly static and do not fully support sophisticated views on user groups. In the following, we review few classes of group visualization approaches as improvements to the status quo.
Graph visualization. User group visualization inherits a long history of graph visualization where nodes are either users or groups, and edges are either social links or relation between groups (e.g., common users and common actions), respectively [88], [89], [90]. Note that in case social links are not available, graph visualization is not functional.
Time-based visualization. In case user actions are time-stamped, evolution of actions and groups can be visualized. Event analytics tools such as [23], [82], [91] visualize tempo-ral actions of group members as visual trends. While such methods perform well to convey a big picture on trends, often having many heterogeneous actions with irregular times results in a cluttered and unusable view.
Location-based visualization. In case user actions are local-ized, spatial visualization of latitudes and longitudes on geographical maps can be leveraged. In [92], bike sharing activities (i.e., user actions) are grouped and visualized to understand the dynamics of station states and trip cir-culation patterns. In map visualization, groups are often mapped to circles and distinct colors are leveraged to show different attributes and actions.
Application-dependent visualization. Tailored visualization approaches are proposed for specific applications. Vi-sOHC [12] visualizes user groups and their actions in On-line Health Communities (OHC) to better administer the community and increase the engagement of its members. Visualization is also heavily used in sports analytics where players are users and their actions are visualized to obtain insights [93], [94]. Colors and color intensities are often used to show different attributes and actions of users.
8. Tableau software suite: https://www.tableau.com/ 9. Tibco Spotfire: https://spotfire.tibco.com
10. QlikView: https://www.qlik.com/us/products/qlikview 11. Gephi: The Open Graph Viz Platform: https://gephi.org 12. D3 JavaScript library: https://d3js.org
TABLE 3
Summary of DV approaches
Approach Key advantage Group viz.
Distribution-based [95], [96]
General inspection of
independent groups Only groups Facet-based [97] Focused inspection of
groups Relation-based
[98], [99], [100], [101]
General inspection of
group correlations Groups with members Time-based [102], [103] Focused inspection
with temporal facets
3.3.3 Visualization alone is not enough for UGA
Most visualizations are designed as a one-shot UGA. This impedes investigating exploratory scenarios. Even in a sin-gle view, high overlap between user groups may cause a confetti effect (i.e., overlay of visual elements representing groups). Also most visualization approaches are not inte-grated with a data processing backbone as the infrastruc-ture, hence they do not scale to real-world user datasets.
4 C
OMBININGUGA C
OMPONENTSIn this section, we review existing work where a pair of UGA components are combined to benefit from their both collective advantages. It is important to note that we do not discuss only related work specifically curated for user groups, but we also discuss work that can be transposed to manipulating user groups. The common point between all those works is in their functionality on aggregations of data (including user groups) as a first-class citizen.
4.1 Combining Discovery and Visualization
A combination of group discovery and group visualization (denoted as DV) enables visual inspection of discovered user groups. For instance, Mary in Use Case 3 visualizes various possibilities of discovered groups for a better comparison and fruitful decision making. DV is employed to increase the readability and verifiability of discovered groups. Ana-lysts inspect discoveries in visual form, and if they are not satisfied enough for their task, they rediscover by changing parameters of the optimization objective ρ. In this section, we first introduce different types of DV approaches and then review related work on readability and verifiability of discoveries.
4.1.1 Types ofDV approaches
Given a set of discovered groups G, a DV approach employs different visual elements V to highlight different character-istics of groups in G. Table 3 summarizes the DV approaches and we describe them as follows.
Distribution-based visualization. Self-Organizing Maps are employed in [95] to visualize the overall distribution of actions in discovered user groups, where the whole visual view represents one single group of interest, and actions of group members are visualized as squares. Belt charts (or Sunbursts) are used in [96] to provide a more focused view on biases in distributions (dominating attribute-values) of a single group (e.g., presence of more females in groups than
males.) In case biases are not in line with the analyst’s goals, she requests to rediscover.
Facet-based visualization. In case the analyst wants to focus on one specific facet of discovered groups, a 3D regression heatmap can be adapted to user groups to organize all groups in a 3D grid reflecting the extent of correlation between groups and the given facet [97]. Having a specific facet in mind, the method verifies the quality of regressions and ask for a potential rediscovery. However, in case a big picture needs to be visualized, this method is not functional. Relation-based visualization. In [98], [99], hierarchical relations between discovered groups are visualized to provide a big
picture of the group space. PIVOTSLICE focuses on one
single group and visualizes relations between users in that group [100]. These relations can be explicit (i.e., social links) or implicit (common actions performed by users). It also enables few manipulation operations to visually browse different relations (e.g., grouping, aligning, sorting and
fil-tering). PACKEDCIRCLEScombines the two other techniques
and enables a hierarchical visualization of groups and their members [101]. In case relations do not capture the analyst’s intuitions, rediscovery will be requested.
Time-based visualization. In case user actions are
times-tamped, WEBCANVAS can be adapted to user groups to
visualize the sequence of actions in each discovered group and facilitate verifying what happens next in groups [102]. Groups are considered as clusters and several parallel visual views illustrate clusters side-by-side. However, these paral-lel views may suffer from a confetti effect. To tackle this, a visualization approach is proposed to summarize sequences and detail them on-demand [103]. In case sequences do not reflect the analyst’s goals, a rediscovery may be requested.
4.1.2 Which DV approach to choose?
For a general inspection of discovered groups, analysts employ distribution-based and relation-based visualization methods to receive a big picture of the discovery. While the former focuses on groups as independent entities, the latter depicts their correlations as well. For a focused inspection of specific attributes, facet-based visualization is employed. In case of temporal facets, time-based visualization is the choice. However, in case the visual inspection is in the particular context of readability and verifiability, methods discussed in Sections 4.1.3 and 4.1.4 should be employed, respectively. Another dimension is the granularity of visu-alization. In case analysts want to visualize discovered groups alongside their members, relation-based and time-based visu-alizations are proposed. In case analysts want to visualize groups as an atomic concept, distribution-based and facet-based visualization should be picked.
4.1.3 UsingDV for readability
Groups are often hard to read due to the presence of many heterogeneous attributes. Traditionally, readability is addressed using scatter plots and parallel coordinates to provide a clear representation along different attributes [104], [105]. Recently, dimensionality reduction has become the method of choice to represent a clear 2D visualization of groups. The proximity in the 2D view reveals the similarity
between groups and their members. Popular dimensionality reduction methods are Principle Component Analysis, Mul-tidimensional Scaling and t-distributed Stochastic Neighbor Embedding. Most dimensionality reduction methods are distribution-based.
Principle Component Analysis (PCA). The focus of PCA is to capture variance in groups [106]. Given a group, PCA uses its covariance matrix to perform a linear transform from its attributes to two new orthogonal dimensions with the largest possible variance (aka, the Rayleigh quotient). However, the linearity of PCA dismisses the similarities between group members.
Multidimensional Scaling (MS). MS focuses on finding a matching from the |A|-dimensional space to a 2 dimensional space which preserves similarities between group mem-bers [107]. The advantage of MS over PCA is in its extended functionality to non-linear mappings. MS minimizes a stress function which captures the difference of user similarities between the original view and the 2D view.
distributed Stochastic Neighbor Embedding (SNE). While t-SNE has the same manifold nature as MS, it focuses on local structures of group members to obtain a clearer view [108]. In lieu of the stress function, t-SNE minimizes the KL-divergence between the distribution of user similarities in the original view and the 2D view to separate dissimilar members even more.
Most dimensionality reduction methods suffer from two drawbacks. First, they do not scale to real-size user data. Second, they do not incorporate time of user actions. We review dimensionality reduction improvements as follows.
Efficiency in dimensionality reduction. Visual results
should be rendered fast so that the analyst can quickly verify discovered groups in a readable format and request a rediscovery if needed. Most dimensionality reduction methods are designed for small datasets and hence are slow
on real-size user datasets [109]. CLOUDVISTA [110] is an
efficient distribution-based approach for visualizing groups as multidimensional clusters. It performs dimensionality reduction on visual frames, i.e., a subset of user data bounded to the resolution of the visualization. The size of visual frames is much smaller than the original data, hence faster to compute. Visual frames are also parallel in nature and can be easily distributed among machines following typical MapReduce approaches.
Evolution in dimensionality reduction. In [111], an
evo-lution visualization is proposed for discovered user groups (i.e., time-based visualization). The approach first discretizes time and normalizes user actions. Then it performs a PCA and returns a 2D projection for visualization. The approach in [112] goes one step further and highlights salient changes in each time bin.
4.1.4 UsingDV for verifiability
It is often tedious for analysts to find the best parameters for the discovery optimization objective ρ through several trial-and-error sessions. For instance in discovery of common actions (Section 3.1.2), a low support often leads millions of groups, and a high support leads only a few groups
(i.e., long-tail nature of group discovery [113]). Some DV approaches are proposed to assist analysts in parameter
tun-ing [114], [115]. COQUITO[114] provides a visual interface
which enables analysts to visually verify their desired pa-rameters before rediscovery. An integrated discovery engine generates few approximated results with given parameters where the analyst verifies if they make sense.
4.2 Combining Discovery and Exploration
Group discovery often generates thousands to millions of user groups. This impedes analysts to verify and compare them one by one. Even a DV approach may be too cluttered on a large space of discovered groups. Combining discovery and exploration (denoted as DE) enables an interactive verification of discovered groups. For instance, Martin in Use Case 2 doesn’t need to face all researcher groups at once, but in several iterations, where he gradually obtains his PC (Fig. 4).
A DE approach promotes a discover-explore rediscover paradigm, i.e., in each iteration, the analyst may decide to change parameters of the discovery objective ρ based on the new acquired knowledge and then request a rediscov-ery. DE has two following differences with discovery-alone (Section 3.1) and exploration-alone (Section 3.2) methods.
Feedback capturing.Each iteration in DE depends on
pre-vious iterations, which ensures that the exploration on dis-covered results is purposeful. This dependency is captured in the form of feedback, i.e., the analyst’s preferences on explored groups.
Efficiency. DEis often described in an online context, where
the analyst explores discovered groups, provides feedback, and receives new groups on-the-fly. While it is acceptable for a discovery method to run for hours offline, it is crucial for DE to have low latency between iterations [105], i.e., in sub-seconds.
In this section, first we review different formulations of feedback capturing in the literature. Then we discuss different types of DE approaches which enable an efficient feedback-based exploration on discovered groups either by focusing on user aggregations or groups. The main differ-ence between the two DE categories is in their native sup-port to consider user groups as first-class citizens. Table 4 summarizes the DE approaches.
4.2.1 Feedback formulation
An essential element of a DE approach is to let analysts provide feedback on explored results. DE then exploits this feedback in future iterations to customize the exploration and orient it towards the analyst’s interests. Feedback is the core component of interactive systems which enforces HILDA aspects to the exploration process [18], [117]. Inspired from progressive analytics [118], feedback is often associated to a time limit to bound the analyst’s waiting time in explo-ration. Time limit is usually set to 100ms to 500ms following continuity preserving latency [119]. A latency higher than 500ms has a negative impact on the analyst engagement towards the DE system.
Feedback can be seen as a score given by the analyst to all visited groups in the current iterations. These scores
TABLE 4
Summary of DE approaches
Type Approach Key advantage Feedback model Efficiency
User-based
IPM [69] Simplicity of feedback capturing and updating analyst profile Boolean Random sampling IFE [35] Convergence to a unique interestingness function Partial order Non-linear programming AIDE [116] Intuitive decision tree model for analyst profile Yes-no-maybe Local optimizations
Group-based
DICE [13] Dynamic exploration by forgetting previous choices Boolean Anticipation IUGA [18] Discovering and exploring user groups as first-class citizens Boolean Greedy algorithm OCM [36] Functionality with multiple group discovery algorithms Yes-no-maybe Greedy algorithm Cohana [32] By-query exploration functionality for data scientists Boolean SQL optimizations
will collectively build an analyst profile (i.e., an aggregation of the analyst’s interests in all exploration iterations so far) which enables DE to classify unexplored groups and identify interesting regions in user data. Feedback may be captured explicitly (i.e., the analyst professes her interest on groups) or implicitly (the system watches the analyst and derives her interests).
Explicit feedback.Following types of explicit feedback are
proposed in the literature.
Boolean. Based on closed-world assumption [120], feedback is a boolean evaluation of each explored group, e.g., like and dislike, preferred and not preferred and interesting and uninteresting [69]. Boolean feedback is often fed into a binary classifier as hard constraints to find the interestingness class of unexplored groups. Due its simplicity, boolean feedback is the most adapted model in the literature [13], [18], [69]. Yes-no-maybe. Based on open-world assumption, feedback can also be expressed as maybe interesting [116]. This feed-back is based on the intuition that no analyst has complete knowledge about what she is interested in. It is then cumber-some to limit her choices only to interesting and uninteresting. The third probable choice enables analysts to express a potential interest towards a group. DE interprets it as a soft constraint for classifying unexplored groups.
Integer score. The feedback can be an integer score from the range of a utility function, e.g., coverage, informativeness and representativeness [121], [122]. The advantage of this feedback is that a total order is captured on explored group. This order is employed to infer a global ordering over all groups. However, analysts often find it burdensome to provide a precise integer as feedback. For instance, it is not always straightforward for analysts to differentiate between a score 7 and 8 for a function with range [0 − 10].
Partial order. To alleviate the curse of total orders, partial ordering is proposed where the analyst only needs to define which group is preferred to another group [123], [124], [125].
Implicit Feedback.Unlike explicit feedback where the
an-alyst should clearly reflect her likes and dislikes, implicit feedback enables DE to capture what the analyst may miss instead of what the analyst has investigated before [126]. Following types of implicit feedback are proposed in the literature.
Gaze tracking. It is often the case that the analyst looks at some groups but simply forget to provide an explicit
feedback. It shown in [127] that gaze has a strong correlation with user attention. Gaze can be captured by tracking eye movements (aka fixations) via eye trackers (webcams and augmented reality wearables) to derive interest for groups under the gaze area [128], [129].
Mouse tracking. Gaze tracking has privacy concerns [130]. An alternative option is mouse cursor tracking. It is shown in [131] that mouse gestures (e.g., click, hover, drag and drop) have a strong correlation with user engagement. Session time. The time of investigation on a group is another indication of interest. The more the analyst focuses on a group, the more she is interested in that group [132].
4.2.2 Types ofDE approaches
We recognize two types of DE approaches in the literature: user-based and group-based. In the former, the analyst profile is built upon single users and aggregated to form interests on groups. In the latter, the analyst profile is directly cap-tured on groups. We review related works for each type and discuss their feedback model and efficiency considerations.
User-based DE. We discuss and compare the following
approaches in the user-based category.
Interactive Pattern Mining (IPM) [69] employs a boolean feedback model, where groups are implemented as frequent patterns and support transactions are interpreted as group members. At each iteration, the system asks the analyst’s feedback for k initially random groups as interesting or unin-teresting. IPM iteratively updates a scoring function so that groups in future iterations align better with the analyst’s interests. IPM forms the analyst profile based upon users. The scoring function maps each user to a non-negative real value, where higher values represent higher user interest. When the analyst shows interest on a group, the score of all its members will increase. Then an aggregation function computes a single score (called acceptance ratio) for each group as the multiplication of the members’ score. Groups with high acceptance ratio will be explored in the next iteration. IPM employs random sampling to be efficient. Interactive Feedback Exploration (IFE) [35] employs a partial ordering feedback model and groups are implemented as frequent patterns. IFE aims to predict parameters of an inter-estingness function which reflects the analyst’s interests. At each iteration, k groups are sampled from the group space. Then the analyst provides her interest on the k groups by
expressing which groups are more interesting than others. The order is captured in form of a non-linear constraint which is then employed to refine the parameters of the interestingness function which is initialized at random. The system re-ranks the set of all groups according to the up-dated interestingness function. In the next iteration, k top-ranked groups will be explored. Akin to IPM, parameters are learned based upon users and then aggregated to ob-tain group-level scores. While IFE prioritizes effectiveness than efficiency (i.e., delivering better exploration results by sacrificing the execution time), it employs a non-linear programming model which is shown to be solvable within reasonable time [133].
Automated Interactive Data Exploration (AIDE) [116] employs a yes-no-maybe feedback model. Feedbacks are exploited in an active learning context to classify users into classes of relevant and irrelevant. AIDE distinguishes itself from other similar approaches by its sophisticated sampling approach. First, analyst feedback is received on a sample as relevant, not relevant and maybe relevant. A relevant area will then be formed in the space of users around the relevant sample. New samples are picked from the boundaries of this area. Feedback on the new sample will update the boundaries of the relevant area. In AIDE, the analyst profile is modeled as a decision tree which enables the verification of the analyst’s tastes in an intuitive manner. To improve efficiency, AIDE employs local optimization tweaks in its sampling process such as avoiding the exploration of overlapping areas.
Group-based DE. We discuss and compare the following
approaches in the group-based category.
Distributed Interactive Cube Exploration (DICE) [13] employs a boolean feedback model and groups are implemented as cubes. It builds a virtual lattice of user groups and lets the analyst perform by-example explorations on a group of interest in the lattice. DICE anticipates future exploration requests by exploiting the feedback received so far. Intu-itively, if the analyst has already requested several upward explorations in the lattice (towards more general and larger groups), DICE infers that the analyst has an interest in rolling up in the user data to obtain a bigger picture. Hence groups in the upward direction will be explored first. DICE’s anticipation engine contributes to efficiency by predicting the future workload and computing it in advance.
Interactive User Group Analysis (IUGA) [18] has a native support for user groups. IUGA employs a boolean feed-back model. It maximizes a relevance function over the analyst profile. The relevance function consists of diversity (to provide different analysis directions) and similarity (to preserve the context of the analyst’s interest). Diversity is measured as the amount of overlap (i.e., common users) between groups. Similarity is measured using Jaccard func-tion. At each iteration, IUGA receives one group of interest and returns top-k relevant groups to explore. To improve efficiency, IUGA pre-computes the similarity between all pairs of groups, and exploits them in a greedy algorithm to maximize diversity.
OneClick Mining (OCM) [36] employs a yes-no-maybe feed-back model and groups are implemented as patterns. OCM performs an online learning scheme to learn features that
represent the analyst profile. At each iteration, the analyst provides feedback on each explored group as keep and delete which reflect her likes and dislikes, respectively. OCM follows closed-world assumption and mark other groups as untouched. OCM employs kept, deleted and untouched groups to update rules in the learning component. Updated rules are used to rank unseen groups by approximating their utility for further exploration. OCM is particularly designed for cases where more than one group discovery method contribute to the group space. At each iteration, the groups are sampled from the output of different methods based on a performance model built for each method using feedbacks. To improve efficiency, OCM employs a greedy approach for ranking groups at each iteration.
Cohort Query Processing (Cohana) [32] employs a boolean feedback model. It builds a cohort in the context of retention
analysis14and lets analysts perform by-query explorations.
Cohana limits the feedback to three following primitives which constitute a retention cohort: birth selection (i.e., when a cohort has been initiated), age selection (i.e., recency of a cohort) and cohort aggregate. A feedback on one of those primitives will return other cohorts with an updated value
for that primitive.15 Cohana identifies a unique SQL query
for each cohort and performs some SQL optimizations to im-prove efficiency. Examples are data chunking (i.e. clustering users based on common birth time), RLE data compression (i.e., scanning less users) and two-level global dictionary encoding (i.e., skipping irrelevant users and groups).
4.2.3 Which DE approach to choose?
IPM is the method of choice for its simplicity of feedback capturing (using a boolean model) and updating the analyst feedback. In case convergence matters, learning-based meth-ods are recommended (IFE, AIDE and OCM) to converge on one unique interestingness function. AIDE’s particular interest is in its intuitive decision tree model for the ana-lyst profile. OCM’s particular interest is in its functionality with multiple discovery algorithms. While unlearning is a challenge for learning-based methods (as they accumu-late analyst feedback in all iterations), local optimization approaches such as DICE, IUGA and Cohana can forget previous choices and enable a more dynamic exploration. Cohana and its by-query exploration mechanism appeals more interesting to data scientists while two others are example-based and can be easily picked by domain experts and information consumers.
4.3 Combining Exploration and Visualization
Traditionally, visualization methods are designed as one-shot and incapable of handling exploratory scenarios. Com-bining exploration and visualization (denoted as EV) en-ables interactive visualizations for user groups, aka visual analytics [142]. While DV approaches provide a big picture of groups, EV enables a visual navigation in the group space. EV finds its roots in the visual information seeking mantra of Ben Shneiderman, i.e., overview first, zoom and filter, details on demand [143].
14. Retention https://mixpanel.com/retention/
15. A demo presentation of retention exploration is presented at https:// youtu.be/XjPBynfUR8s
TABLE 5
Summary of EV approaches
Type Approach Key advantage Clear visualization
Exploration-based
Zenvisage [134] By-query exploration functionality for data scientists Restricted schema Data Tweening [135] Tracking exploration transitions Restricted mappings Vexus [136] Exploring and visualizing user groups as first-class citizens Few groups
FlashView [137] Intuitive fast visual exploration Sampling
ConVis [138] By-facet exploration functionality for domain experts Topic models
Visualization-based
Scented Widgets [139], [140] Enabling wiser decision making in exploration Limited attributes TextTile [76] Exploration with OLAP-style operations Summarization
PTC [141] Focusing on user actions Layout & word-sizing
Visualization Grammar [87] Formalizing visual interactions Customizability
Exploration and visualization aim for different goals. The goal of exploration is to guide analysts in the pro-cess of finding insights. The goal of visualization is to provide sensemaking for insights. These two components do not necessarily accompany each other at all times. For instance, NetLens [10] is a visualization-only approach, and IUGA [18] is an exploration-only approach. EV comple-ments both exploration-alone and visualization-alone meth-ods. Exploration-alone methods (Section 3.2) require a visu-alization layer to offer an intuitive visual interaction with analysts. Visualization-alone methods (Section 3.3) require exploration mechanisms to enable interactivity. Moreover,
EV has two following differences with exploration-alone
and visualization-alone methods.
Clear view. At each iteration of an EV approach, it is
crucial to obtain a clear visualization of user groups with no confetti. Otherwise, the analyst is not able to provide proper feedback to proceed the exploration. It is shown in [4] that analysts are more comfortable in making decisions with less cluttered set of results.
Efficiency.Each iteration of an EV approach should be fast
to preserve the train of thoughts of the analyst. This is extremely challenging due to the typical latency associated with visualization approaches.
In this section, we review different types of EV ap-proaches and describe how they enable a visual exploration of groups by providing a clear visualization (Section 4.3.1), and then we discuss strategies to boost the efficiency of EV approaches (Section 4.3.3).
4.3.1 Types ofEV approaches
We recognize two different types of EV approaches, exploration-based and visualization-based. In the former, a visu-alization approach is built on top of an existing exploration method. In the latter, an exploration mechanism is injected to an existing visualization method. Table 5 summarizes the
EVapproaches.
Exploration-based EV. The expressive power of
visual-ization methods can be added to an existing exploration approach to enable visual inspection of explored groups and provide immediate insights. Visualized groups facili-tate expressing partial needs for analysts, be it in form of query, facet, distribution, example, or evolution [134], [144].
We discuss and compare the following approaches in the exploration-based category.
Zenvisage. In [134], analysts interact with a visualization view using by-query exploration. Inspired from previous visualization query languages [145], [146], analyst’s needs are expressed in terms of a SQL-like language called ZQL (Zenvisage Query Language). ZQL operates on top of a visual algebra which defines the logic behind the mapping function between user groups and visual variables. By defin-ing a restrictive yet expressive schema for ZQL, Zenvisage guarantees that the visualizations are clear.
Data Tweening. In [135], a visualization view enables analysts to retain changes in exploration. It is often unclear for an-alysts how the exploration transitions from one iteration to another. Data Tweening visualizes additions, withdrawals and replacements of groups from one iteration to another, in an animated form. Data Tweening functions on a catalog of mapping functions, such as order, rotate, nest using which it visualizes the changes. The small size of the mapping catalog guarantees that the resulting visualization is clear. Vexus. In [136], a visualization framework is proposed to provide native support for exploring user groups. The framework enables analysts to perform by-example explo-rations and observe results visually. The visualization helps analysts to have a better understanding of the explored groups and to observe more details about them. Analysts can seek to achieve either a single group in its entirety (e.g., finding an audience group for targeted advertisement), or identify several users of interest while exploring user groups (e.g., forming a conference PC). To prevent clutter, Vexus opts for visualizing only k diverse groups at each exploration iteration.
FlashView. In [137], a visualization interface is proposed for fast exploration of user groups. While there is often an offline pre-processing step for both visualization and exploration to prepare online execution, FlashView enables quick visual inspection of groups without pre-processing. FlashView employs approximate query processing (AQP) techniques to return the best possible exploration options without latency. The system builds some indexes on-the-go to deliver better results in future iterations. A clear visualization is guaranteed by sampling results.
ConVis. In [138], a visual by-facet exploration is proposed to analyze user commenting actions in social networks. The analyst can request a facet (e.g., hgender, femalei) to explore and visualize the sentiments of their comments. To reduce visual clutter, topic models are mined and visualized instead of comment’s raw texts.
Visualization-based EV.The exploration layer added to an
existing visualization method is often referred to as the guid-ance layer whose aim is to add directions to visual variables and ease group navigation. We discuss and compare the following approaches in the visualization-based category. Scented Widgets. In [139], [140], an approximated distribution is visualized on top of each exploration option (in our case, group) to provide a sense of how results will look like in the next iteration. It guides analysts to make a wiser decision through their navigation. A clean view is guaranteed at each exploration iteration by limiting the number of investigated attributes in the visualization.
TextTile. In [76], the expressive power of OLAP-style explo-ration opeexplo-rations is added to visualization. TextTile imple-ments groups as data cubes. In other words, TextTile enables a visualization-based OLAP. TextTile tailors a specific sum-marization layer for the OLAP operations which results in a clear and uncluttered visualization.
Parallel Tag Clouds (PTC). Word cloud is a visualization technique to represent the importance of a set of words using visual elements such as size and color [147]. In [141], a visual by-facet exploration approach is proposed to com-pare group actions together using word clouds (where each action is considered as a word). Each facet is visualized on one parallel coordinate. Then, user actions associated to that facet is visualized in form of word cloud. PTC considers both layout and word-sizing techniques to provide a clear visualization.
Visualization Grammar. There is a recent trend whose effort is to associate exploration methods to visual grammars [87], [148], [149]. Visual grammars facilitate creating, saving, and sharing visual analytics. Vega is among the most popular visual grammars in the literature [87]. Signals in Vega are capable of triggering exploration operations using JSON-like formalizations. Signals are dynamic variables that pa-rameterize a visual element (e.g., a circle representing a
group) for interactive behavior.16 Also in [149], a grammar
is introduced to build rules out of analysts’ interactions and determine common visual patterns. Those rules are then em-ployed to anticipate future visualization requests on groups. Full customizability of visual grammars enables analysts to operate on clear visualizations for their exploration tasks.
4.3.2 Which EV approach to choose?
A data scientist may be interested to employ Zenvisage and TextTile to have an exploration-wise control on the EV approach. She may also choose Visual Grammars to have the same control visualization-wise. With these methods, she can easily grasp intuitions behind exploration-visualization transforms and understand insights. She may want to have
16. VEGA documentation on signals: https://vega.github.io/vega/docs/ signals/
a more focused visual exploration. She focuses on group actions with PTC, on group changes with Data Tweening, and on transitions with Scented Widgets. However, in case simplicity has a priority, Vexus, FlashView and ConVis are the methods of choice. While FlashView builds visual ex-plorations very fast, Vexus builds visualizations tailored for user groups. Also ConVis provides a by-facet exploration functionality which is preferred by domain experts.
4.3.3 BoostingEV approaches
To improve EV latencies, different indexing and sampling techniques are proposed in the literature. While we review the literature on boosting techniques for EV, it is important to notice that no efficiency improvement technique is specif-ically designed for group-based operations on user data.
Indexing. An index can be constructed on groups, their
members and actions. Indexes enable quick retrieval of groups for fluid explorations and fast visualizations. Fol-lowing index structures can be applied to an EV approach. Nanocubes. In [150], [151] a cube-based indexing mechanism is proposed. By creating shared links between user at-tributes, Nanocubes renders visualizations faster than a typ-ical screen refresh rate. The index is a trade-off between two state-of-the-art indexing mechanisms, i.e., Datavore [152] and ImMens [153]. The former is extremely fast but con-sumes lots of memory for its index structure. The latter optimizes memory usage at the price of slight latencies. Nanocubes is as efficient as ImMens while consuming less memory.
Cubrick. In [39], an in-memory DBMS is proposed to serve group-based operations as first-class citizens. Each group in Cubrick is called a brick. Common OLAP-style exploration operations can be performed quickly on bricks. Cubrick employs a row-major function to explore groups and uses a hashing map for a fast retrieval.
GraphVizDB. In [154], large graphs are indexed where nodes are users and edges are social links. GraphVizDB divides the whole graph into distinct regions (i.e., a set of groups) with respect to a Euclidean plane. Ideally, there is no overlap between regions and there are as few social links as possible between regions. Then a number of abstraction layers are constructed for each region. Once a group is requested by an EV approach, the index enables fast retrieval of groups thanks to the abstraction layers.
Sampling. Exploring and visualizing fewer groups
im-proves the latency of EV approaches. Typically, random sampling considers equal probability for all groups to be explored. Smarter sampling mechanisms may be employed, such as uniform (i.e., pick random samples among data intervals, e.g., age categories) [155] and stratified (i.e., pick random samples from data clusters, e.g., different commu-nities of user data) [13].
5 A
LL-
IN-O
NEUGA
User group discovery, exploration and visualization ad-dress different aspects of UGA, separately or collectively. To benefit from their collective advantages, it is ideal to build an all-in-one UGA system (denoted DEV) where all