DOE/ID-01570-4 THE CHEMICAL KINETICS OF THE
REACTIONS OF LITHIUM WITH STEAM-AIR MIXTURES D.S. Barnett and M.S. Kazimi
April 1989
Plasma Fusion Center and the
Department of Nuclear Engineering Massachusetts Institute of Technology
Cambridge, MA 02139 U.S.A.
*This work was supported by EG&G Idaho, Inc. and the U.S. Department of Energy, Idaho Operations Office
under DOE Contract No. DE-AC07-761ID01570
Reproduction, translation, publication, use and disposal in whole or in part, by or for the United States
government is permitted PFC/RR-89-3
THE CHEMICAL KINETICS OF THE REACTIONS OF LITHIUM WITH STEAM-AIR MIXTURES
by
D.S. Barnett and M.S. Kazimi ABSTRACT
This work involved the experimental and analytical determination of the consequences of lithium fires in the presence of steam. Experiments were performed to characterize the chemical reactions of lithium with steam-nitrogen and steam-air mixtures. Models were introduced in the LITFIRE code to describe lithium fires in the presence of steam inside the containment building and plasma chamber of a hypothetical fusion reactor. The code was also equipped with the capability to determine the effects of decay heat and lithium fires on the temperature response of the reactor first wall in the event of a coolant disturbance.
Forty-two kinetics experiments were performed in which a stream of steam-nitrogen or steam-air was passed over and reacted with approximately three grams of lithium heated to a predetermined temperature. The lithium reaction rates with the constituent gases were measured and characterized for a wide range of lithium temperatures and gas compositions. Experiments were performed with steam molar concentrations of 5, 15 and 30% and lithium temperatures ranging from 400 to 11000 C, inclusive.
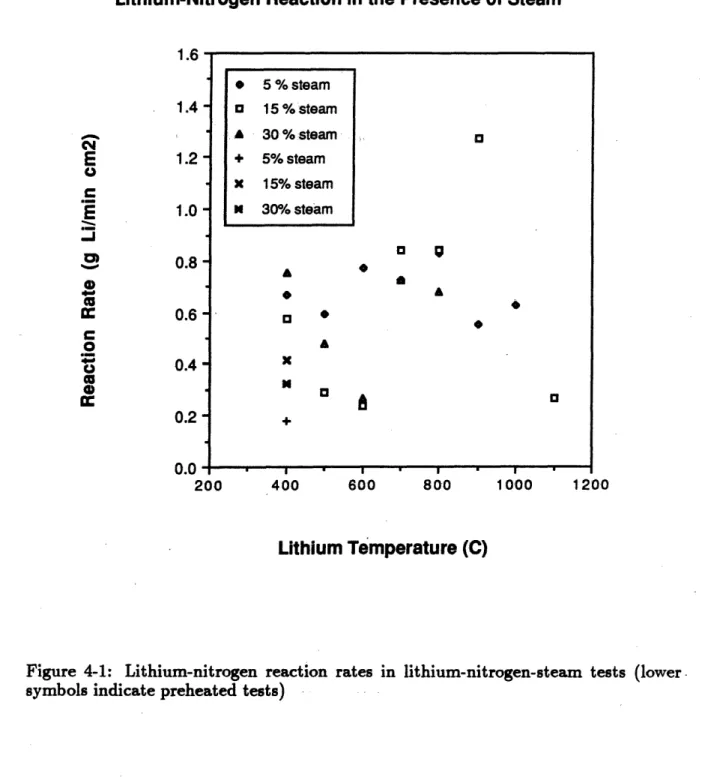
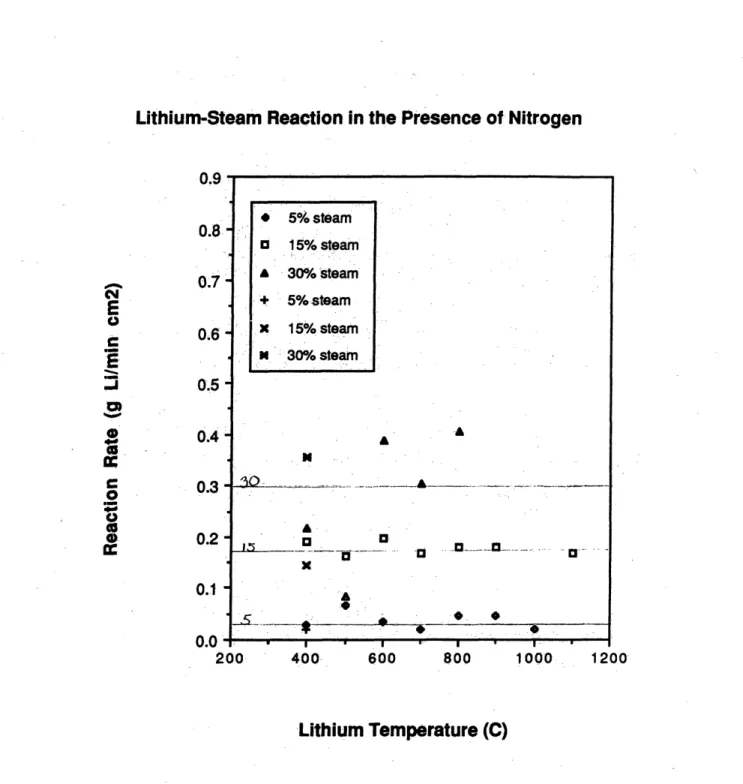
The results of the kinetics experiments showed that the steam served to catalyze the lithium-nitrogen reaction at temperatures under 7000 C. The catalytic effect was observed to decrease exponentially as a function of the lithium temperature until it vanished above 700* C. The catalytic effect was greater in the steam-air experiments than in the steam-nitrogen experiments. The lithium-steam reaction rates were observed to be independent of the lithium temperature but they were reduced by the presence of oxygen in air. If nitrogen was used as a reactor cover gas it would have to be kept dry, as a lithium-nitrogen fire in the presence of steam could burn more fiercely than was previously thought.
The LITFIRE code was modified to enable it to model the interactions of lithium with steam-air atmospheres. The results of the reaction kinetics experiments were used in the reaction model, and the heat. transfer model was expanded to allow it to handle condensible atmospheres. Three groups of accidents were investigated: a spill on the containment building floor, a spill inside the reactor plasma chamber, and a spill inside the plasma chamber with steam injection to the containment building simulating a steam line break. The results were compared to dry air cases under the same conditions. The results of all three groups showed that the most important effect of the presence of water vapor was the increased heat transfer to the cell gases, prinmarily due to the higher gas thermal emissivity. In the containment building fire, where the lithium pool was relatively insulated, the measured emissivity served to increase the gas temperature and pressure with little effect on the pool or combustion zone. The maximum predicted pool and combustion zone temperatures were 1000* C and 1250* C, respectively. In the plasma chamber fires, the lithium pool was cooled indirectly by the containment building atmosphere and the maximum pool and combustion zone temperatures were found to be 650 and 8500 C. The gas temperature and pressure were changed only slightly while the structural temperatures were reduced below those of the dry air cases. Significant concentrations of hydrogen were also predicted to occur in the plasma chamber.
Models of the heat transfer pathways and decay heat generation in the blanket and shield structures of a tokamak were added to LITFIRE. Calculations for a typical reactor indicated that the sinultaneous occurrence of a lithium fire and a loss of flow accident would raise the maximum temperature of the first wall from
650* C due to decay heat alone to 875* C. The addition of a fire to a loss of coolant accident would raise the maximum first wall temperature from 1000 to
ACKNOWLEDGMENT
This report is based on the thesis submitted by the first author in partial fulfillment of the requirements for a Ph.D. in Nuclear Engineering at MIT. The authors would like to thank Ernesto Cabello for his assistance with the lithium-steam kinetics experiments.
Contents
Abstract Acknowledgments Table of Contents List of Figures List of Tables 1 Introduction 1.1 Motivation ... . . ... 1.2 Previous Work ... 1.3 This Work ...2 Review of Previous Lithium Fire Experiments 2.1 HEDL Pool Fire Experiments ...
2.2 MIT Kinetics Experiments . . . ... . . . 2.2.1 Lithium-Nitrogen Tests . ...
2.2.2 Lithium-Nitrogen-Oxygen Tests... 2.3 JRC-Ispra Kinetics Experiments . . . . 2.4 Summary and Comparison . . . .
3 Apparatus and Procedures for the Steam Experiments
2 4 5 9 13 16 16 18 21 24 24 33 34 37 47 51 57
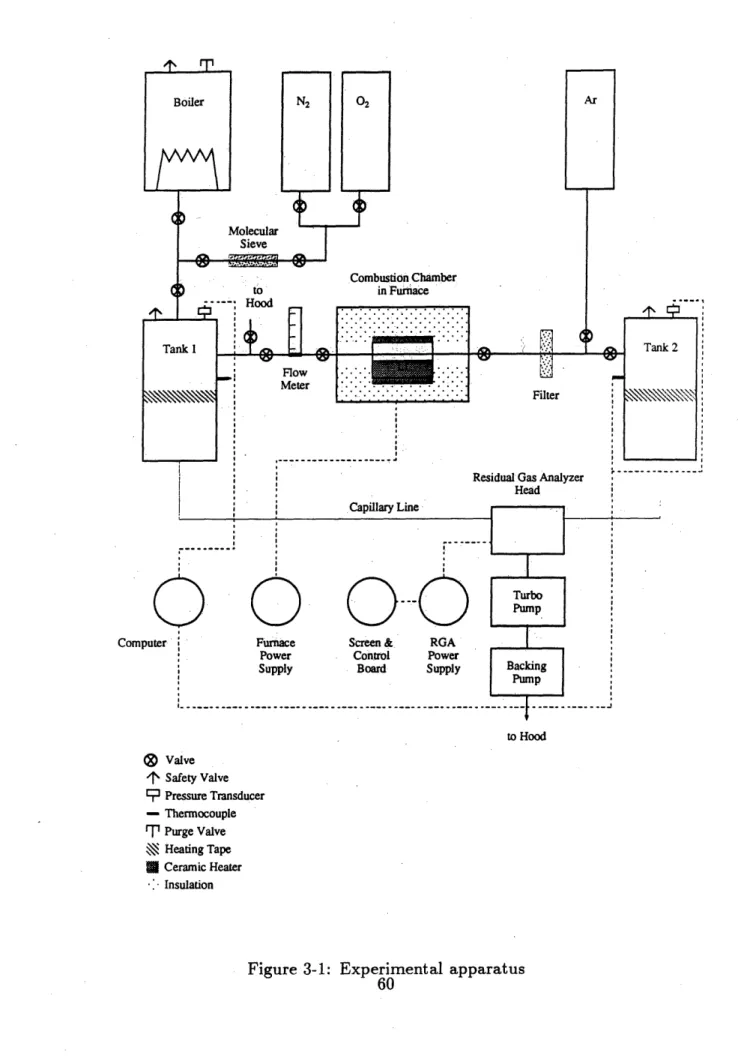
3.1 Apparatus . . . . . . . . . . . . 59
3.1.1 Gas Preparation and Collection Systems . . . .. .. ... 59
3.1.2 Furnace and Combustion Chamber . . . ... . . 62
3.1.3 Other Components . . . . 63
3.2 Procedures . . . ... . . . ... . 65
3.2.1 Test Preparation . . . . . . . . 65
3.2.2 Test Execution . . . ... . . . . 67
3.2.3 Post-Test Procedures . . . . . . . . .. . . . 68
4 Results and Data Analysis 70 4.1 Results and Observations . . . .. . . o. . . . 70
4.1.1 Reaction Rates as a Function of Lithium Temperature and Gas Composition . . . .. . . . .. 70
4.1.1.1 Lithium-Nitrogen Experiments . . . ... . . 72
4.1.1.2 Lithium-Air Experiments . . . ... . . . . 75
4.1.2 Reaction Products and Observations . . . . 75
4.1.3 Difficulties and Experimental Error . . . . 80
4.1.3.1 Experimental Difficulties . . . . 80
4.1.3.2 Experimental Error . . . . 84
4.2 Data Analysis . . . . ... . . . .. . . . .. . . . . 92
4.2.1 Steam Effects on Lithium-Nitrogen Reaction Kinetics . . . . . 92
4.2.2 Steam Effects on Lithium-Air Reaction Kinetics . . . . 95
4.2.3 Steam and Oxygen Reaction Kinetics . . . . 98
5 The LITFIRE Code 103 5.1 Introduction . . . 103
5.2 Basic LITFIRE . . . .. . . .. . .. . . . . 104
5.2.1 Preliminary Calculations . . . 108
5.2.2.1 Radiative Heat Transfer . . . .1
5.2.2.2 Natural Convection Heat Transfer . . . . 110
5.2.2.3 Conductive Heat Transfer . . . . 111
5.2.2.4 Temperature Rates of Change . . . . 113
5.2.3 Lithium Combustion . . . . 114
5.2.4 Containment Overpressure and Leakage . . . . 117
5.3 Modeling Options . . . .... 117
5.3.1 Two Cell Option . . . . . . . . 118
5.3.2 Pan Option . . . . 119
5.3.3 Lithium-Concrete Reaction . . . . 119
5.3.4 Lithium-Lead Combustion . . . . 124
5.3.4.1 Turbulent Pool Model . . . . 125
5.3.4.2 Layered Pool Model . . . . 126
5.3.5 Mitigation Options . . . . 127
6 Modeling Lithium Fires in the Presence of Steam 129 6.1 Introduction . . . . 129
6.2 LITFIRE Modifications . . . .. ... 130
6.2.1 Water Pools ... 130
6.2.2 Iterative Energy Balance . . . . 134
6.2.3 Heat Transfer between Structures and the Cell Gas . . . . 135
6.2.4 Modification of Cell Gas Emissivity . . . . 136
6.2.5 Humidity and Steam Injection . . . . 138
6.2.6 Reaction Kinetics and Experimental Verification . . . . 139
6.2.6.1 The LPS-1 Test . . . . 140
6.2.6.2 The LAM-2 Test . . . . . 150
6.3 Consequences of Lithium Fires in Steam-Air Atmospheres . . . . 151'
6.3.1 Initial Conditions . . . . 151
6.3.2 Results of the First Group . . . . 154
6.3.3 Results of the Second Group . ... ... 165 6.3.4 Results of the Third Group . . . . 172 6.4 Conclusions . . . .. . . . .. . . . . 175 7 Modeling Lithium Fires in the Plasma Chamber in the Presence of
Decay Heat 180
7.1 Development of the Torus Fire Model ... ... 181 7.1.1 Heat Transfer. . . . .. . .
7.1.2 Decay Heat Generation . . . . 7.2 Consequences of a Lithium Fire inside the Plasma
7.2.1 Initial Conditions . . . . .... 7.2.2 Results.. . . . .. . . . . . . . . .
7.2.2.1 Loss of Flow Accident . . . . 7.2.2.2 Loss of Coolant Accident . . . .
Chamber 181 188 190 190 193 193 198 203 203 204 204 205 207 209 209 211 214 214 215 215 216 8 Conclusions and Recommendations for Future Work
8.1 Conclusions... ... ... ... 8.1.1 Impact of Steam on Lithium Fires...
8.1.1.1 Experiments... 8.1.1.2 Analysis...
8.1.2 Impact of Decay Heat on Lithium Fires...
8.2 Recommendations for Future Work . . . . 8.2.1 Lithium Reaction Kinetics.. . . . . 8.2.2 Lithium Fire Modeling and the LITFIRE Code . ..
A Calculations Used by LITFIRE in Modeling Lithium Fires A.1 Emissivity of the Lithium Pool... . . . . A.2 Heat and Mass Transfer Coefficients .. ...
A.2.1 Gas Natural Convection...
A.2.3 Lithium Pool-Combustion Zone Conduction ... 218
A.3 Lithium Reaction Kinetics Calculations ... 220
A.4 Gas Transfer Between the Primary and Secondary Cells ... 221
A.5 Lithium-Concrete Reaction . . . 223
A.6 Lithium Diffusion Through Lead . . . 224
A.7 Integrals . . . 224
B LITFIRE Program Description 225 B.1 Initial Routine ... 225
B.1.1 Reading and Writing of Input Data ... 226
B.1.2 Variable Initialization ... 226
B.1.3 Spray Fire Calculation . . . 226
B.2 Dynamic Cycle . . . 226
B.2.1 Termination Checks . . . 228
B.2.2 Time Step Control . . . 228
B.2.3 Writing the Data to Output Files . . . 229
B.2.4 Error Pointers ... 229
C Recalibration of the LITFIRE Code 230 0.1 The LA-5 Test ... 231
C.2 The LN-2 Test ... ... 231
0.3 Input Data Used for the Recalibration ... 239
D Experimental Data 241
List of Figures
2-1 HEDL lithium fire test cell .. ... . . . . .. 26
2-2 HEDL lithium reaction pan ... 27
2-3 Tillack's estimated lithium-nitrogen reaction rate curves . . . . 35
2-4 Ijams' experimental apparatus . .. . . . ... . . . . 36
2-5 Ijams' lithium-nitrogen reaction rates . . . . 38
2-6 Gil's experimental apparatus ... . . . . . . . . 40
2-7 Gil's combustion chamber ... . . . . 41
2-8 Li reaction rates from 80% N2-20% 02 experiments . . . .. 44
2-9 Li reaction rates from 90% N2-10% 02 experiments . . . .. . . . 44
2-10 Li reaction rates from 95% N2-5% 02 experiments . . . . 44
2-11 Li-N reaction rates from pure and mixed gas (02) experiments . . . 45
2-12 Li-O reaction rates from mixed gas (N2) experiments . . . . 45
2-13 Lithium-nitrogen inhibition factor . . . ... 46
2-14 Effects of LisN layer on reaction rates . . . . 48
2-15 JRC-Ispra experimental apparatus . . . . 50
2-16 JRC-Ispra Li-steam reaction rates . . . .. . . . 52
3-1 Experimental apparatus . . . . 60
3-2 Second combustion chamber design . . . .. 64
4-1 Lithium-nitrogen reaction rates in lithium-nitrogen-steam tests . 73 4-2 Lithium-steam reaction rates in lithium-nitrogen-steam tests . . ... 74
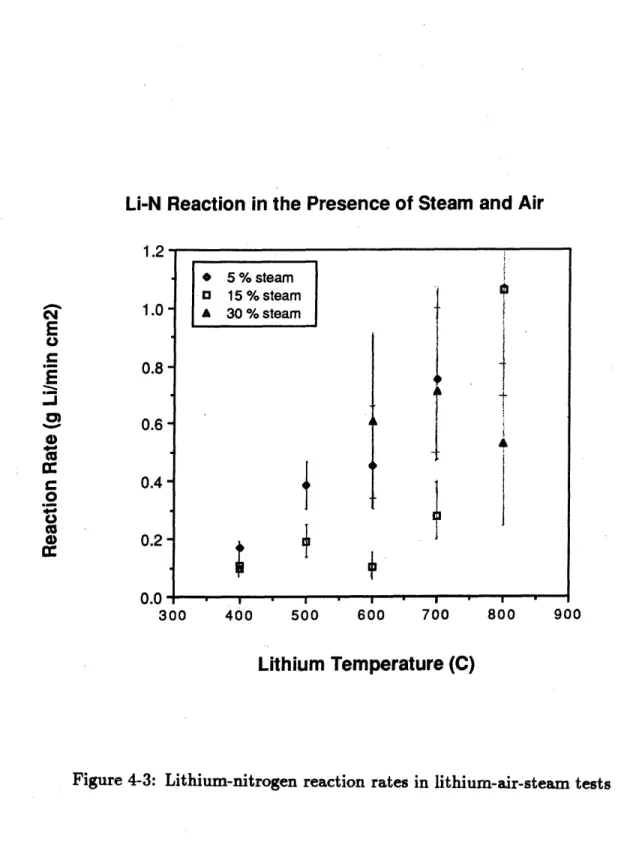
4-3 Lithium-nitrogen reaction rates in lithium-air-steam tests . . . . 76
4-4 Lithium-steam reaction rates in lithium-air-steam tests . . . . 77
4-5 Lithium-oxygen reaction rates in lithium-air-steam tests .... 78
4-6 Lithium-gas reaction rates in lithium-10% oxygen-90% nitrogen-steam tests . . . .. . . 79
4-7 Lithium-nitrogen reaction rate catalytic factor in steam . . . . 94
4-8 Lithium-nitrogen reaction rate catalytic factor of steam in air . . . . 96
4-9 Li-steam reaction rates in the presence of nitrogen and oxygen, at 15% steam concentration . . . 101
5-1 LITFIRE one cell case . . . . 106
5-2 Mass flow in one cell LITFIRE . . . .. . . . . 107
5-3 LITFIRE two cell option . . . . 120
5-4 Mass flow in LITFIRE two cell option . . . . 121
5-5 LITFIRE pan option . . . .. . . . 122
6-1 Energy flow in modified two-cell LITFIRE . . . . 131
6-2 Mass flow in modified two-cell LITFIRE . . . ..132
6-3 Test LPS-1 combustion zone temperature . . . . 141
6-4 Test LPS-1 lithium pool temperature . . . . 142
6-5 Test LPS-1 hydrogen gas molar concentration . . . . 143
6-6 Test LPS-1 cell gas temperature . . . . 144
6-7 Test LPS-1 cell wall temperature . . . .. . . . 145
6-8 Test LAM-2 combustion zone temperature . . . . 146
6-9 Test LAM-2 lithium pool temperature . . . . 147
6-10 Test LAM-2 cell gas temperature . . . . 148
6-11 Test LAM-2 cell wall temperature . . . . 149
6-12 One-cell LITFIRE with steam option . . . . 152
6-13 Combustion zone temperature versus time, one cell geometry . . . . . 157
6-14 Lithium pool temperature versus time, one cell geometry . . . .. 158
6-15 Cell gas temperature versus time, one cell geometry . . . . 159
6-16 Cell gas pressure versus time, one cell geometry . . .. . . ... 161
6-17 Containment wall temperature versus time, one cell geometry . . . . 162
6-18 Containment floor temperature versus time, one cell geometry . . . 163
6-19 Containment molar fraction of hydrogen gas . . . . 164
6-20 Combustion zone temperature versus time, two cell geometry . . . . . 166
6-21 Lithium pool temperature versus time, two cell geometry . . . . 167
6-22 Primary cell gas temperature versus time, two cell geometry . . . . . 169
6-23 Primary cell wall temperature versus time, two cell geometry . . . . . 171
6-24 Primary cell gas pressure versus time, two cell geometry . . . . 173
6-25 Lithium pool temperature versus time, two cell geometry with steam injection to the secondary cell . . . 174
6-26 Primary cell wall temperature versus time, two cell geometry with steam injection to the secondary cell . . . ... 176
6-27 Primary cell gas pressure versus time, two cell geometry with steam injection to the secondary cell . . . .. . . 177
6-28 Hydrogen accumulation history for a torus fire . . . . 178
7-1 Torus fire model blanket regions . . . . 182
7-2 Energy flow in the LITFIRE torus fire option . . . . . . . . 186
7-3 Results of the LOFA/torus fire calculations . . . . 195
7-4 Results of the LOCA/torus fire calculations . . . 196
7-5 Results of the LOCA/torus fire calculation without decay heat . . . . 201
C-1 LA-5 lithium pool temperature . . . . ... . . . . 232
C-2 LA-5 cell gas temperature . . . 233
C-3 LA-5 cell wall temperature . . ... . . . 234
C-5 LN-2 lithium pool temperature ... 236 C-6 LN-2 cell gas temperature . . . . 237 C-7 LN-2 cell wall temperature . . . . 238
List of Tables
1.1 Reactions of lithium with various materials in the containment
atmo-sphere and concrete . ... . . . 19
2.1 HEDL lithium pool fire test summary . . . ... . . . . 29
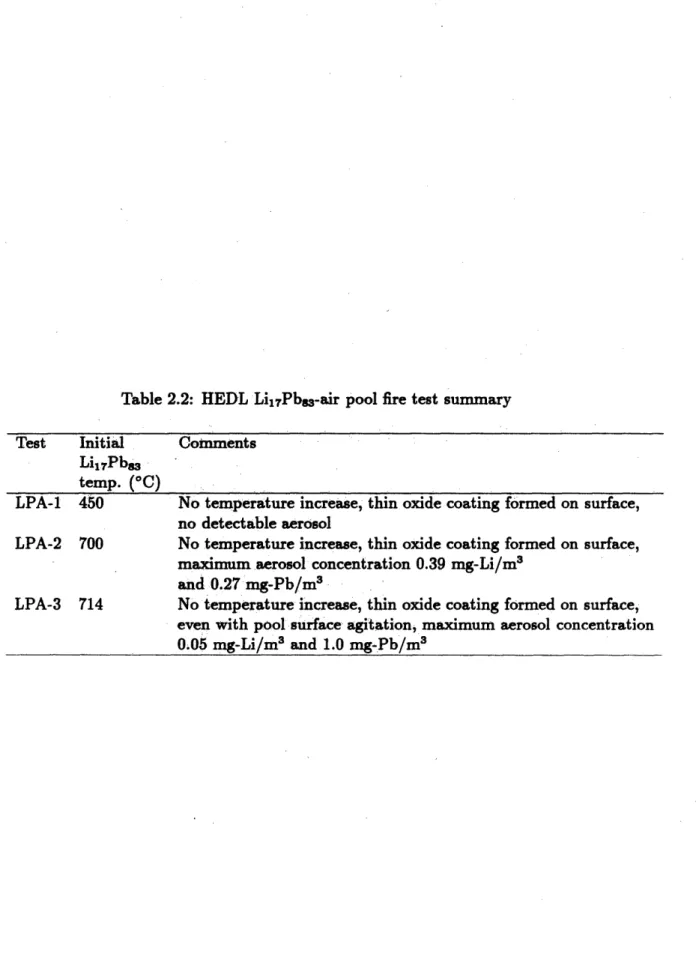
2.2 HEDL Li17Pb8 3-air pool fire test summary . . . .. 30
2.3 HEDL test reaction product summary . . . . 31
2.4 JRC-Ispra test matrix . . . ... . . . . 49
2.5 Lithium fire test summary and comparison . . . . 53
4.1 Lithium test matrix . . . ... 71
4.2 Sources of experimental error ... . . . ... . 85
4.3 Lithium-steam reaction rates as a function of steam concentration . 99 4.4 Lithium-oxygen reaction rates in the presence of steam as a function of oxygen concentration ... . . . 102
5.1 Chronology of the development of LITFIRE . . . 105
5.2 Typical values for the heat transfer correlation coefficient C . . . . . 112
6.1 Containment geometry and initial conditions, first group of calculations 153 6.2 Inner cell geometry and initial conditions, second group of calculations 155 7.1 Torus fire model blanket nodes and regions . . . 183
7.2 Reactor geometry, torus fire analysis . . . 191
7.4 Initial conditions for the torus fire analyses . . . .
A.1 Water pool heat transfer correlation coefficients . . . . .
C.1 Input data used in recalibration of LITFIRE . . . .
. . . . 194
. . . . 217
. . . . 240
D.1 Lithium reaction rates of the steam-nitrogen experiments . . . . 242
D.2 Lithium reaction rates of the steam-air experiments . . . . 243
D.3 Lithium reaction rates of the steam-nitrogen-oxygen experiments . . . 244
Chapter 1
1.1
Motivation
Nuclear fusion has the potential to be a safe, limitless source of energy, fulfilling much of the world's energy need in the future. With plentiful inexpensive fuel sup-plies, even first generation reactors employing deuterium and tritium as fuel could make a considerable contribution to solving the energy problem without the negative environmental impact associated with fossil fuels and the safety concerns over nuclear fission. In order to realize its potential, however, fusion must learn from and avoid
the mistakes of the past.
The experience of the nuclear industry can serve as a lesson for fusion. In the early days of nuclear power, it was described as being perfectly clean, absolutely safe and "too cheap to meter". In the thirty years since the first commercial nuclear power plant came on line, it has been seen that while nuclear power has certainly been cleaner than fossil fuel power-it doesn't spew carbon dioxide or noxious gases into the atmosphere-the nuclear waste issue has emerged as a difficult political, if not technical, problem in this country. The safety of nuclear power both with regard to the public and the financial well-being of the utility has come into question with the accidents at Three Mile Island and Chernobyl resulting in the total loss of the
reactors in both cases and fatalities among personnel responding to the emergency at Chernobyl. The cost of electricity from fission has increased over the years as more reactor safety systems have been required (with some having been added after the plants were built) and the time and cost of plant construction have gone up. This is not to say that nuclear fission should not be utilized as a significant source of energy, but rather that fusion should strive to avoid the pitfalls that have beset the nuclear industry.
One of the central aspects in which fusion can profit from past fission experience is the aspect of safety-safety of the public, safety of the environment and safety of the investment. The safety of fusion reactors will be crucial to their gaining and maintaining public and investor confidence. Since fusion will be a new technology, both the public and the investor will be wary of embracing it as the solution to the energy problem unless they perceive the risk from using it to be low. By emphasizing safety from the beginning risk can be minimized. Potential accidents can be antic-ipated and prevented or mitigated. Necessary safety features can be incorporated into plant designs before they are built, resulting in considerable savings in cost. The reduction of both risk and cost makes it quite beneficial to consider safety. early on in the development of fusion energy.
As stated earlier, the first generation of fusion reactors would most likely use deu-terium and tritium as fuel due to their higher reactivity. Other fusion fuel cycles such as catalyzed deuterium or deuterium-helium-3 are more difficult to operate although they may be used farther in the future. Since tritium occurs naturally only in trace amounts, it must be bred in order to fuel the reactors. The easiest way to breed tritium is to bombard lithium with neutrons from the fusion reaction:
Li + n -+ He +3 T + 4.78 MeV (1.1) "Li + n -+ He +3 T + n - 2.47 MeV (1.2) the neutron capture reactions will result in the production of tritium and, with
lithium-7, a neutron. The tritium must then be extracted from the lithium in the blanket around the plasma chamber for use as fuel in the reactor.
The lithium may exist within the reactor blanket in a variety of forms: pure liquid lithium, liquid lithium-lead eutectic, or solid compounds of lithium such as Li2O or LiAlO2. Liquid lithium is advantageous to use in that it can also serve as
the coolant of the reactor, simplifying blanket design and allowing the reactor to take advantage of lithium's superior coolant and tritium breeding properties. Other forms of breeder do not have such options available to them. One of the significant
drawbacks to using liquid lithium, in addition to the MHD pressure drop associated with pumping a liquid metal across a magnetic field, is its property of reacting easily and exothermically with oxygen, nitrogen, water vapor and carbon dioxide in the atmosphere and various compounds in concrete. The reactions of interest and the energy released by them are shown in Table 1.1 below:[1]
In the event of a large lithium spill the lithium would catch fire and burn until it or the atmospheric gas supply was totally consumed. Such a fire could cause considerable damage to the reactor and the containment building through both the direct heat of the fire and containment overpressurization. The total amount of potential chemical energy contained in the lithium present in a commercial sized reactor using lithium as a coolant would be on the order of 10' kJ[2].
1.2
Previous Work
Because of the potential for a severe accident to result from the employment of liquid lithium as a breeder/coolant, much work has been done to characterize the lithium reactions experimentally and to use computer modeling to predict the consequences of large lithium fires. Beginning in 1978 tests were performed at Hanford Engi-neering Development Laboratory (HEDL) to characterize lithium reactions with dry and moist air, nitrogen, carbon dioxide, steam and concrete. These tests involved
Table 1.1: Reactions of lithium with various materials in the containment atmosphere and concrete
Reactions of Lithium with Constituents in the Atmosphere and in Concrete
Reaction Energy (A H298 kJ/mol Li)
Atmosphere: 4Li
+
02 -+ 2Li20 -298 2Li + 02 -+ Li202 -318 6Li + N2 -+ 2Li3N -67 2Li + 2H20 -- 2LiOH + H2 -244 2Li+
H20 -+ Li20 + H2 -177 2Li + 2LiOH -- 2Li20 + H2 -1112Li + H2 -+ 2LiH -10.8
4Li + 3CO2 -+ 2Li2CO3 + C -313 2Li + 2C -- Li2C2 -7.1 Concrete:
8Li + Fe304 -+ 4Li20 + 3Fe -158
the burning of 10-100 kg of lithium in a small sealed test vessel. The quantities measured during the experiments included cell temperatures, gas pressures, overall reaction rates and reaction product distributions[3]. These tests will be reviewed in greater detail in Chapter 2.
About the same time the LITFIRE (LIThium FIRE) code was developed at MIT for the purpose of predicting the temperature and pressure response of the reactor con-tainment to a large lithium spill and fire[2]. The code has the ability to model different spill and containment geometries, with various containment structural materials and atmospheric gases; it has been augmented over the years with the capabilities to model lithium-lead fires, a two-room reactor containment, a concrete-walled contain-ment building, lithium-concrete reactions and an insulated pan holding the lithium or lithium-lead. Since it is not practical to burn very large amounts of lithium to test the accuracy of the code, the results of the HEDL experiments have been used to do so in the past.
Beginning in 1984 small lithium pool reaction kinetics experiments were begun at. MIT to determine the maximum reaction rates of lithium with nitrogen and oxygen as functions of lithium temperature and gas composition[4,1]. These experiments involved the burning of about three grams of lithium in a reaction chamber with the reactant gases supplied by forced convection. The data from these experiments was then used to improve the accuracy of LITFIRE.
In addition to the MIT kinetics experiments, lithium and lithium lead kinetics experiments have been performed at the Joint Research Center (JRC) at Ispra, Italy to characterize lithium and lithium-lead interactions with pure steam[5]. These ex-periments involved the burning of 0.68 to 100 g of lithium and lithium-lead at tem-peratures from 3500C to 8000C in the presence of a surplus of steam. Lithium-steam reaction rates were calculated from measurements of the hydrogen generation rates. A review of the lithium fire experiments will be given in Chapter 2 and a detailed description of the structure and capabilities of LITFIRE will be given in Chapter 5.
1.3
This Work
The purpose of this work is to increase knowledge of the consequences of accidental lithium spills and fires associated with conceptual fusion reactors. The investiga-tive effort has been two-pronged: first, the lithium fire modeling capabilities of the LITFIRE code have been enhanced by the addition of the ability to simulate a con-densible steam containment atmosphere and the ability to simulate radioactive decay heat produced in the reactor blanket and shield structures; second, chemical kinetics tests have been performed to characterize the reaction rates of lithium with steam-nitrogen and steam-air mixtures over a number of different steam concentrations and over a wide range of lithium temperatures.
The LITFIRE code has been modified by the addition of the ability to model condensible steam atmospheres. The modification involved the addition of pools of condensed water on the floor of each cell with heat and mass transfer to and from the pools, the modification of heat transfer to and from containment structures to account for condensation and the modification of the emissivity of the cell gas to account for the presence of water vapor. The code was also modified to model a lithium spill and fire inside the plasma chamber. This involved the addition of models for the blanket and shield structures (with their thermal resistances and heat capacities) and the radioactive decay heat produced by them during an accident. The new code was then used to predict the consequences of various accidents in order to gain some insight into their mitigation.
The lithium kinetics experiments involved the design and construction of a new apparatus to handle lithium-steam reactions, the testing of the apparatus and approx-imately 40 individual runs. The experiments were performed with steam-nitrogen, steam-air (20% oxygen) and steam-nitrogen-oxygen (10% oxygen) mixtures with steam contents of five, 15 and 30 percent. Lithium reaction rates with each of the gases were measured for each gas composition at lithium temperatures of 400-900
the lithium reaction rates and the effect of the presence of steam on the reaction rate of lithium and nitrogen. The results of the experiments were then utilized to further increase the accuracy of the LITFIRE code.
This work will be detailed in the chapters that follow. Chapter 2 will review the lithium fire experiments conducted at HEDL, JRC Ispra and MIT. An overview of the tests and a characterization and summary of the results will be given.
A description of the experimental apparatus and procedures used to conduct the lithium-steam-air kinetics tests will be given in Chapter 3. Each portion of the apparatus and every phase of the procedures will be covered in detail.
The results of the experiments and the analysis of the data will be shown in Chapter 4. The results will be expressed in terms of the lithium reaction rates with the various gas constituents and the observations made during the course of the experiments. Experimental difficulties and sources of error will also be covered. The data analysis will be presented to characterize the kinetics of the lithium reactions and illustrate the effect of the presence of steam.
Chapter 5 will present a complete description of the workings and capabilities of the LITFIRE code, emphasizing the modeling of large lithium fires and the options available to simulate various accident scenarios. This chapter will cover all work done on LITFIRE prior to the present effort.
Chapter 6 will present a description of the modeling of lithium-steam-air interac-tions and the associated development of LITFIRE. It will also include the results of calculations made with LITFIRE to predict the consequences of lithium fires in the presence of steam and a characterization of the effects of the presence of steam in general.
Chapter 7 will cover the determination of the effects of a simultaneous loss of coolant or loss of flow accident and lithium fire. Specifically, the LITFIRE code was enhanced to enable it to model a lithium fire inside the plasma chamber and the decay heat generated in the reactor blanket and shield structures. Both the modeling and
the results of the calculations will be detailed.
Finally, the conclusions drawn from the results of this work, and recommendations for further work will be presented in Chapter 8.
Chapter 2
Review of Previous Lithium Fire
Experiments
Since liquid lithium was being considered for use as a breeder and coolant in fusion reactors, and it was recognized that this posed an accident threat based on the chem-ical reactivity of lithium, it was necessary to determine more precisely the magnitude of the consequences of large lithium fires. These experiments consisted of lithium pool fires, conducted at HEDL by D.W. Jeppson, lithium reaction kinetics studies, conducted at MIT by W.J. Ijams and T.K. Gil and kinetics studies conducted at JRC-Ispra by H. Kottowski[3,4,1,5]. By better determining the consequences of lithium fires, the experiments aided in the reactor design process and, as an additional benefit, provided experience in handling liquid lithium.
2.1
HEDL Pool Fire Experiments
The first lithium pool fire experiments were begun in 1978 at HEDL to characterize lithium pool interactions with air, nitrogen, carbon dioxide and steam and lithium-lead pool interactions with air[3,6]. The interactions with nitrogen and carbon dioxide were of interest as, in light of the high reactivity of lithium with air, it was suggested
to use nitrogen or carbon dioxide as a cover gas in the reactor containment building. If the nitrogen or carbon dioxide did not react violently with the lithium, the chemical hazard, one of the greatest drawbacks to using lithium, would be greatly reduced. Steam reactions were of interest as it is possible that steam could be present in the containment atmosphere as a result of humidity in the air or as a result of a steam line break.
To perform each test, the desired containment atmosphere was created in the test cell, a 14.3 m3 cylinder 2.13 m in diameter and 3.7 m high, containing a reaction
pan 50 cm long x 40 cm wide x 25 cm deep. One larger scale experiment (LA-3) was performed in a room with a volume of 340 m and two other larger scale air experiments (LA-4 and LA-5) were performed in a larger vessel 7.6 m in diameter and 20.4 m high. Ten kilograms of lithium were loaded into a portable lithium transfer vessel (PLTV) in which the lithium was melted and transferred into the reaction chamber via stainless steel tubing. Larger scale tests (LA-3,-4 and -5) employed 45, 26.7 and 100 kg of lithium while the lithium-lead tests (LPA-1-LPA-3) employed 200 kg of 17Li83Pb (a volume equivalent to that of the 10 kg lithium tests). Once the lithium transfer was started it began to react with the cell atmosphere. Additional gas was added to the cell during the test to maintain cell pressure. Aerosol and gas samples were taken during the test. After the completion of the test reaction product samples were taken from the reaction pan to determine their chemical compositions.[3] Schematics of the test cell and the reaction pan are shown in Figures 2-1 and 2-2. The reaction pan was heated and insulated to establish the desired lithium tempera-ture at the beginning of the test. Thermocouples were attached to the pan to monitor the temperatures of the pan and the lithium during the test. Thermocouples were also attached to the test cell wall to monitor its temperature and to measure the cell gas temperature. The cell gas composition, humidity and pressure were monitored continuously throughout the test[3].
LEGEND -THERMO - PRESSURE - GAS SA COUPLE MPLE
0
0
©
ARGON DELIVERY LINEC
-- 4 T TYPICAL .. AEROSOL SAMPLING - -- . REACTION ... STATION - PANr
BACKUP CATCH PAN LITHIUM TRANSFER TANKFigure 2-1: HEDL lithium fire test cell
LOAD CELL MOVIE CAMERA sua I I C=
di. C US C C C di - U N 0 C ) 'U
11
0 4n C1',
VISI
£1
=41
11
* 2 I . E -I CDo U 2 U 2 c o c 'c - -- 9- . C- I U N C- o.l 111~
I 102 ip U CW) * 1-..L - 1 C I-C C Eu 0 *0M
'
&& LU 32 I-u I- E U E U) o 7 2 U 0 U) a !MF lk 11 -4 1. FA ; L-1 a LUJ CL z LL. LlUL
,fv- arlithium-lead test results are summarized in Table 2.2[6]. The lithium-dry air experi-ments (LA-1-LA-5) showed similar results regarding maximum lithium pool and flame temperatures, indicating that they were independent of the initial lithium tempera-ture. Reaction rates were also similar in that the pool temperature reached 1000*C at roughly the same rate, considering the different initial temperatures. The chief differences between the tests involved the generation of combustion products and are shown in Table 2.3[3,7,8,1]. Test LA-3 was performed with an unlimited supply of air and generated a different distribution of reaction products frontests LA-1 and LA-2. A much higher proportion of the reaction product consisted of lithium oxide in the unlimited air test, and much more of the aerosol consisted of lithium carbonate. This may have been due to the fact that lithium reacts more vigorously with oxygen than nitrogen, and in an unlimited air atmosphere, the oxygen supply was also unlimited. The higher fraction of lithium carbonate in the aerosol may have been caused by the higher stability of lithium carbonate relative to lithium oxide and again the presence of unlimited carbon dioxide with the unlimited, air atmosphere.[3,7] Test LA-5 showed similar results in that the cell volume was much larger than in tests LA-1 and LA-2, so the supply of oxygen was larger relative to the amount that reacted with the lithium. This would enable the oxygen to compete with the nitrogen for the supply of lithium more readily, thus generating more lithium oxide.
The lithium-nitrogen test results (LN-1-LN-3) indicated that the initial lithium temperature had a strong effect on the extent of the reaction, contrary to the results of the lithium-air tests. In test LN-1 (2240C) about 10% of the lithium reacted; in test LN-2 (532*C) about 15% of the lithium reacted; and in test LN-3 (843*C) all of the lithium reacted. In fact, in test LN-1 no increase in the lithium pool temperature was observed, indicating that the cooling rate was greater than the rate of energy release from the reaction. In test LN-2 the pool temperature rose for about five minutes and then declined, while in test LN-3 the pool temperature increased about 1400C in 6 minutes, levelled off for about 8 minutes, then declined[3]. This indicates that
Table 2.1: HEDL lithium pool fire test summary (temp. in 0C)
Gas Test Initial Maximum Maximum % Li Comments lithium pool combustion
aerosol-temp. temp. zone temp. ized
N2 LN-1 222 222 N/A 0 No ignition, 10% Li reacted
LN-2 532 542 N/A - No ignition, 15% Li reacted, peak aerosol 0.07 g-Li/m'
LN-3 843 960 N/A - Ignited, reaction products
to 9800C, 100% Li reacted peak aerosol 0.65 g-Li/m3 Air LA-1 243 1038 1260 - Reaction heated pool to 538*C
after 12 min., then rapid rise to 1038*C;
peak aerosol 5.2 g-Li/m3 LA-2 510 1000 1100 5.5 Temp. excursion sooner; peak aerosol 6.5 g-Li/m
LA-3 232 1040 N/A 7.8 45 kg Li with 0.55 m2 area,
unlimited air supply LA-4 600 1070 N/A 10.3 26.7 kg Li, 0.124 M2 area,
lithium leaked into shallow pool with 16.3 kg Li remaining, 2.0 m2 area
LA-5 500 1070 N/A 5.9 100 kg Li, 2.0 m2
area
LAM-1 248 1060 1150 6.1 Humid, decreased from 43% to
1.5% relative humidity during test, had to be ignited by water droplets, peak aerosol 7 g-Li/m 3
LAM-2 539 1100 890 7.3 Humid, 14% relative humidity, self-ignited
C02 LC-1 238 238 238 Did not ignite
LC-2 540 >1400 >1400 3 Ignited
Table 2.2: HEDL Li1RPbs-air pool fire test summary
Test Initial Comments Li1 7Pb83
temp. (0C)
LPA-1 450 No temperature increase, thin oxide coating formed on surface, no detectable aerosol
LPA-2 700 No temperature increase, thin oxide coating formed on surface,
maximum aerosol concentration 0.39 mg-Li/m3 and 0.27 mg-Pb/m3
LPA-3 714 No temperature increase, thin oxide coating formed on surface, even with pool surface agitation, maximum aerosol concentration
0.05 mg-Li/M3 and 1.0 mg-Pb/M3
Table 2.3: HEDL products
test reaction product summary (% of total Li, not wt.% of reaction
Test Test Number Solid Products: Li3N Li20 LiOH LiH Li2CO3 Li2C2 Metallic Li Aerosol Products: LiO Li2CO3 LiGH LiOH-H20 Li2C2 Li-Air
LA-1 LA-2 LA-3
Li-Moist Air
LA-5 I LAM-1 LAM-2
Li-CO2 Li-Steam LC-2 LPS-1 44 47 6 25 41 2.7 0 -45 49 93 75 56 82 92 89 9 0.2 <1 - 2 13 0 6 - - -
5
<1 0.3 0 - 0 2.4 5 -0 0 0 0 0 0 3 -- - 0 - 0 0 <1 0 - 76 68 - 2 12 - 1 15 - -0
- -0
8 7 40 40 0 <1 <1 98 0 0 2.6 97 0 0 <1 0 100 0depending on the initial temperature of the lithium spill (or the operating temperature of the reactor blanket), a nitrogen cover gas could be an effective means of mitigating the consequences of a lithium fire.
Two lithium-carbon dioxide tests were conducted at HEDL. The first (LC-1) had an initial lithium pool temperature of 2380C. No reaction between the lithium and the carbon dioxide was observed during the test. The pool merely cooled off after the lithium was added to the pan[3]. The second test (LC-2) had an initial pool temper-ature of 54000. After the lithium was added the heat of reaction drove the lithium to its boiling point (1347*C) in 2.3 minutes. Thermocouples indicated flame tem-peratures over 14000C. After three to three and a half minutes the lithium corroded through the pan and fell into the catch well below. The test cell was flooded with argon and the test was terminated[7]. Thus carbon dioxide was shown to be totally unsuitable for use as a reactor cover gas or as a fire extinguisher. In fact reactor fire extinguishing systems would have to be designed with the extreme reactivity of lithium and carbon dioxide in mind, possibly leading to the choice of an alternative method of fire suppression.
Three tests were performed with steam, two with moist air (LAM-1 and LAM-2) and one with a steam-argon mixture (LPS-1). The first moist air test was conducted in air with 43% humidity and had an initial pool temperature of 2480C. When the test started the lithium did not ignite but slowly reacted with the water vapor in the air. The pool was then ignited by the sprinkling of a few drops of water onto the surface. The test then proceeded in a manner similar to the dry air tests, with a maximum pool temperature of 10600C and a maximum flame temperature of 11500C The second test was conducted in air with 14% humidity and had an initial pool temperature of 5390C. It ignited immediately and again showed results similar to the dry air tests and LAM-1, although the flame temperature was measured to be only about 850*C, 1.5 cm above the surface of the pool. That was considerably lower than the flame temperatures measured in the other tests[7].
The reaction products from both LAM-1 and LAM-2 differed from the dry air tests in that a significant amount of lithium hydroxide was present in both LAM-I and LAM-2. This was caused by the reaction of steam with lithium oxide (formed by the reaction of lithium with oxygen and steam) to form lithium hydroxide. Approximately 7.3% of the lithium was released as an aerosol in LAM-2[7].
The lithium-steam test LPS-1 was conducted in an atmosphere of 75% steam and 25% argon and had an initial lithium temperature of 7000C. During the test the pool temperature rose quickly to just over 10000C, where it remained until the test was terminated at 12,240 seconds by cell venting and argon flooding. Maximum flame temperatures were found to be as high as 12000C although they tended to fluctuate around 1100*C for most of the duration of the test. Those results were similar to the results of the dry and moist air tests (LA-1-LA-5 and LAM-1 and LAM-2). However, the cell gas temperature reached a maximum of 2700C, which was considerably higher than that seen in the other tests (approximately 1650C in LAM-2). This was due to the increase in radiative heat transfer from the pool and flames to the gas caused by the presence of steam. The reaction products generated consisted of 87% lithium monoxide, 9% lithium hydroxide and 3% lithium hydride by weight. Six percent of the reacted lithium was released as an aerosol, all as lithium hydroxide[8]. These results indicate that a lithium fire in a steam atmosphere poses just as much threat as one in an air atmosphere and maybe more in that an increase in the containment gas temperature would cause an increase in containment gas pressure, which could threaten containment integrity.
2.2
MIT Kinetics Experiments
In addition to the large lithium fire experiments performed at HEDL, the computer code LITFIRE has been developed at MIT to predict the time dependent temperature and pressure profiles in a-fusion-reactor-containment-building-during-a
large-lithium-fire[2]. Early on in the development of the code it was used to simulate the HEDL experiments and some difficulty was encountered as it predicted the temperature and pressure profiles of the test cell fairly well, but overpredicted both the oxygen and nitrogen reaction rates[9].
One of the most significant unknowns was the reaction rate of lithium with nitro-gen as a function of lithium temperature. It was known previously that the reaction rate was a function of lithium temperature and oxygen concentration but it had not been quantified experimentally[2]. Various "guestimated" curves, shown in Figure 2-3, were used in attempts to capture the effect, but the uncertainty was still a source of error[9].
2.2.1 Lithium-Nitrogen Tests
The lack of information on the lithium-nitrogen reaction rate provided the motivation for the initiation of small scale lithium reaction kinetics experiments. The first series of experiments was conducted by Ijams and involved the measurement of the lithium-nitrogen reaction rate as a function of temperature. In those experiments lithium-nitrogen was forced over a small pool of lithium (- three grams) fast enough that the reaction rate was influenced only by the diffusion of lithium to the surface of the pool and not by the nitrogen flow rate. This also enabled the effect of the lithium nitride buildup on the pool surface to be characterized[4].
Ijams' apparatus is shown in Figure 2-4. To prepare each experiment, Tank 1 was pressurized with nitrogen (to approximately 450 kPa (65 psig)) which had been passed through a molecular sieve to remove any water from the gas. Tank 2 was filled with argon at atmospheric pressure. The lithium was loaded into the combustion chamber and the combustion chamber was then placed into the furnace. The lithium was kept under argon to prevent contamination and the chamber was heated to the desired temperature. The temperatures of the experiments ranged from 300*C to 1100*C[4].
Reaction Rate previous form 225 Reaction Rate current form Temperature (C) 225 Reaction Rate another possibility Temperature (C) 225 Temperature (C)
Figure 2-3: Tillack's estimated lithium-nitrogen reaction rate curves 5
625 1025
625 1025
N2 02 (not used) Molecular Gas Sieve Out Valve 10 Tank I Ar H Exci 'for Cooling Flow-meter ---- Filter CombustionChambr in Furnace Valve t Safety Valve Pressure Gauge - Thermocouple * Ceramic Heater - Insulation
Figure 2-4: Ijams' experimental apparatus
[eat hanger G.0s2 Tank 2 Data Logger
An experiment was begun when the gas from Tank 1 was allowed to flow through the flow meter, into the combustion chamber where it reacted with the lithium. Flow rates of 1.5 to 3.5 liters/min were used, depending on the temperature of the lithium. Higher temperature runs required a higher gas flow rate to ensure that the reaction rate was not gas flow rate dependent. Nevertheless, some of the high temperature runs (over 7500C) did indicate a gas flow rate dependence. The unreacted gas then flowed out of the combustion chamber, through the filter and into Tank 2. After a few seconds into the experiment, pressure readings were taken periodically from which the gas flow rates into and out of the combustion chamber were calculated. The difference between the flow rates gave the nitrogen consumption rate[4].
The results of the experiments, expressed as the lithium-nitrogen reaction rate as a function of lithium temperature, are shown in Figure 2-5[4]. It can be seen that the reaction rate was very low at low temperatures and then increased quickly at about 6500. C. In fact more than one run was performed at the higher temperatures in an attempt to eliminate the flow rate dependence. The curve shows that the reaction kinetics limit is most limiting at low temperatures and could make nitrogen attractive as a reactor cover gas. However, if the lithium ever reached temperatures of 6500C or higher the reaction rate would probably be limited only by the gas flow and therefore a large fire could burn out of control, causing severe damage to the reactor. Figure 2-5 shows the maximum reaction rate measured during the HEDL LN-3 test, conducted at 8430C. It can be seen that the reaction rate measured during the forced convection kinetics experiment was considerably higher.
2.2.2
Lithium-Nitrogen-Oxygen Tests
Since the lithium-nitrogen reaction rate in air was known to be not only a func-tion of the lithium temperature, but also a funcfunc-tion of the oxygen content of the atmosphere[2], the next set of kinetics experiments were performed by Gil to deter-mine that dependence. His experiments were similar to those of Ijams, but employed
uui Ll U D M" 2EN, E A ~i LC) I 7"6 LC' 3LV'd NO I i:V3 3 38 z z w I.
ri
u
08
8
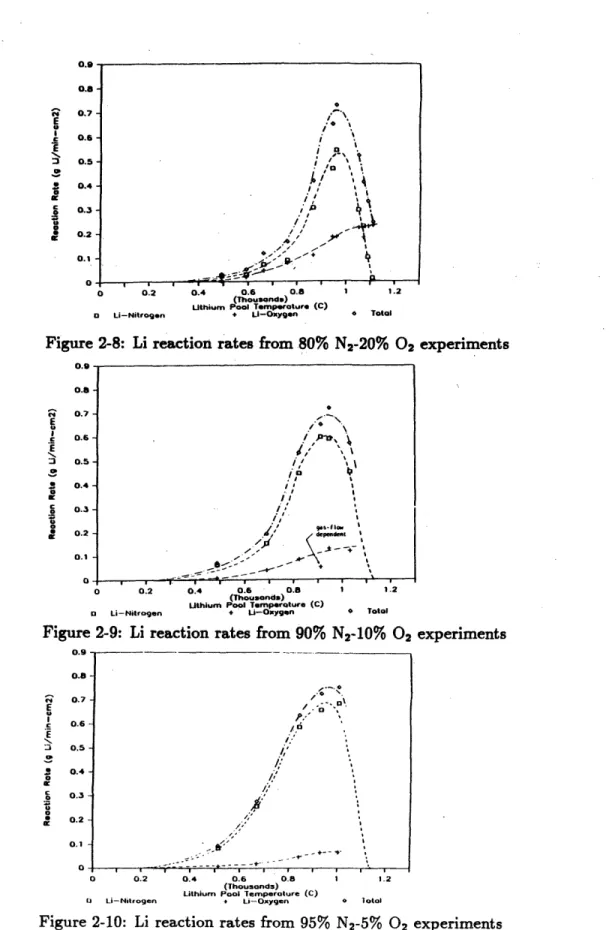
0 LI co '4 '4 0 0 14-4 m 0 4-i 0 '.4 '41 -'.4 *.H '-4 '4 LL LLI cl)i I-W i A 4 tgas mixtures of 80% nitrogen and 20% oxygen, 90% nitrogen and 10% oxygen, 95% nitrogen and 5% oxygen, and pure oxygen to quantify the inhibiting effect of the
presence of oxygen on the lithium-nitrogen reaction rate and also to measure the lithium-oxygen reaction rate. Approximately forty experiments were conducted in the series[1].
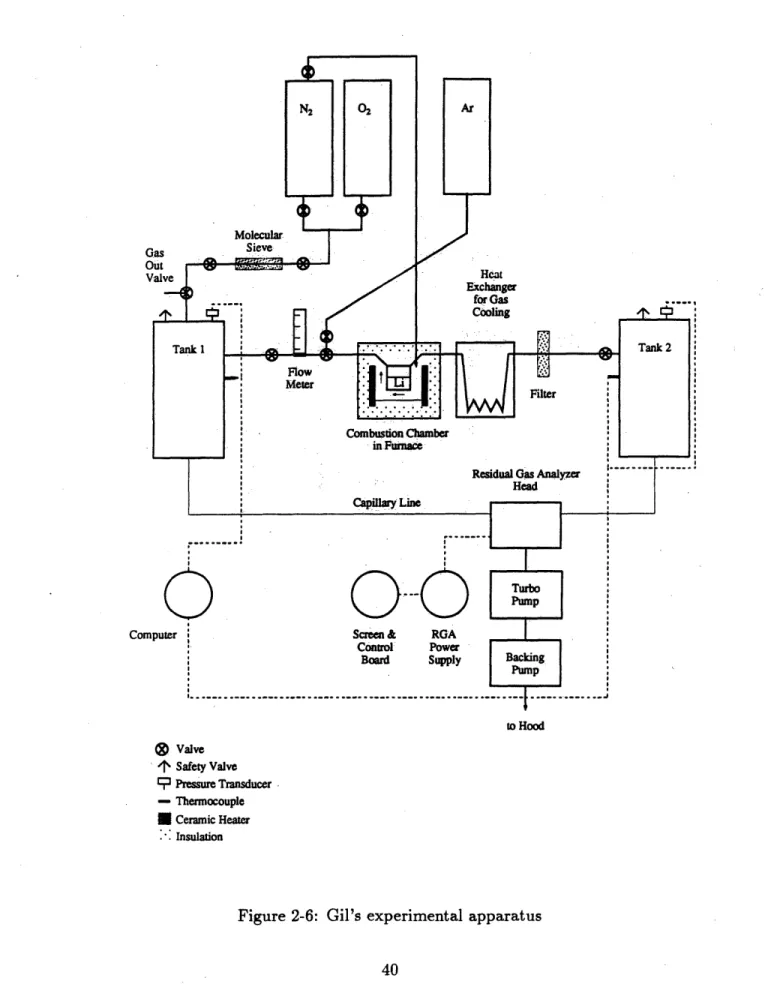
A schematic diagram of the experimental apparatus is shown in Figure 2-6. The
basic apparatus was the same as the one used by Ijams, but a number of changes were made to improve experimental accuracy. A new data acquisition system was installed that could track the tank pressures as well as the tank temperatures. It was connected to an IBM-PC which stored the data from each experiment in a separate
file[1]. Combined with the replacement of the analog pressure gauges with digital pressure transducers this eliminated the need to monitor the tank pressures manually, a significant source of error according to Ijams[4]. The mounting of the thermocouple housing was moved from the top of the combustion chamber to the bottom to ensure that it was always covered by the lithium pool and not exposed to the lithium flame.
Before this modification the housing had been melted during a pure oxygen test, as the flame temperature exceeded 1500*C. The new chamber configuration is shown in Figure 2-7. The gas flow meter was also replaced as it was expected that the mixed gas reaction rates would be higher than the nitrogen reaction rates. The old meter had a maximum capacity of 3.5 liters/min; the new one had a maximum capacity of
14 liters/min[1].
In addition to the improvements made to the system, a means of determining the composition of the gas in Tank 2 was necessary to determine the reaction rates of the lithium with the oxygen and nitrogen. A residual gas analyzer (RGA) was acquired for this purpose. The RGA was connected to Tank 2 by a capillary line and required the gas to be pumped from the tank to the analyzer head at a very low pressure
(< 10- torr). Therefore it was also necessary to acquire a vacuum pumping system.
Computer rN2 r0 Molecular Gas Sieve out-Valve Ar Heat Exchanger foWra a 3 inuCooling nk 1 . . .Tank 2 Flow-Meter .-- -- Filter Combustion Chamber in Furnace
Residual Gas Analyzer
Head
Capillary Line
Turbo
Screen & RGA Control Power
Board Supply Backing
Pump ... ... .. ... .. ... .. ... .. ... .. ... .. ... .. ... .. I ... .. . . to Hood Valve 4 Safety Valve 3 Pressure Transducer - Thermocouple Ceramic Heater Insulation
Figure 2-6: Gil's experimental apparatus
40 Ta
Gas In Gas & Aerosols Out Inconel 'O'-ring --1.5 cm 0.32 an Lithium Pool
-H--
2.22 cm i.d.-
K Thermocouple Well 0.48 cm o.d.Figure 2-7: Gil's combustion chamber
A
1.09 cm i.d.'
3.10 cm
I
I ,l 4 1, 411144414,0.,j k , , 1 -.- ,h J, I r ,
turbomolecular pump backed by a mechanical roughing pump was selected and used satisfactorily[1].
The procedure used to conduct the experiments was similar to the one used by Ijams. Some changes were necessary due to the addition of the new equipment and some were made to reduce the number of experimental runs discarded[1]. The proce-dure used by Gil was also similar to the one used to conduct the experiments reported in this work (described in detail in Chapter 3) so only the changes from Ijams' pro-cedure will be described here.
The most important difference between the two procedures involved the analysis of the gas composition in Tank 2. Because it was necessary to determine the lithium reaction rates with each of the various gas constituents, it was necessary to ensure that Tank 2 was filled with pure argon gas before the run. In the preparation stage of each experiment the vacuum system for the RGA was first pumped down for approximately half an hour. Tank 2 was filled with argon gas to about 70 kPa (10 psig) and then the gas was allowed to bleed out of the tank slowly. This was repeated until the gas in Tank 2 was at least 99.9% pure. The RGA was also used to confirm the gas composition in Tank 1[1].
Another potential source of error mentioned by Ijams was the impurity of the lithium pellets[4]. For that reason it was decided to use lithium ribbon of a higher purity. The lithium was handled in an argon filled bag and spots of contamination were cut off before it was loaded into the combustion chamber. In addition, for the lower temperature runs, the lithium was heated up to 600*C and then allowed to cool to the temperature desired[1].
The reaction rates measured by Gil are shown in Figures 2-8 to 2-10[1]. These plots include both the oxygen and nitrogen reaction rates and the sum of the two. Figure 2-11 compares the nitrogen reaction rates to those measured by Ijams, and Figure 2-12 compares the oxygen reaction rates to each other[1]. The plot of the pure nitrogen reaction rates was derived from a curve fit of Ijams' data. It can
be seen from the figures that the nitrogen reaction rate exhibited the same general temperature dependence as it did in the absence of oxygen. The oxygen reaction rate also appeared to be slightly temperature dependent, although since higher gas flow rates were used for the experiments conducted at higher temperatures it may have been gas flow dependent. This is also supported by the appearance of the oxygen reaction rate curves which tended to level off at high temperatures suggesting that the reaction rates were limited by the oxygen supply.
Figure 2-11 shows that the real effect of the oxygen was to inhibit the nitrogen reaction at all temperatures. The lithium-nitrogen reaction rate inhibition factor, defined as the ratio of the lithium-nitrogen reaction rate in the presence of oxygen to the lithium-nitrogen reaction rate in the absence of oxygen, is shown in Figure 2-13 for the gas compositions used in the experiments[1]. It can be seen that the inhibition increased with the fraction of oxygen. The inhibition factor was also a function of the lithium temperature. It was most pronounced around 700*C and then lessened at higher temperatures as the nitrogen reaction rate increased. Thus as the nitrogen reaction became more vigorous at higher temperatures it could actually compete with the oxygen for the available lithium.
The second major phenomenon observed by Gil was the effect of the reaction products on the gas reaction rates. An example of this is shown in Figure 2-14 in which the square of the mass of the lithium consumed is plotted versus time[1]. From the figure it can be seen that the rate seemed to exhibit a linear law, followed by a logarithmic law, finally followed by a parabolic law over most of the duration of the run. From observing similar plots of other runs it was inferred that the the effect was due to the thickening of the lithium nitride layer on top of the pool. The effect was most pronounced at high temperatures as more lithium nitride was produced. It was also observed that cracks in the nitride layer seemed to form momentarily and allow the lithium to react more quickly. These cracks were seen to be more prevalent at higher oxygen concentrations and higher pool temperatures, suggesting that they
ri E l3 C 0.9 0.8-0.7 0.6 - 0.5- 0.4- 0.3- 0.2- 0.1-0 0.2 0.4 0.6 0.8 1 1.2 (Thousands) Uthium Pool Temperature (C)
O Li-Nitrogen + LI-Oxygen 6 Total
Figure 2-8: Li reaction rates from 80% N2-20% 02 experiments 0.9 0.8 0.7 -oo . 0.5-. 0.6-2 0.5 -$ 0.4 Ien / I S
0.3-a
0.2 -1' dpeedemt 0.1 -~ 0 . . a a a i u iii i a 0.2 0.4 0.6 0.8 1 1.2 (Thousands) Uthium Pool Temperature (C)SLi--Nitragen * Li-Oxygen 0 Total
Figure 2-9: Li reaction rates from 90% N2-10% 02 experiments
0.9 - -.- - 0.8-' 0.7-E Eb / .-c 0.6 ^0 E :3 0.5-0.4 4 0 o 0.3 0
aO
0.2 0.1 0 0.2 0.4 0.6 0.8 (Thousands) Lithium Pool Temperature (C) Q Li-Nitrogen + Li-OxygenFigure 2-10: Li reaction rates from 95%
1 1.2
N2-5% 02 experiments
, \
-*0 i
-- 0 A 4 'I I,, 'I ~~1~~ 1.2 + BOZN2
Figure 2-11: Li-N reaction rates from pure and mixed gas (02) experiments
U
0.4 0.6 0.8 1 1.2
Lithium Temperature (C) (Thouuanda)
Lithium Temperature (C) (Thousands)
+ 20X02 o 02lo02 A 5X202
Figure 2-12: Li-O reaction rates from mixed gas (N2) experiments
E C Ob 0 w c U 0 1 0.9 0.8 0.7 0.6 0.5 0.4-0.3 0.2 0.1 0 0 a 100% N 0.2 0.4 0.6 0.8 (Thousands) Lithium emperature (C) 2 A 95.N2 0 90% N2 0.4- 0.35- 03-0.25 4 0.2-0.15 0.1 -0.05 04 E E N. C 0 0 cc - 9 A- -- A - - A - -A -
-T-T
I
1 f 0)6
0 fe (0 U666
d
*6
1n0 N 0 4 TI0
6
joloof
uotlq14ul
DON~ '10008 ZN-fN z Ul 0) co .. . 0 4 70 c VC4 'N
Soz
.a O. ~0:3 Et
0 -- 0 -a 4-f-4 4-i 0 -'-: **~ 0 '44 0 C13 '-4 r. 4) x 0 4i S CU) '4 0 P4 4were caused by the heat of reaction. For an unknown reason the oxygen reaction rates did not seem to exhibit this phenomenon[1].
2.3
JRC-Ispra Kinetics Experiments
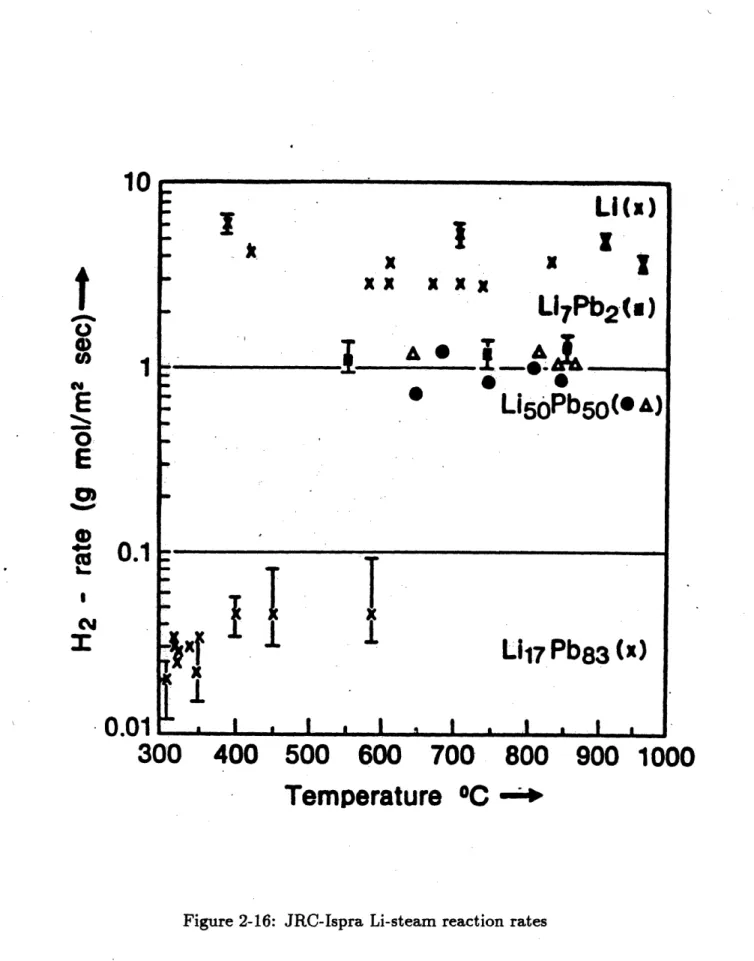
In addition to the kinetics experiments performed at MIT with nitrogen and oxygen-nitrogen mixtures, kinetics experiments have been performed with pure steam at JRC-Ispra. The JRC experiments used Li17Pbs3, Li5OPbrO, and Li7Pb2 lithium-lead
as well as pure lithium as test samples. The tests were conducted in the presence of an excess of steam at 1.0±0.2 bars pressure and the lithium-steam reaction rates were calculated from measurements of the hydrogen generation rates[5].
A matrix of the conditions present for each test is shown in Table 2.4 below. The apparatus used to conduct the experiments is shown in Figure 2-15[5].
To perform an experiment, water was boiled in the steam generator and the steam created passed through a heater to heat it to the desired temperature. The steam then flowed through the test chamber where it reacted with the lithium, producing hydrogen. The hydrogen and the unreacted steam then flowed together through a condenser and into the hydrogen-water separator. The steam was separated from the hydrogen by condensation into the tank of water and the hydrogen was collected in the hydrogen collector. The hydrogen collection rate and the metal pool temperature were monitored throughout the experiment so that the lithium reaction rate could be determined as a function of the pool temperature[5]. A typical experiment ran for about three minutes and the pool temperature increased to as high as 1000*C, so the reaction rates could be measured over a wide range of pool temperatures during a single test.
The hydrogen generation rates measured are plotted versus the metal pool tem-perature in Figure 2-16[5]. It can be seen from the figure that the lithium reaction rate was about four times higher than the Li7Pb2or LiroPbro reaction rate, and was
N 0 N~ x 0 00 CU) 0 Jc 0