Publisher’s version / Version de l'éditeur:
Vous avez des questions? Nous pouvons vous aider. Pour communiquer directement avec un auteur, consultez la première page de la revue dans laquelle son article a été publié afin de trouver ses coordonnées. Si vous n’arrivez pas à les repérer, communiquez avec nous à [email protected].
Questions? Contact the NRC Publications Archive team at
[email protected]. If you wish to email the authors directly, please see the first page of the publication for their contact information.
https://publications-cnrc.canada.ca/fra/droits
L’accès à ce site Web et l’utilisation de son contenu sont assujettis aux conditions présentées dans le site LISEZ CES CONDITIONS ATTENTIVEMENT AVANT D’UTILISER CE SITE WEB.
Paper (National Research Council of Canada. Division of Building Research),
1982
READ THESE TERMS AND CONDITIONS CAREFULLY BEFORE USING THIS WEBSITE. https://nrc-publications.canada.ca/eng/copyright
NRC Publications Archive Record / Notice des Archives des publications du CNRC : https://nrc-publications.canada.ca/eng/view/object/?id=7ad2b631-a8f9-4643-8635-df77bd64bac6 https://publications-cnrc.canada.ca/fra/voir/objet/?id=7ad2b631-a8f9-4643-8635-df77bd64bac6
NRC Publications Archive
Archives des publications du CNRC
This publication could be one of several versions: author’s original, accepted manuscript or the publisher’s version. / La version de cette publication peut être l’une des suivantes : la version prépublication de l’auteur, la version acceptée du manuscrit ou la version de l’éditeur.
For the publisher’s version, please access the DOI link below./ Pour consulter la version de l’éditeur, utilisez le lien DOI ci-dessous.
https://doi.org/10.4224/40000464
Access and use of this website and the material on it are subject to the Terms and Conditions set forth at
Comparison of model and full-scale tests of the Commerce Court
Building in Toronto
Ser I I'J2ld
,
National Research
Conseil national
co 2no I
n
Council Canada
BLDE
,
de recherches Canada
COMPARISON OF MODEL AND FULL SCALE TESTS OF THE COMMERCE COURT BUILDING IN TORONTO
by W.A. Dalgliesh
ANALYZED
Appeared in
Proceedings of the International Workshop on Wind Tunnel Modeling Criteria and Techniques in Civil Engineering Applications
Gaithersburg, Maryland, April 1982 p. 575 - 589
Reprinted with permission
DBR Paper No. 1237
Division of Building Research
I Price $1.25
-
f r g l ~ lBLDG. RES.
I
W ~ R A R Y
84- 11- 1 j
A OTTAWA NRCC 23757ABSTRACT
The Commerce C o u r t Tower was t h e s u b j e c t of wind t u n n e l t e s t s i n 1969 a n d i n 1977, and t h e b u i l d i n g i t s e l f was monitored f o r v a r i o u s wind e f f e c t s from 1973 u n t i l 1980. The f i r s t comparisons of mean and f l u c t u a t i n g p r e s s u r e c o e f f i c i e n t s were p r e s e n t e d i n 1975 and a p r e l i m i n a r y a s s e s s m e n t of b o t h wind t u n n e l and b u i l d i n g code p r e d i c t i o n s of t i p d i s p l a c e m e n t a p p e a r e d i n 1978. The n e x t comparison, p r e s e n t e d i n 1979, exposed some of t h e l i m i t a t i o n s of f i e l d s t u d i e s f o r t h e e v a l u a t i o n of mean p r e s s u r e c o e f f i c i e n t s a s w e l l a s t h e d i f f i c u l t i e s of s p e c i f y i n g peak p r e s s u r e s , whether i n t h e f i e l d o r t h e wind t u n n e l . T h i s r e p o r t r e v i e w s and i l l u s t r a t e s t h e main f i n d i n g s of t h e e a r l i e r comparisons and supplements them w i t h new examples comparing t h e dynamic b e h a v i o u r of t h e b u i l d i n g and an a e r o e l a s t i c model.
L'immeuble Commerce Court d e T o r o n t o a 5 t 6 soumis
Zi
d e s e s s a i s e n t u n n e l agrodynamique en 1969 e t 1977 e t on a e n r e g i s t r ' e l e s e f f e t s r 6 e l s du v e n t s u r l e b a t i m e n r d e 1973 3 1980. Les p r e m i e r e s comparaisons ' e t d e p r e s s i o n l o c a l i s d e e s t i m a t i o n p r g l i m i n a i ~ lr d e s e s s a i s e n t u n n e l e Code du b a t iment aC t l
I s prgsent'ee en 1979, - - - -- ~6 B t u d e s e f f e c t u S e s s e p r e s s i o n moyenne e t e p r e s s i o n s u r p l a c e t g t u d i e e t i l l u s t r e 3 comparaisons e t l e L comparent l e comporl c a 6 r o B l a s t ique.COMPARISON OF MODEL AND FULL SCALE TESTS OF THE COMMERCE COURT BUILDING I N TORONTO
W. Alan D a l g l i e s h
D i v i s i o n of B u i l d i n g Research
National Research Council of Canada
1. OVERVIEW
AND SCOPE
The f i r s t wind t u n n e l study of t h e Commerce Court Tower, sponsored by t h e s t r u c t u r a l e n g i n e e r s f o r t h e p r o j e c t i n 1969, i n c l u d e d measurements of mean and f l u c t u a t i n g p r e s s u r e s , dynamic response of a two degree-of-freedom a e r o e l a s t i c model, and a s y n t h e s i s w i t h m e t e o r o l o g i c a l d a t a f o r p r e d i c t i n g s t r u c t u r a l l o a d s , dynamic response, and e x t e r i o r c l a d d i n g and window
p r e s s u r e s [ l ]
.
With f u l l c o o p e r a t i o n from t h e p r o j e c t owner, d e s i g n consul-t a n t s , c o n t r a c t o r s and b u i l d i n g management s t a f f , t h e National Research Council of Canada (NRCC) instrumented and monitored t h i s 57-storey o f f i c e tower continuously from f i r s t tenancy i n 1973 u n t i l October 1980.
The f i r s t comparisons of mean and f l u c t u a t i n g p r e s s u r e c o e f f i c i e n t s were p r e s e n t e d i n 1975[2] and a p r e l i m i n a r y assessment of b o t h wind t u n n e l and b u i l d i n g code p r e d i c t i o n s of t i p displacement appeared i n 1978[3]. Viewed a s a v a l i d a t i o n of wind t u n n e l t e s t i n g , t h e comparisons were moderately s u c c e s s f u l , but they a l s o showed t h a t f i e l d measurement
techniques and d a t a a n a l y s i s methods a r e themselves i n need of development
and v a l i d a t i o n . The National Aeronautical Establishment (NBE) of NRCC
cooperated i n t h e d e s i g n of b o t h a r i g i d p r e s s u r e t a p model and a n aero-
e l a s t i c model w i t h 21 degrees-of-freedom a t a l e n g t h s c a l e of 1:200 f o r
t e s t i n g i n t h e i r 9 m x 9 m wind tunnel. In a s e n s e , t h e p a r a l l e l s t u d i e s of t h e next few y e a r s reversed t h e v a l i d a t i o n process a s s p e c i f i c
s i t u a t i o n s encountered i n t h e f i e l d were i n v e s t i g a t e d i n t h e wind tunnel. The next comparison, presented i n 1979[4], exposed some of t h e
l i m i t a t i o n s of f i e l d s t u d i e s f o r t h e e v a l u a t i o n of mean p r e s s u r e coef f i- c i e n t s a s w e l l a s t h e d i f f i c u l t i e s of s p e c i f y i n g peak p r e s s u r e s , whether i n
t h e f i e l d o r t h e wind tunnel. The a e r o e l a s t i c s t u d i e s were i n s t r u m e n t a l i n
r e v e a l i n g how much t o r s i o n c o n t r i b u t e s t o a c c e l e r a t i o n s a t end w a l l s of t h i s p a r t i c u l a r b u i l d i n g [ 5 , 6 ] .
It is t h e purpose of t h i s r e p o r t t o review and i l l u s t r a t e t h e main
f i n d i n g s of t h e e a r l i e r comparisons and t o supplement them w i t h new examples comparing t h e dynamic behaviour of t h e b u i l d i n g and t h e aero-
c a r r y i n g o u t a v a l i d a t i o n p r o c e s e w l l l be s t r e s e e d , and s u g g e s t i o n s w i l l be ofdered f o r f u r t h e r work t o develop improved modelling and c o n s u l t i n g procedure^.
2. DESCRIPTION OF
BUILDING
AND NAE PROXIMITYMODEL
The Commerce Court Tower,
a t
239
m
t h e secondt a l l e s t
b u i l d i n g i n downtwn Toronto,i s p a r t i a l l y s h e l t e r e d from southwest t o northwest by
b u i l d i n g s from 175 t o 285m
i n h e i g h t (Fig. 1). A s t r i p of t a l l b u i l d i n g s3
km wide e x t e n d s s e v e r a l k i l o m e t r e s t o t h e north. Surrounding t h e s e a r e a sare
s e v e r a l k i l o m e t r e s of r e l a t i v e l y low buildinge. Lake Ontariol i e s
1 km t o t h e south.The proximity model used i n t h e
NAE
9 m
x 9m
wind t u n n e l was mounted on a 7.3m
d i m t u r n t a b l e 18.3m
downstream of s p i r e s used t o develop t h e boundary l a y e r (Fig. 2). A power law p r o f i l e of 0.33 was used f o rapproaches f r o m w e s t , n o r t h and e a s t , w h i l e a p r o f i l e exponent of 0.15 was used f o r t h e l a k e exposure t o t h e south. The s t r i p of t a l l b u i l d i n g s t o
t h e n o r t h was s i m u l a t e d by adding l a r g e r blocks t o t h e g e n e r a l urban roughness between t h e s p i r e s a t t h e i n l e t and t h e t u r n t a b l e .
Plan dimensions of t h e b u i l d i n g a r e shown i n Fig. 3, which a l s o g i v e s t h e l a y o u t of s u r f a c e p r e s s u r e t a p s on e a c h of f o u r l e v e l s . The column l a y o u t of t h e 57-storey steel frame s t r u c t u r e i s given i n Fig. 4. Floors a r e c o n c r e t e and c l a d d i n g and p a r t i t i o n s were designed t o allow movement w i t h r e s p e c t t o t h e frame, which d e f l e c t s mainly by s h e a r i n g of a d j a c e n t
f l o o r s i n p a r a l l e l p l a n e s w i t h no s i g n i f i c a n t column s h o r t e n i n g . The c e n t r e of mass t e n d s t o be near t h e geometric c e n t r e , but t h e e l a s t i c a x i s i s g e n e r a l l y about 5 m t o t h e s o u t h on t h e E-W c e n t r e l i n e .
3. INSTRUMENTATION OF BUILDING
Reference wind speed and d i r e c t i o n were measured by a 3-cup anemometer and vane mounted on a r a d i o t r a n s m i t t i n g antenna mast a t a h e i g h t of 286 m above grade (47 m above t h e r o o f ) . D i f f e r e n t i a l p r e s s u r e t r a n s d u c e r s were l o c a t e d a l o n g e i g h t v e r t i c a l l i n e s a t f o u r l e v e l s t o measure s u r f a c e
p r e s s u r e s a g a i n s t t h e p r e s s u r e i n a pneumatic l i n e connecting t h e r e f e r e n c e p o r t s of a l l 32 t r a n s d u c e r s t o t h e ambient p r e s s u r e i n a c e n t r a l r e c o r d i n g l o c a t i o n on t h e 33rd f l o o r . Ambient a b s o l u t e p r e s s u r e i n t h e r e c o r d i n g room was a l s o recorded.
S t r a i n gauges were mounted n e a r t h e ends of s p a n d r e l beams and on two columns a t t h e 1 1 t h f l o o r where a change i n column s e c t i o n was expected t o r e s u l t i n h i g h e r s t r e s s e s under wind loading. Although more than 50 p a i r s of gauges remained s e r v i c e a b l e throughout t h e p r o j e c t , only f o u r t o s i x p a i r s were monitored on a r e g u l a r b a s i s .
Three a c c e l e r o m e t e r s were i n s t a l l e d a t t h e 202 m l e v e l i n March 1975, two t o measure E-W motion a t t h e n o r t h and s o u t h w a l l s , and one t o measure N-S motion. A displacement t r a c k i n g d e v i c e t o meashre h o r i z o n t a l X-Y
displacements n e a r t h e g e o m e t r i c c e n t r e of t h e b u i l d i n g and two more a c c e l e r o m e t e r s were i n s t a l l e d i n J u l y 1977. The displacement t r a c k e r u s e s two p a i r s of p h d t o c e l l s t o s e n s e t h e p o s i t i o n of a laser beam d i r e c t e d v e r t i c a l l y from f o u n d a t i o n l e v e l ( a t 15 m below grade) t o t h e 234 m l e v e l -
F i g u r e 1. Commerce Court Tower F i g u r e 2. Commerce Court model (arrow) i n downtown Toronto viewed i n NRC 9 m x 9 m wind t u n n e l viewed from 330 deg (0 = b u i l d i n g w e s t ) from 1 0 deg (0 = model w e s t )
LEVEL E L E V .
I
A N E M O M E T E RI+
I
e . g . , TAP 3 0 4 3-
LEVEL 0 4-
TAP NUMBER F i g u r e 3 . L o c a t i o n of p r e s s u r e t a p s on b u i l d i n g (a sub-set of t h o s e on t h e model) N O R T HI7
II-
-
a1 II 4 1 S O U T H*
-
-
a F i g u r e4.
Framing of 57-storey b u i l d i n gOutputs from t h e p h o t o c e l l s c o n t r o l two servo motors t h a t move t h e c a r r i a g e on which t h e p h o t o c e l l s r i d e t o compensate f o r movements of t h e top of t h e building r e l a t i v e t o t h e l a s e r beam.
4. FIELD DATA COLLECTION
A mini-computer c o n t r o l l e d d i g i t a l sampling and s t o r a g e of d a t a from 48 channels continuously from e a r l y i n 1973 u n t i l t h e middle of 1980
(except when i n t e r r u p t e d by power f a i l u r e o r malfunctions). Although some of t h e d e t a i l s varied, euch a s sampling r a t e s , choice of s e n s o r s f o r recording, threehold wind speeds and s o on, t h e most common format
was
t o r e c o r d two s e t s of summary d a t a p e r hour r e g a r d l e s s of wind speed.As
w e l l , whenever t h e wind speed exceeded 18 m / s o r some o t h e r s e l e c t e d value, complete time h i s t o r i e s of a l l 48 channels were recorded f o r 35 min.
Summary d a t a provided t h e a r i t h m e t i c mean, standard d e v i a t i o n , minimum and maximum f o r each of t h e 48 s e n s o r s f o r t h e 5-min i n t e r v a l a t t h e end of t h e hour and f o r t h a t S-min i n t e r v a l with t h e h i g h e s t wind speed. The sampling r a t e was 20 s - l , but i n g e n e r a l t h e time h i s t o r i e s c o n s i s t e d only of every t e n t h sample f o r an e f f e c t i v e r a t e of
2
s'l. A s p e c i a l mode shape survey was r u n i n August 1980 i n which s e v e r a l a d d i t i o n a l accelerometers were temporarily i n s t a l l e d on t h e roof and a t t h e f i v e i n s t r u m e n t a t i o nl e v e l s . Wind speeds encountered on t h e mode ehape survey were 7 and 14
m/s.
The s t r o n g e s t winds recorded came mainly from one of two s e c t o r s , E-N-E and S-W ( r e l a t i v e t o b u i l d i n g ) . There were a l e o s t r o n g winds from
t h e N-W, but a f t e r completion ( i n 1976) of t h e 285
m
high F i r a t Canadian P l a c e b u i l d i n g very few records were t r i g g e r e d by t h e anemometer d i r e c t l y downwind a t approximately the eame height. Very few s t r o n g winds were experienced from t h e S-E and S, s o t h a t t h e s e f i e l d meaeurements cannot provide u s e f u l information f o r comparieon with model d a t a .The h i g h e s t S-min mean r e f e r e n c e speed of 33
m / s
was
recorded during an exceptionally l o n e l a s t i n g s t o r m on 26 January 1978. The l a r g e s t peak preeeure d i f f e r e n c e measured wae-
640~ / m ~ .
Largest dieplacementsmeasured a t t h e 234
m
l e v e l a t t h e geometric c e n t r e of t h e b u i l d i n g were about 220mm,
and peak a c c e l e r a t i o n s were 10 t o 15 x 10-3times
t h e a c c e l e r a t i o n due t o g r a v i t y (10 t o 15 m i l l i g ) .5.
REVIEW OF PRESSURE COEFFICIENT COMPARISONSThe dynamic r e f e r e n c e p r e s s u r e , by which measured s u r f a c e preeeuree were divided t o form non-dimeneional c o e f f i c i e n t s , was c a l c u l a t e d from t h e
anemometer speed a t 286
m,
outdoor a i r temperature froma
nearby meteoro- l o g i c a l s t a t i o n , and barometric p r e s s u r e i n t h e instrument room on t h e 33rd f l o o r . Measured s u r f a c e preesureewere,
i n f a c t , n o t a b s o l u t e readings but d i f f e r e n c e s from t h e barometric p r e e e u r e i n t h e inetrument room; unfortun- a t e l y , t h e r e appears t o be no easy method of r e l a t i n g t h i s 80-called s t a t i c r e f e r e n c e p r e s s u r e of f i e l d measurements t o something conparable i n t h e wind tunnel, s h o r t of modelling t h e e f f e c t i v e p o r o e i t y of t h e b u i l d i n g5.1
Stack Effect
Another difficulty is posed by buoyancy of heated indoor air; in cold
weather, -ressure differences across the walls of a 57-storey building as a
result of stack effect are of the same order as those from moderately
strong winds that make up the bulk of useful observations in field measure-
ments. Reference dynamic pressure and the difference between the inverses
of indoor and outdoor temperatures are treated as two independent variables
whose effects on surface pressure differentials can be separated by
multiple linear regression. A third source of pressure differentials, also
not found in wind tunnel testing, is the mechanical system for distributing
air throughout the building.
The removal of stack effect is helped by the strong correlation with
temperature (partial correlation coefficient is typically greater than
0.85), but some uncertainty is introduced.
A more difficult problem is the
variable success found in correlating the wind-induced component with the
dynamic refetence pressure; here the partial correlation coefficient
usually ranges from a high of 0.85 to as low as 0.15.
The main factor
seems to be the availability of sufficiently strong winds to provide a good
range of the independent variable. The process whereby field measurements
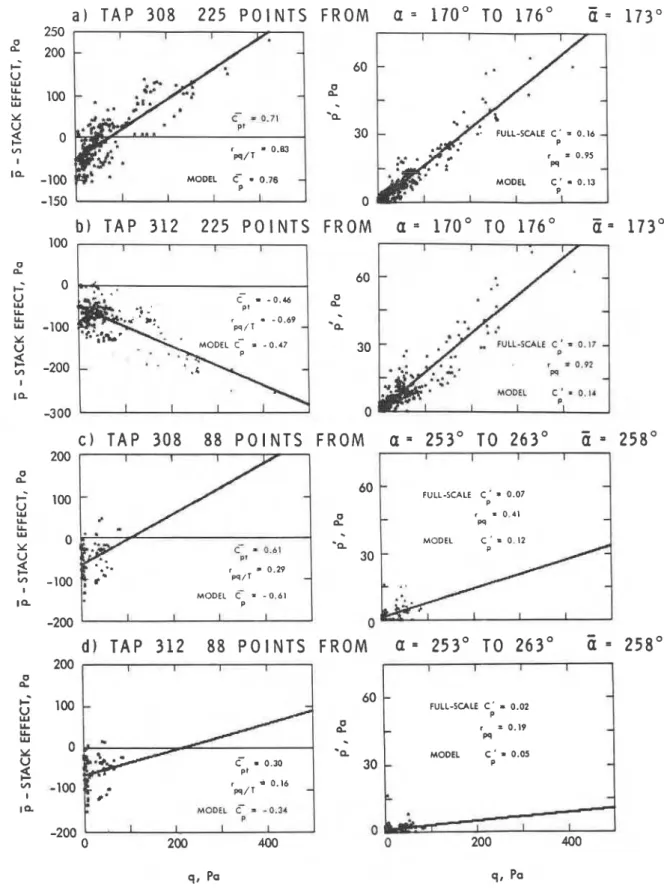
are transformed to pressure coefficients is illustrated in Fig. 5 for two
sensor locations, 308 and 312, for two different wind directions.
5.2 Internal Pressure Coefficient
The slopes in the diagrams on the left of Fig. 5 represent a combined
external and internal mean pressure coefficient; those on the right are
coefficients for the standard deviation of the pressure difference; though
they are not significantly affected by either stack effect or the a i r
handling system, the fluctuating pressure coefficients may still contain an
internal component not present in wind tunnel experiments. Correlations
are generally better for the fluctuating coefficients (on the right) than
for the mean coefficients because there is no need for multiple regression
to discriminate between wind and some other effect.
The pressure coefficients obtained by determining the slopes of best-
fit regression lines in the least square sense (Fig. 5) are compared with
those measured directly in the wind tunnel, with the following proviso:
that an attempt is made to extract the mean internal pressure coefficient
by subtracting the average of the 32 differences between matching sensor
locations in model and building for each wind direction evaluated. This
averaged difference is interpreted as the difference between the common
internal reference used in the building, and the f
ree-stream static
reference used in the wind tunnel. For the most part the difference would
not be considered unreasonable as an internal pressure coefficient, usually
about -0.15 in the Commerce Court.
Onthe other hand, where insufficient
high winds were available to give strong correlations with pressure
differences attributed to wind effect an offset of as much as 0.65 might
result.
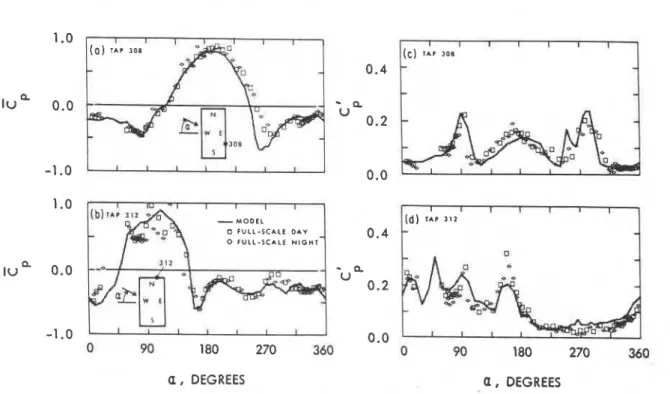
The two sensors treated in Fig. 5 are also used as examples of the
agreement between model and full-scale pressure coefficients as a function
of wind direction, with mean external coefficients to the left and root-
mean-square about the mean coefficients (standard deviation) to the right
-
a ) T A P 3 0 8 2 2 5 P O I N T S F R O M
Q =1 7 0 " T O 1 7 6 "
a
=1 7 3 "
250 200-
-
r = 0.95 P9-
MODEL C ' * 0.13 P -100 -150 0b )
T A P 3 1 2 2 2 5 P O I N T S F R O M
a
=1 7 0 " T O 1 7 6 "
E =
1 7 3 "
100 - C-
- 0 . 4 6 P t r - 0 . 6 9 MODEL C- = - 0 . 4 7-
-
r PP 0.92-
MODEL C ' 0.11 P C )T A P 3 0 8 8 8 P O I N T S F R O M
a
=2 5 3 " T O 2 6 3 "
5
=2 5 8 "
c--
0.41 P I r 0.29 p q / T-
MODEL C- - 0 . 6 1 P 1 I 1 I FULL-SCALE C ' a 0.07 n MODEL C ' = 0 . I2-
d l
T A P 3 1 2 8 8 P O I N T S F R O M
a
=2 5 3 " T O 2 6 3 "
a
=2 5 8 "
200 I 1 I I O n CI 100 60-
FULL-SCALE C ' = 0.02-
M
P LL LLdl
-
r = 0.19 W P9-
u O -au
30-
MODEL C 0.054
-
*
-100 5-
I Q -200 0- I I I 0 200 400 0 200 400Figure
5.
Measured full-scale surface pressures versus dynamic reference pressure at286
m0 F U L L - S C A L E D A Y
0 F U L L - S C A L E N I G H T
a , DEGREES a , DEGREES
Figure 6. Comparison of model and full-scale pressure coefficients versus wind direction
(Osbuilding west) for pressure taps 308 and 312.
5.3
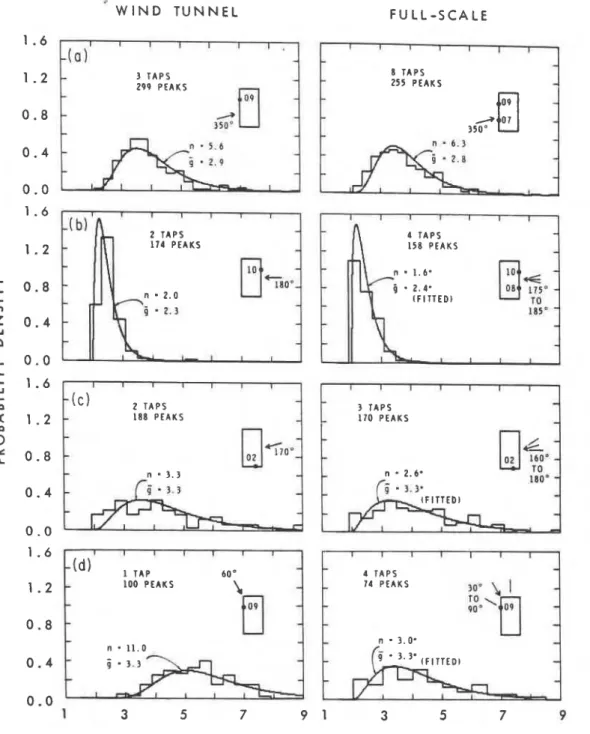
Peak Pressure CoefficientPeak pressure coefficients, usually the end product sought for cladding design, are essentially "location" parameters for extreme value distributions. Sometimes they are estimated from measurements of the mean and standard deviation coefficients, but the trend i n wind tunnel practice is now to measure the peaks and record them directly as the wind effect needed in design. Clearly, some assurance is required that the extreme values discovered in the wind tunnel bear as close a resemblance as possible to those observable on real buildings. Close attention must be paid to time scaling as well as to geometric scaling, and sampling rates in the field and the wind tunnel should be high enough to capture the shortest transient peaks.
A
fairly simple experimental approach was used to process the fielddata from Commerce Court.
A
negative exponential distribution was fittedto "parent" populations of spikes of either pressure or suction in time series records from various sensors, grouped according to the general character of th& distributions. This gave rise to perhaps the simplest possible analytical expressions for extreme values, and these expressions provided exponential curves with acceptable fit to histograms of extreme
values, both from the building and from the wind tunnel (Fig. 7). An added
advantage of fitting extreme value histograms with analytical expressions c o w s when these is a need to predict not only the extreme peak for a
typical design storm but also several lesser spikes, as in the estimation of cumulative damage effects on w i n d m glass[7].
6. STRUCTURAL RESPONSE
TO
WIND LOADINGW I N D T U N N E L F U L L - S C A L E 1 . 6 I I I 1 I I 1
. -
I-(a
-
-
I I I I I I - * 1 . 2-
3 T A P S- -
8 TAPS 2 9 9 PEAKS 255 PEAKS-
-
0 . 8-
3$8
1 :
0 7-
3 5 0 "1
t
-
-
L I I I 1 . 6-
l I I I I r b I I I I I I I L 2 TAPS 4-
4 4 TAPS 1 . 2-
174 PEAKS-
-
1 5 8 PEAKS-
-
1
4
1
om 175' V) 185" TO-
Z 0 . 4-
- -
W-
- -
-
I t I I I I--
I J 1 . 6 I 1 I I 1 I - I I I I 1 I I I-
m(c)
2 TAPS- -
3 TAPS 1 . 2 1 8 8 PEAKS- -
1 1 0 PEAKS m-
0 ac 0 . 8aaoo:
n - 3 3- -
n-
2.6'1
T 0 110.-
0 . 4- -
-
0 . 0 1 . 6 I I I I 1 I I > - I I 1 I I I 1 1 TAP 6 0 "-
-
4 TAPS-
1 . 2-
1 0 0 PEAKSI
- -
74 PEAKS 30'I
-
-
0 . 8-
n
3
-
n - 3 0 ' n - 1 1 0 0 . 4-
- -
:"'I
-
-
-
-
-
0 . 0 I 1 3 5 7 9 1 3 5 7 9 PEAK F A C T O R , S T A N D A R D D E V I A T I O N S F R O M M E A NFigure
7.
Histograms of peakpressures measured in the wind tunnel (left) and on the full-scale building (right )
s t a g e s , beginning w i t h s t r a i n gauges a t t h e 1 1 t h f l o o r , followed i n 1975 by accelerometers, t h e n displacement t r a c k i n g equipment and more acceler-
ometers i n 1977. One of t h e f i r s t i n t e r e s t i n g d i s c o v e r i e s was t h e
remarkable s i m i l a r i t y i n t h e "dynamic s i g n a t u r e " of t h e s t r a i n gauge readings during a s t r o n g wind and t h e corresponding displacement t r a c e s . Another was t h e d i s t i n c t s h i f t i n n a t u r a l f r e q u e n c i e s ( i n a l l observed modes) downwards w i t h i n c r e a s i n g amplitude of motion(31, a phenomenon noted
by o t h e r s observing motion of t a l l b u i l d i n g s [ 8 ] .
Early a t t e m p t s by NRCC t o r e l a t e amplitude of motion t o dynamic
r e f e r e n c e p r e s s u r e i n t h e same manner as f o r d e r i v i n g p r e s s u r e c o e f f i c i e n t s
were moderately s u c c e s s f u l f o r mean along-wind displacements. P r e d i c t i o n s
based on e i t h e r t h e d e t a i l e d method of t h e N a t i o n a l B u i l d i n g Code of Canada[9] o r wind t u n n e l t e s t s a t t h e U n i v e r s i t y of Western O n t a r i o [ l ] appeared t o be r e p r e s e n t a t i v e of t h e mean and s t a n d a r d d e v i a t i o n s of b o t h
along-wind and cross-wind movements i n an e a s t e r l y wind. It is important
t o n o t e t h a t agreement depended on u s i n g measured b u i l d i n g f r e q u e n c i e s i n t h e c a l c u l a t i o n s .
7. NAE AEROELASTIC MODEL
I n d i c a t i o n s of t o r s i o n a l behaviour sparked i n t e r e s t i n a e r o e l a s t i c t e s t s u s i n g a r a t h e r more e l a b o r a t e model t h a n would normally be considered
necessary f o r providing d e s i g n information. The N-S modes a r e t r a n s l a -
t i o n a l , w i t h no t o r s i o n and tend t o have t h e same, o r s l i g h t l y lower,
f r e q u e n c i e s when compared w i t h corresponding E-W t r a n s l a t i o n a l modes. 'She
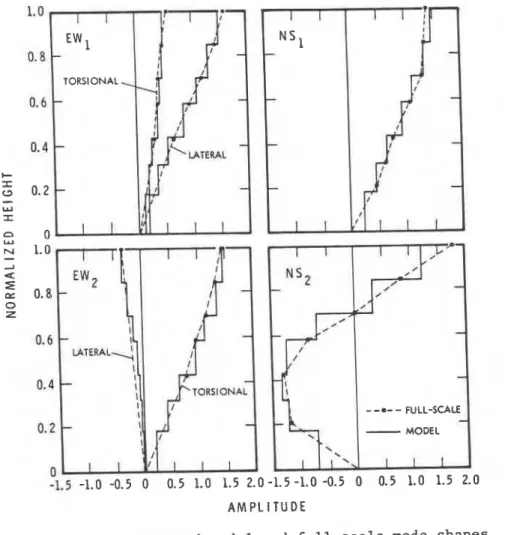
f i r s t E-W mode of v i b r a t i o n i s predominantly t r a n s l a t i o n , i n c r e a s i n g
l i n e a r l y with h e i g h t , and i s coupled w i t h a predominantly t o r s i o n a l mode a t a frequency only 30 p e r cent above t h e f i r s t . The two modes combine t o make t h e a c c e l e r a t i o n s of t h e n o r t h w a l l i n t h e E-W d i r e c t i o n markedly more
s e v e r e than t h o s e of e i t h e r t h e geometric c e n t r e o r t h e s o u t h w a l l of t h e
building.
The a e r o e l a s t i c model s t i f f n e s s was based on s e v e r a l p r a c t i c a l c o n s i d e r a t i o n s and r e s u l t e d i n a frequency s c a l e of 1:53 a t a f u l l s c a l e
r e f e r e n c e wind speed of 14 m / s , i n c r e a s i n g t o about 1 :56 (E-W) o r 1 :58
(N/S) a t 28 m / s . The i n c r e a s e r e s u l t s from t h e d e c r e a s e i n f r e q u e n c i e s of
t h e building a s wind speed i n c r e a s e s . The s h i f t i s about t h e same f o r a l l
modes, and amounts t o 10 t o 15 p e r c e n t i n moving from r e f e r e n c e wind
speeds of 7 m / s t o those of about 30 m / s . The choice of l e n g t h and
frequency s c a l i n g f i x e s time s c a l i n g and v e l o c i t y s c a l i n g a s f a r a s dynamic
behaviour of t h e a e r o e l a s t i c model i s concerned. The h i g h e r modes r e l a t e
t o t h e fundamental mode approximately i n t h e r a t i o s 1:3:5, a s expected f o r
a c a n t i l e v e r deforming i n s h e a r r a t h e r than bending. Seven mass l e v e l s
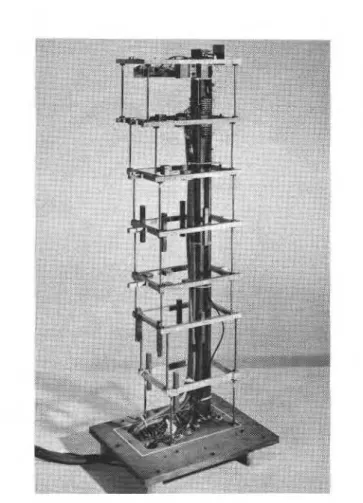
were chosen by p l a c i n g one a t each of t h e f i v e instrumented l e v e l s i n t h e b u i l d i n g and then d i v i d i n g each of t h e bottom two modules i n two t o make
a l l t h e modules approximately t h e same h e i g h t (Fig. 8 ) . The a c t i o n of t h e
coupled E-W modes i n c o r p o r a t i n g both t r a n s l a t i o n and r o t a t i o n i s diagrammed
i n terms of t i p displacements i n Fig. 9. Mode shapes a r e compared f o r t h e
b u i l d i n g and t h e model i n Fig. 10 on t h e b a s i s of accelerometer readings t a k e n d u r i n g t h e s p e c i a l survey of t h e b u i l d i n g j u s t b e f o r e t h e removal of recording equipment i n October 1980.
Figure
8.
Frame of aeroelastic model with seven lumped mass levelsW
-
ELASTIC A X I SM
-
CENTRE OF MASSI
C-
CENTREOF ROTATIONFigure
9.
Tip modal deflections for first two coupled modes8. NEW DISPLACEMENT AND ACCELERATION COMPARISONS
Figure 11 g i v e s a f a i r l y r e p r e s e n t a t i v e p i c t u r e of t h e c o r r e l a t i o n f o r mean t i p displacements measured on t h e 21 degree-of-freedom model and t h e r e a l b u i l d i n g . The model measurements were made a t a r e f e r e n c e speed of 24 m / s i n f u l l - s c a l e terms ( v e l o c i t y s c a l i n g 1:3.55). B u i l d i n g measure- ments a t speeds from 10 t o 30 m / s were f i r s t reduced t o c o e f f i c i e n t form i n mm/(N/m2) by l i n e a r r e g r e s s i o n ; t h e n " b e s t e s t i m a t e s " were c a l c u l a t e d f o r a r e f e r e n c e dynamic p r e s s u r e of 365
N / & .
The h o r i z o n t a l b a r of each c r o s s marks t h e range of wind d i r e c t i o n s included i n each of 20 e s t i m a t e s of E-W displacement ( e a s t p o s i t i v e , 0 = wind from t h e west). The v e r t i c a l b a r g i v e s t h e 95 p e r c e n t confidence band f o r each e s t i m a t e , and t h e c r o s s i n g p o i n t i s t h e b e s t e s t i m a t e of t h e value. The numbers of r e a d i n g s used t o e s t a b l i s h t h e e s t i m a t e s range from 17 t o 198. Note t h a t t h e b u i l d i n g displacements a r e e s s e n t i a l l y a c t u a l measurements t a k e n a t t h e geometric c e n t r e of t h e b u i l d i n g a t a r e f e r e n c e speed of 24 m / s , s i n c e a l a r g e percentage of t h e o b s e r v a t i o n s were made a t speeds of 18 t o 25 m / s .A
s i m i l a r graph f o r comparison w i t h model measurements made a t 45 m / s ( n o t observed on t h e r e a l b u i l d i n g ) gave much t h e same c o r r e l a t i o n s .Figure 12 makes t h e same s o r t of comparison f o r N-S d i s p l a c e m e n t , n o r t h p o s i t i v e , along t h e E-W o r Y a x i s . The v e r t i c a l s c a l e showing displacement i n mm f o r a r e f e r e n c e p r e s s u r e of 365 ~ /
i s
m h a l f t h a t of ~Fig. 11. As s t i f f n e s s i s approximately t h e same i n t h e two d i r e c t i o n s , t h e d e f l e c t i o n should be roughly i n p r o p o r t i o n t o t h e a r e a p r e s e n t e d t o t h e wind, i n t h i s c a s e h a l f a s much f o r t h e N-S f a c e a s f o r t h e E-W face.
The c o r r e l a t i o n between dynamic r e f e r e n c e p r e s s u r e and displacements on t h e b u i l d i n g
i s
much poorer i n t h e N-S d i r e c t i o n , shown by t h e l e n g t h s of t h e v e r t i c a l b a r s of t h e 95 p e r c e n t confidence bands. One reason f o r t h i si s
probably t h e s m a l l e r response t o wind f o r c e r e s u l t i n g from t h e narrower f a c e i n t h e N-S d i r e c t i o n . I n comparing t h e b u i l d i n g d i s p l a c e - ments w i t h t h e model r e s u l t s i t i s tempting t o s p e c u l a t e t h a t some of t h e d i f f e r e n c e s , f o r example ftom about 300 t o 330 deg, might be due t od i f f e r e n c e 8 i n l o c a l wind d i r e c t i o n . Although t h i s i s a p o s s i b i l i t y , i t would be d i f f i c u l t t o v e r i f y , given t h e problems of s i t i n g i n s t r u m e n t s t o map t h e i n c i d e n t wind d i r e c t i o n s i n t h e f i e l d .
8.1 A c c e l e r a t i o n S p e c t r a
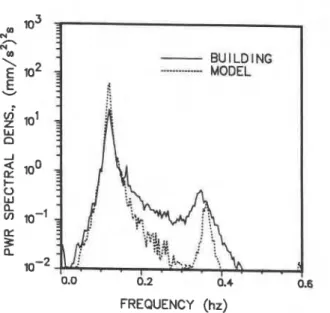
D e t a i l e d s t u d i e s have y e t t o be made of t h e c o r r e l a t i o n s between model and b u i l d i n g a c c e l e r a t i o n s , b u t i t i s p o s s i b l e t o i l l u s t r a t e t h e r e l a t i v e c o n t r i b u t i o n s of t h e f i r s t and h i g h e r modes t o a c c e l e r a t i o n and t o compare b u i l d i n g and model measurements. Power s p e c t r a i n Fig. 13 show s h a r p e r peaks and a g r e a t e r f a l l - o f f of c o n t r i b u t i o n by t h e second mode i n t h e model t h a a i n thC b u i l d i n g . The agreement between b u i l d i n g and model
appears c l o s e r i n t h e E-W coupled modes ( F i g s 1 4 , ' 1 5 ) . The predominantly t r a n s l a t i o n a l lower mode i s i l l u s t r a t e d i n Fig. 14 by t a k i n g t h e sum of E-W a c c e l e r a t i o n s of t h e n o r t h and s o u t h w a l l s , and t h e predominantly r o t a t i o n a l mode i n Fig. 15 by t a k i n g t h e d i f f e r e n c e .
Damping e s t i m a t e d by t h e half-power-bandwidth method
i s
about 2 t o 3 p e r c e n t f o r t h e model and 3 t o 4 p e r c e n t f o r t h e b u i l d i n g . Thed i f f e r e n c e between s t r u c t u r a l damping a l o n e (1 p e r c e n t ) and t o t a l damping f o r t h e model could be p a r t i a l l y a t t r i b u t e d t o aerodynamic damping ( l e s s t h a n 1 per c e n t ) . For t h e b u i l d i n g , t h e v a r i a t i o n of frequency w i t h amplitude would c o n t r i b u t e t o a n a p p a r e n t i n c r e a s e i n damping.
I I N S 1 7
-
-
-
-
-
-
/-
1 I :/ I I I I I N s 2-
d-
-a--
FULL-SCALE-
-
MODEL \ \ I I 'L I l l A M P L I T U D EFigure 10. Measured model and full-scale mode shapes
Wl ND D l RECTl ON
Figure 11. Comparison of model and full-scale east-west mean tip displacements versus wind direction
(0 = building west) for dynamic reference pressure of
365
~ / m 2(24 m/s)
Wl ND D l RECTl ON
Figure 12. Comparison of model and full-scale north-south mean tip displacements versus wind direction
(0 = building west) for dynamic reference pressure of
365
~ / m ~FREQUENCY (hz)
Figure 13. Comparison of model and full-scale north-south acceleration power spectra
-
translational modesFREQUENCY
(hz)
Figure 14. Comparison of model and full-scale east-west acceleration power spectra
-
translational modes emphasizedFREQUENCY (hz)
Figure 15. Comparison of model and full-scale east-west acceleration power spectra
-
rotational modes emphasized9. RELATING
WIND
TUNNEL RESULTS TO BUILDINGSA b a s i c requirement of a c c e p t a b l e p r e d i c t i o n of wind e f f e c t s and b u i l d i n g r e s p o n s e i s r e l i a b l e i n p u t d a t q a p p r o p r i a t e t o t h e b u i l d i n g and t h e s i t e . F i e l d measurements a r e i n v a l u a b l e i n p r o v i d i n g a f t e r - t h e - f a c t check p o i n t s o n s p e c i f i c b u i l d i n g s , b u t i t i s i m p o r t a n t t o acknowledge t h e i r obvious l i m i t a t i o n s . I n a d d i t i o n t o being time-consuming and expensive, f u l l - s c a l e experiments a r e i n h e r e n t l y less d e t e r m i n i s t i c and a c c u r a t e than t h e wind t u n n e l experiments they a r e supposed t o v a l i d a t e .
Where a p p r o p r i a t e d a t a a r e a v a i l a b l e t h e Commerce Court e x p e r i e n c e confirme t h a t model t e s t i n g , a c c o r d i n g t o t h e methods followed i n t h e two l a b o r a t o r i e s u s e d - i n t h e comparisons, w i l l y i e l d r e s u l t s a p p l i c a b l e t o f d , l s c a l e , w i t h i n e x p e r i m e n t a l e r r o r i n some cases. The d i s c r e p a n c i e s t h a t have been d i s c o v e r e d a r e i n d i c a t i o n s t h a t f u r t h e r i n v e s t i g a t i o n i s needed; a t t h i s s t a g e i t would b e premature t o conclude t h a t e i t h e r t h e modelling technique o r t h e r e s u l t i n q u e s t i o n r e q u i r e s c o r r e c t i o n . Comparisons t o d a t e s u g g e s t t h a t because f i e l d o b s e r v a t i o n s a r e s u b j e c t t o s o many u n c o n t r o l l e d v a r i a b l e s t h e r e may be l i t t l e hdpe of p r e d i c t i n g f u l l - s c a l e behaviour t o w i t h i n b e t t e r t h a n about 10 t o 15 p e r c e n t , even when t h e i n p u t d a t a on which t h e model is based a r e a c c u r a t e .
Much remains t o be done i n f u l l y u t i l i z i n g t h e d a t a c o l l e c t e d a t Commerce Court and on t h e models t e s t e d i n t h e NAE 9
m
x 9 m wind t u n n e l , p a r t i c u l a r l y i n t h e m a t t e r of a e r o e l a s t i c response. It i s a l r e a d y c l e a r t h a t t o r s i o n makes i m p o r t a n t c o n t r i b u t i o n s t o t h e a c c e l e r a t i o n s experienced a t t h e n o r t h w a l l of Commerce Court i n comparison w i t h t h o s e of t h e c e n t r a l core.The measurement of peak p r e s s u r e s f o r c l a d d i n g d e s i g n g i v e s rise t o two important concerns: sampling r a t e and i n t e r n a l p r e s s u r e s . Sampling r a t e s on b u i l d i n g s have t o be a t l e a s t 20 p e r second t o c a p t u r e t h e peak v a l u e s of i n t e r e s t , and 30 p e r second would probably be even b e t t e r . S u f f i c i e n t l y h i g h r a t e s a t model s c a l e may be d i f f i c u l t t o achieve. A t l e a s t t e n o b s e r v a t i o n s of i n d i v i d u a l peaks w i l l g e n e r a l l y be needed t o e s t a b l i s h a r e p t e s e h t a t i v e peak c o e f f i c i e n t f o r any g i v e n s u r f a c e p r e s s u r e t a p l o c a t i o n .
I n t e r n a l p r e s s u r e s and i n t e r n a l p r e s s u r e c o e f f i c i e n t s t o d e s c r i b e wind e f f e c t s a r e Also e s s e n t i a l f o r a c c u r a t e assessment of n e t l o a d s on
cladding. There a r e , a s w e l l , o t h e r a p p l i c a t i o n s f o r such i n f o r m a t i o n , f o r example, h e a t and m o i s t u r e t r a n s f e r c a l c u l a t i o n s and t h e d e s i g n of d e t a i l s t o ensure r a i n - t i g h t n e s s of t h e b u i l d i n g envelope. Both f i e l d o b s e r v a t i o n s and development of modelling t e c h n i q u e s t o s i m l a t e porous w a l l s could provide v a l u a b l e a s s i s t a n c e t o s e v e r a l members of t h e d e s i g n team; f u r t h e r development i n t h i s a r e a i s h i g h l y d e s i r a b l e .
ACKNOWLEDGEMENTS
The c o o p e r a t i o n of a g r e a t many o r g a n i z a t i o n s and i n d i v i d u a l s was needed a t v a r i o u s s t a g e s of t h e Commerce Court p r o j e c t . It i s a p l e a s u r e t o acknowledge once a g a i n t h e u n f a i l i n g a s s i s t a n c e of t h e Canadian ~ m p e r i a l
Bank
of Commerce, C a r r u t h e r s & Wallace, S t r u c t u r a l C o n s u l t a n t s , t h e U n i v e r s i t y of Western O n t a r i o Boundary-Layer Wind Tunnel Laboratory, andt h e N a t i o n a l A e r o n a u t i c a l Establishment; and, i n p a r t i c u l a r , of
J.T. Templin, K.R. Cooper, J.H. Rainer and F.K. Hummel. This p a p e r i s a c o n t r i b u t i o n from t h e D i v i s i o n of Building Research, N a t i o n a l Research Council of Canada, and i s p u b l i s h e d w i t h t h e a p p r o v a l of t h e D i r e c t o r of t h e Division.
REFERENCES
1 A.G. Davenport, M. Hogan and N. Isyumov, A s t u d y of wind e f f e c t s on t h e Commerce Court Tower P a r t 1 , U n i v e r s i t y of Western O n t a r i o , London, Canada, Engineering Science Research Report, BLWT-7-69, (1979).
2 W.A. D a l g l i e s h , Comparison of m o d e l / f u l l - s c a l e wind p r e s s u r e s on a high- r i s e b u i l d i n g , J o u r n a l of I n d u s t r i a l Aerodynamics, 1 (1975) 55-66.
3 W.A. D a l g l i e s h and
J.H.
R a i n e r , Measurements of wind induceddisplacements and a c c e l e r a t i o n s of a 57-storey b u i l d i n g i n Toronto, Canada, Proc., 3rd Colloquium on I n d u s t r i a l Aerodynamics, Buildings Aerodynamics, P a r t 2, Aachen, Germany, 14-16 June 1978, pp. 67-78.
4 W.A. D a l g l i e s h , J.T. Templin and K.R. Cooper, Comparisons of wind t u n n e l and f u l l - s c a l e b u i l d i n g s u r f a c e p r e s s u r e s w i t h emphasis on peaks, Wind Engineering Proc., 5 t h I n t e r n a t i o n a l Conference on Wind Engineering, J u l y 1979, (Ed. by J.E. Cermak) 1 (1980), pp. 553-565.
5 J.T. Templin and K.R. Cooper, Design and performance of a multi-degree- of-freedom a e r o e l a s t i c b u i l d i n g model, J o u r n a l of Wind Engineering and I n d u s t r i a l Aerodynamics, 8 (1981) pp. 157-175.
6 J.T. Templin and K.R. Cooper, T o r s i o n a l e f f e c t s on t h e wind-induced r e s p o n s e of a h i g h - r i s e b u i l d i n g , P r e s e n t e d 4 t h U.S. I n t e r n a t i o n a l
Conference on Wind Engineering Research, S e a t t l e , Washington, 26-29 J u l y 1981.
7 W.A. D a l g l i e s h , Assessment of wind l o a d s f o r g l a z i n g d e s i g n , Proc., IAHR/IUTIAM Symposium on P r a c t i c a l Experience w i t h Flow Induced V i b r a t i o n s , K a r l s r u h e , Germany, 3-6 September, 1979, S p r i n g e r Verlag, B e r l i d H e i d e l b e r g (1980) pp. 696-708.
8 L.C.H. Lam and R.P. Lam, An e x p e r i m e n t a l s t u d y of t h e dynamic behaviour of a m u l t i s t o r e y steelAframed b u i l d i n g , Proc., I n s t i t u t i o n of C i v i l Engineers, P a r t 2, September 1979, pp. 707-720.
9 Supplement t o t h e National Building Code of Canada, National Research
Council of Canada, A s s o c i a t e Committee an t h e N a t i o n a l Bulding Code, NRCC 17724, 1980.
T h i s paper, w h i l e b e i n g d i s t r i b u t e d i n r e p r i n t form by t h e D i v i s i o n of B u i l d i n g Research, remains t h e c o p y r i g h t of t h e o r i g i n a l p u b l i s h e r . It should n o t be reproduced i n whole o r i n p a r t w i t h o u t t h e p e r m i s s i o n of t h e p u b l i s h e r . A l i s t of a l l p u b l i c a t i o n s a v a i l a b l e from t h e D i v i s i o n may be o b t a i n e d by w r i t i n g t o t h e P u b l i c a t i o n & S e c t i o n , D i v i s i o n of B u i l d i n g R e s e a r c h , N a t i o n a l R e s e a r c h C o u n c i l of C a n a d a , O t t a w a , O n t a r i o ,