HAL Id: hal-00302555
https://hal.archives-ouvertes.fr/hal-00302555
Submitted on 29 Jan 2007HAL is a multi-disciplinary open access
archive for the deposit and dissemination of sci-entific research documents, whether they are pub-lished or not. The documents may come from teaching and research institutions in France or abroad, or from public or private research centers.
L’archive ouverte pluridisciplinaire HAL, est destinée au dépôt et à la diffusion de documents scientifiques de niveau recherche, publiés ou non, émanant des établissements d’enseignement et de recherche français ou étrangers, des laboratoires publics ou privés.
Source apportionment of the particulate PAHs at Seoul,
Korea: impact of long range transport to a megacity
J. Y. Lee, Y. P. Kim
To cite this version:
J. Y. Lee, Y. P. Kim. Source apportionment of the particulate PAHs at Seoul, Korea: impact of long range transport to a megacity. Atmospheric Chemistry and Physics Discussions, European Geosciences Union, 2007, 7 (1), pp.1479-1506. �hal-00302555�
ACPD
7, 1479–1506, 2007 Source apportionment of the ambient PAHs at Seoul, KoreaJ. Y. Lee and Y. P. Kim
Title Page Abstract Introduction Conclusions References Tables Figures ◭ ◮ ◭ ◮ Back Close
Full Screen / Esc
Printer-friendly Version Interactive Discussion
Atmos. Chem. Phys. Discuss., 7, 1479–1506, 2007 www.atmos-chem-phys-discuss.net/7/1479/2007/ © Author(s) 2007. This work is licensed
under a Creative Commons License.
Atmospheric Chemistry and Physics Discussions
Source apportionment of the particulate
PAHs at Seoul, Korea: impact of long
range transport to a megacity
J. Y. Lee and Y. P. Kim
Dept. of Environmental Science and Engineering, Ewha Womans University, Seoul, Korea Received: 22 November 2006 – Accepted: 2 January 2007 – Published: 29 January 2007 Correspondence to: Y. P. Kim ([email protected])
ACPD
7, 1479–1506, 2007 Source apportionment of the ambient PAHs at Seoul, KoreaJ. Y. Lee and Y. P. Kim
Title Page Abstract Introduction Conclusions References Tables Figures ◭ ◮ ◭ ◮ Back Close
Full Screen / Esc
Printer-friendly Version Interactive Discussion
Abstract
Northeast Asia including China, Korea, and Japan is one of the world’s largest fossil fuel consumption regions. Seoul is a megacity in Northeast Asia and its emissions of air pollutants can affect the region and is also affected by the regional emissions. To understand the degree of this relationship, major sources of ambient particulate PAHs
5
at Seoul, Korea were identified and quantified based on the measurement data be-tween August 2002 and December 2003. The chemical mass balance (CMB) model was applied. Seven major emission sources were identified based on the emission data in Seoul and Northeast Asia: Gasoline and diesel vehicles, coal residential, coke oven, coal power plant, biomass burning, natural gas (NG) combustion. The major
10
source of particulate PAHs at Seoul on the whole measurement period was gasoline and diesel vehicles, accounted for 31% of the measured particulate PAHs levels. How-ever, the source contributions showed distinct seasonal variations. High contributions of biomass burning and coal (residential and coke oven) were shown in fall and winter accounted for 63% and 82% of the total PAHs concentration, respectively. Since these
15
sources were not strong in and around Seoul, these might be related to transport from outside of Seoul, from China and/or North Korea. It implies that the air quality in the large urban city such as Seoul can be influenced by the long range transport of air pollutants such as PAHs.
1 Introduction
20
Polycyclic aromatic hydrocarbons (PAHs) are ubiquitous organic pollutants mainly formed during incomplete combustion processes of fossil fuels. Some of PAHs which mainly exist in the particle phase in the atmosphere are reported to be probable hu-man carcinogens (ATSDR, 1995). Moreover, transformations of PAHs on particles such as nitro-PAHs are more toxic than parent PAHs (Marr et al., 2006; Sasaki et
25
con-ACPD
7, 1479–1506, 2007 Source apportionment of the ambient PAHs at Seoul, KoreaJ. Y. Lee and Y. P. Kim
Title Page Abstract Introduction Conclusions References Tables Figures ◭ ◮ ◭ ◮ Back Close
Full Screen / Esc
Printer-friendly Version Interactive Discussion
tinually since 1900 and PAHs are designated as one of the considered Persistent Toxic Substances (PTS) in central and northeast Asia (Region VII) under the Stockholm con-vention (UNEP, 2002). Recently, heterogeneous reactions of particulate PAHs might be as surrogates for heterogeneous chemistry of many type of organics and such reac-tions could change the particles hydrophilicity in cloud processing (Marr et al., 2006;
5
Esteve et al., 2003, 2004, 2006).
The impact of air pollution in Northeast Asia to the region itself and all over the world has been recognized well. In addition, Northeast Asia is the world’s largest coal consumption region (IEA, 2006). Thus, it has been speculated that emissions and the impact of PAHs would be large from this region.
10
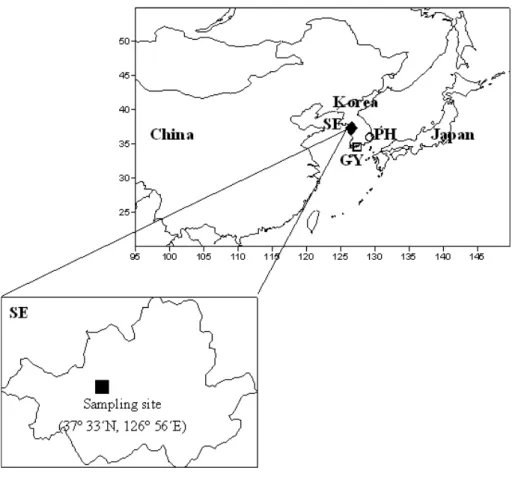
Since Seoul, Korea is one of the mega-city in Northeast Asia with 10 million inhab-itants and 2.5 million vehicles, the large emission of PAHs from Seoul itself might be expected. In addition, South Korea is surrounded by China and Japan as shown in Fig. 1, thus, Seoul might be influenced by transport of air pollutants from these areas in addition to local sources. Thus, understanding the contribution of the various
emis-15
sion sources to the ambient PAHs level in Seoul is essential in order to assess public exposure to PAHs and their associated health risks in Northeast Asia. Moreover, char-acterizing the emission sources of the ambient PAHs in Seoul will help to understand the effect of PAHs emission and transport from the mega-city in this region.
In Korea located in Northeast Asia, the criteria air pollutants such as SO2, NOx,
20
CO, O3, and PM10 (particulate matter with the aerodynamic diameter less than or equal to 10 µm) have been monitored extensively at 198 stations in 2004 (MOE, 2005). However, monitoring of PAHs in Korea has not been well established compared to the criteria air pollutants and their levels have been reported by only few studies (Bae et al., 2002; Park et al., 2002; Lee et al., 2005; Lee et al., 2006a). Bae et al. (2002) and
25
Lee et al. (2006a) have measured the size distributions of particulate PAHs and their dry depositions in 1999 in several areas of Korea. They found that the ambient levels and dry deposition amounts of PAHs in rural areas were comparable to those in Seoul. Park et al. (2002) measured gaseous and particulate PAHs concentrations using a TSP
ACPD
7, 1479–1506, 2007 Source apportionment of the ambient PAHs at Seoul, KoreaJ. Y. Lee and Y. P. Kim
Title Page Abstract Introduction Conclusions References Tables Figures ◭ ◮ ◭ ◮ Back Close
Full Screen / Esc
Printer-friendly Version Interactive Discussion
sampler at Seoul during four intensive sampling periods. However, in these studies, identifications of sources to the ambient PAHs concentrations have been not identified. Further, trend of the PAHs level was not identified in these studies.
Receptor models have been widely used as a tool in air pollution source apportion-ment studies. In the receptor model, the contributions from major sources are
appor-5
tioned from the concentration profiles of pollutants found at a specific receptor site. Fundamentals of the receptor models have been described by Friedlander (1973) and Hopke (1991). The chemical mass balance (CMB) model is a class of receptor model. On the basis of the law of mass conservation, the CMB model calculation seeks to find the best-fit linear combination of the chemical compositions of the effluents from
10
specific emission sources that is needed to reconstruct the chemical composition of chosen atmospheric samples (US EPA, 2004). The CMB model had been applied to the PAHs levels for some studies (Duval et al., 1982; Li et al., 2003). In addition, some CMB applications for ambient organic pollutants including PAHs as tracers for combus-tion sources were attempted in Beijing (Zheng et al., 2005) and southern California
15
(Schauer et al., 1996). However, in Korea, no study has been carried out to apportion the major sources of PAHs.
The objective of this study is to understand the contribution of the major sources for PAH at Seoul by applying the CMB model and to quantify the impact of regional transport of PAHs to the air quality in Seoul.
20
2 Measurement data
Samples were collected on a 3 m high platform on the roof of Asan hall in Ewha Wom-ans University, a five-story building of 15 m height. It is adjacent to a road in west, Mt. Ansan in north, and stands on a hill commanding the campus.
The sampling and analytical procedure used in this study was described in detail
25
in Lee et al. (2006b). Sampling was carried out for 24 h at every sixth day with no rain from August 2002 to December 2003. Total of 68 samples were obtained. The
ACPD
7, 1479–1506, 2007 Source apportionment of the ambient PAHs at Seoul, KoreaJ. Y. Lee and Y. P. Kim
Title Page Abstract Introduction Conclusions References Tables Figures ◭ ◮ ◭ ◮ Back Close
Full Screen / Esc
Printer-friendly Version Interactive Discussion
sampling procedures used in this study conformed to the methods of TO-13A (US EPA, 1999). In brief, a high volume TSP sampler (Ticsh, TE-1000) was operated at a calibrated flow rate of 0.225 m3min−1 to obtain a total sample volume of greater than 300 m3 over the 24 h period. Particles were collected on the pre-baked (at 400◦C for 5 h) quartz fiber filters (QFFs, Whatman, QM-A, 10.16 cm diameter).
5
Particulate PAHs samples collected on the QFFs were extracted by ultrasonication with dichloromethane (DCM) solvent. The extracts were filtrated through a 0.45 µm pore size syringe filter. These extracts were concentrated at 20◦C to a volume of 1 mL using an evaporator (Zymark, Turbovap 500). Then phenanthrene-D10 was added to each concentrated sample solution as an internal standard for analysis.
10
Seventeen PAHs compounds were identified and quantified using a Hewlett Packard 5890 gas chromatograph (GC) equipped with a 5972 mass selective detector (MSD). The names of the analyzed PAH compounds and their abbreviations are given in Ta-ble 1. The QFFs field blanks were prepared and analyzed for each set of field samples with the same procedure. The mean extraction recovery for particulate PAHs ranges
15
from 80 to 94 % and these recoveries are accounted for in the concentration calcu-lation. The accuracy of the analytical procedure was tested through the analysis of National Institute of Standards and Technology (NIST, USA) standard reference mate-rials (SRM) 1649 urban dust sample. The extraction recoveries and analytical accuracy results for the SRM 1649 samples are also presented in Table 1. The extraction and
20
analysis methods adopted in this study gave reliable results.
In this study, 17 PAH compounds were identified and quantified. However, Nap, Ace, Acy, and Flu exist predominantly in the gas phase in the atmosphere. Because the major focus of this study is on the particulate PAHs concentration, these compounds are excluded for further data analysis.
ACPD
7, 1479–1506, 2007 Source apportionment of the ambient PAHs at Seoul, KoreaJ. Y. Lee and Y. P. Kim
Title Page Abstract Introduction Conclusions References Tables Figures ◭ ◮ ◭ ◮ Back Close
Full Screen / Esc
Printer-friendly Version Interactive Discussion
3 CMB modeling and identification of major sources
The CMB 8.2 program (US EPA, 2004) was used to estimate the source contribution of the ambient concentrations for the particulate PAHs. In running the CMB 8.2 model, default values were used for the option sets such as the iteration delta, the maximum source uncertainty and the minimum source projection. The option of source
elimina-5
tion was applied in all results. The diagnostics for the results explained by the CMB model (US EPA, 2004) are given in Table 2.
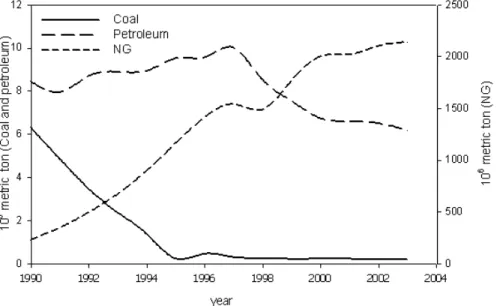
To select probable major sources of PAHs affecting at Seoul, major combustion and related activities at Seoul and Northeast Asia are investigated. In Fig. 2, the temporal trends of consumption for fossil fuels at Seoul between 1990 and 2003 are shown. The
10
Ministry of Environment (MOE) in Korea has limited the use of solid fuel and heavy oils for heating and cooking in the Seoul metropolitan areas (SMA) since 1985 and strongly enforced the rule since 1995 (MOE, 2005). Thus, the amounts of coal consumption for residential, industrial, and commercial sectors at Seoul have been rapidly decreased since 1990 and the usage of coal has been negligible since 1995. The amount of
15
natural gas (NG) consumption at Seoul has been rapidly increased since 1990. The amount of petroleum consumption at Seoul has not been changed much since 1990.
The major types for petroleum were butane (26%), gasoline (25%), diesel (24%), and propane (14%) at Seoul in 2003. These had been mainly used in transportation sector (94% of butane consumption, 99% of gasoline consumption, and 84% of diesel
20
consumption were used for transportation (MOCIE, 2004)). Sixty percent of the total number of vehicles used gasoline vehicle at Seoul followed by diesel (27%) and lique-fied petroleum gas (LPG) (12.5%). The major component of LPG is butane and LPG is used for taxi cabs. About 66% of NG was used in residential sector (heating, cooking, and others) and 22% in commercial sector at Seoul in 2003 (MOCIE, 2004). Thus,
25
the main fossil fuels used at Seoul were petroleum for vehicles and NG for residential heating and cooking.
ACPD
7, 1479–1506, 2007 Source apportionment of the ambient PAHs at Seoul, KoreaJ. Y. Lee and Y. P. Kim
Title Page Abstract Introduction Conclusions References Tables Figures ◭ ◮ ◭ ◮ Back Close
Full Screen / Esc
Printer-friendly Version Interactive Discussion
three major air pollutant emission countries in Northeast Asia (Kim, 1999), are shown. The amounts of coal consumption in Japan and Korea have not been changed much since 1990. However, that in China has been rapidly increased since 2000. Moreover, the consumption of coal in China was the first in the world (about 34% of the world consumption in 2003) and about one order higher than those in Korea and Japan (BP,
5
2005). Thus, the influence of PAHs emission from coal combustions in China might influence the PAHs level in Korea significantly. Coal was mainly used for industry (49%), power plant (37%), and residential (14%) at China in 1995 (Streets et al., 2001). Streets et al. (2001) reported that BC emissions arose primarily from the production and use of coke in the steel industry and from uncontrolled coal-fired stokers in the industry sector.
10
As mentioned before, because PAHs are associated with BC, coke oven in steel work might be an important source of PAHs in the industry sector.
In case of petroleum (Fig. 3b), the amounts of petroleum consumption in Japan and Korea has not been changed much while that in China has been constantly in-creased since 1990. Total consumption of petroleum in Japan has been three of four
15
times higher than in China and Korea in the early 1990s, but, petroleum consumption in China became larger than that in Japan in 2003. The fractions of the petroleum consumption in China and Japan in 2003 were 8.2 and 6.4% of the world consump-tion, respectively (BP, 2005). The major product groups for petroleum consumption in China and Japan were gasoline and middle distillates (about 57 and 68% of the total
20
petroleum consumption, respectively) in 2003 (BP, 2005). Gasoline sector consisted of aviation and motor gasoline and light distillate feedstock. Middle distillates sector con-sisted of jet and heating kerosine, and gas and diesel oils. Although some heating fuels were included in the gasoline and middle distillates sectors, majority of petroleum be consumed for transport, especially, gasoline and diesel vehicles. In Korea, major
prod-25
ucts for petroleum consumption were naphtha (35% of the total consumption), diesel (20%), bunker-C (15%), and gasoline (8%) in 2003 (MOCIE, 2005). The NG consump-tion in Japan has been about three times higher than those in China and Korea since 1990 and the temporal trend were similar among China, Japan, and Korea (Fig. 3c).
ACPD
7, 1479–1506, 2007 Source apportionment of the ambient PAHs at Seoul, KoreaJ. Y. Lee and Y. P. Kim
Title Page Abstract Introduction Conclusions References Tables Figures ◭ ◮ ◭ ◮ Back Close
Full Screen / Esc
Printer-friendly Version Interactive Discussion
Biomass burning activities have been wide spread in Asia; field burning after harvest, biofuel burning in rural areas for heating and cooking, and forest fire (Streets et al., 2003; Zheng et al., 2005; Lee et al., 2006a). The estimated annual amounts of biomass burned in whole Asia, China, Japan, and Korea were 727.3, 187, 3, and 1.9 Tg per year (Streets et al, 2003). Thus, China emitted 25.6% of the total biomass emissions
5
in Asia. Thus, high contribution from biomass burning for PAHs in Northeast Asia including Seoul might be also expected.
Based on the fuel consumption patterns at Seoul and the countries in Northeast Asia, seven major PAHs sources were selected; petroleum for (1) gasoline and (2) diesel vehicles, coal for (3) residential heating, (4) coke oven emission, and (5) power
10
plant, NG for (6) residential heating, and (7) biomass burning.
Fully developed local source profiles for Seoul and Northeast Asia are not available and the profiles in each country should be different. Thus, in this study, the best avail-able estimates of the source profiles from previous studies in worldwide were adopted. Catalyst-equipped gasoline vehicle profile is used because leaded gasoline has been
15
phased out since 1988 at Seoul (MOE, 2005). In China, Euro I emission standard for whole China and Euro II standard for metropolitan areas were adopted (He et al., 2001).
Butane was one of the major petroleum products used in Seoul for transportation. However, there is no available source profile for butane. Since the estimated PAHs
20
emission amount from LPG consisting of butane was about one-tenth of that from gaso-line in Korea (SNU, 2000) and the combustion efficiencies for butane and NG are very high, we does not include it in the analysis.
The source profiles of coal related emissions were obtained from Li et al. (2003) for power plant and residential and from Yang et al. (2002) for coke oven. The source
pro-25
files for gasoline and diesel vehicles were from Rogge et al. (1993a), biomass burning from Rogge et al. (1993b), and NG combustion from Rogge et al. (1998). These source profiles used in this study are summarized in Table 3. The source profiles are fractional compositions of individual PAH compounds and, thus, the sum of source profile value
ACPD
7, 1479–1506, 2007 Source apportionment of the ambient PAHs at Seoul, KoreaJ. Y. Lee and Y. P. Kim
Title Page Abstract Introduction Conclusions References Tables Figures ◭ ◮ ◭ ◮ Back Close
Full Screen / Esc
Printer-friendly Version Interactive Discussion
for all PAH compounds is unity for each of the sources.
Due to the lack of sufficient data for DahA and Ind in the used source profiles and strong photodegradation of BaP and Anthr, these compounds were not selected as the fitting species in running the model. The source profiles used in this study contained only particulate phase PAHs. For uncertainties of the source profiles, 15% of the
re-5
ported values were used since no information was reported on the accuracy of the values (Na, 2001; Zheng et al., 2005).
The ambient measurement data of particulate PAHs from August 2002 to December 2003 were used for the source apportionment study. In this study, to account for the loss of PAHs concentrations due to photodegradation and/or ozonolysis of the PAHs,
10
the concentrations of individual PAHs compounds were normalized to that of BeP since photodegradation and ozonolysis of BeP would not be large compared to other com-pounds. For example, half-live of BeP under the simulated atmospheric condition was one order higher than that of BaP and Anthr (Katz et al., 1979). The uncertainties for the ambient data were used 15% (the variation of the measurement) of the
con-15
centration for individual PAH compounds since the uncertainity for the MDLs value of individual PAH compounds were very small.
4 Results and discussion
4.1 General characteristics
The CMB model was applied for the whole period and four seasons, respectively.
20
Collinearity problem was not observed during the modeling due to the distinctively dif-ferent marker species of the each source profiles. The statistical values for the model performance of this study were arranged in Table 2. Except summer, all of the statistical values in this study were in the acceptable ranges. In summer, due to the high photo-chemical reactions, these variations were out of range values. The degrees of freedom
25
ACPD
7, 1479–1506, 2007 Source apportionment of the ambient PAHs at Seoul, KoreaJ. Y. Lee and Y. P. Kim
Title Page Abstract Introduction Conclusions References Tables Figures ◭ ◮ ◭ ◮ Back Close
Full Screen / Esc
Printer-friendly Version Interactive Discussion
to 8 in all results (n=68)) since the number of fitting species were limited. Due to the problem to accurately separate the contribution of gasoline and diesel vehicle emission at Seoul using the source profiles for USA, the sum of the contributions of gasoline and diesel vehicles was reported as transport in this study.
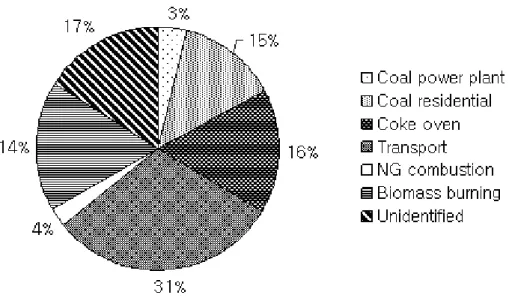
Six sources for particulate PAHs at Seoul on annual basis were identified by the
5
CMB model as shown in Fig. 4. The major source of particulate PAHs was trans-port (31±22%), coke oven (16±7%), coal residential (15±9%), and biomass burning (14±15%). NG combustion (4±6%) and coal power plant (3±1%) were minor sources for the PAHs level at Seoul on the annual base.
Even on the seasonal base, the contributions from the coal power plant and NG were
10
small. This is due to the high efficiency of combustion and particle control equipments in coal power plants and high efficiency combustion in NG combustion. The small contribution of NG combustion was also found by Zheng et al. (2002) and Schauer et al. (1996) in southeastern US. Thus, it is likely that the contribution from LPG be also small as stated in Sect. 3.
15
Zhang et al. (2005) carried out a source apportionment study for Beijing, China with more than 100 organic carbon (OC) species including some PAH compounds. The ma-jor sources for OC species in Beijing were gasoline and diesel vehicles (17.3±6.9 %), biomass burning (16.1±18.1%), dust (11.7±8.1%), and coal combustion (9.8±3.9%). The contribution of vehicles for OC species was also the highest on the annual base in
20
Zhang et al. (2005).
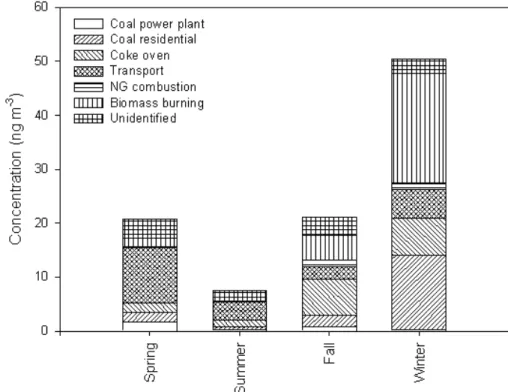
The source contributions showed distinct seasonal variation (Fig. 5). The PAHs con-centrations from transport emissions varied widely from 2.30 to 10.3 ng m−3(10∼49% of the total PAHs concentrations) at Seoul. The transport emissions were most district in spring (49%).
25
4.2 Effect of biomass burning
The contribution of biomass burning was distinct in fall and winter, accounting for 4.51 ng m−3 (21%) in fall and 20.3 ng m−3 (40%) in winter, respectively. No
signifi-ACPD
7, 1479–1506, 2007 Source apportionment of the ambient PAHs at Seoul, KoreaJ. Y. Lee and Y. P. Kim
Title Page Abstract Introduction Conclusions References Tables Figures ◭ ◮ ◭ ◮ Back Close
Full Screen / Esc
Printer-friendly Version Interactive Discussion
cant biomass burning contributions for PAHs was found in spring and summer. The importance of the biomass burning to air quality in Northeast Asia was reported by several measurement and emission estimation studies related to the frequent biomass burning activities after harvesting during fall (He et al., 2001; Zheng et al., 2005; Lee et al., 2006a). Also, forest fires, representing one of biomass burning were frequent in
5
spring all over Northeast Asia (Lee et al., 2005). However, the highest biomass burn-ing contribution was estimated in winter in this study. In order to verify the contribution of biomass burning in fall and winter, we tried to find the another particulate PAHs emission profile for biomass burning and only one suitable data set was obtained from Schauer et al. (2001). Recently, some studies for biomass burning profile including
10
PAH compounds were reported in Europe, but these showed the result of total (gas + particle) PAHs profile (e.g., Hedberg et al., 2002; Ross et al., 2002). When the source profile from Schauer et al. (2001) was used instead of the profile used in this study, the source contributions for particulate PAHs was also high in fall and winter.
Moreover, forest fires during sampling day in spring and summer were not distinctly
15
observed in Northeast Asia (ATSR world fire atlas in Ionia web site, http://dup.esrin. esa.int/ionia/wfa/index.asp). Thus, it might be related to the heavy usage of biofuel during winter rather than forest fires in Northeast Asia, especially, in China. Biofuel dominated rural residential energy supply and BC emission from biofuel was estimated to 45% of total in residential sector in China. Moreover, the BC emission from biomass
20
burning in residential sector in China was about seven times higher than that in field combustion (Streets et al., 2001).
The remaining question is the degree of contribution from China from biomass burn-ing. An indirect indicator is the PAHs level observed at Gosan, a background site in Korea. Lee et al. (2006b) reported that the average level of particulate PAHs in cold
25
period (from November to March between 2001 and 2004) was 6.43±5.74 ng m−3with the maximum value of 20.9 ng m−3 at Gosan. They claimed that most of the observed PAHs were from China based on the backward trajectory analysis and the ratio values of individual PAH compounds. This concentration level observed at Gosan is smaller
ACPD
7, 1479–1506, 2007 Source apportionment of the ambient PAHs at Seoul, KoreaJ. Y. Lee and Y. P. Kim
Title Page Abstract Introduction Conclusions References Tables Figures ◭ ◮ ◭ ◮ Back Close
Full Screen / Esc
Printer-friendly Version Interactive Discussion
than the estimated average value of biomass contribution in winter (20.3 ng m−3) at Seoul. Thus, it suggests that not all of the estimated biomass burning contribution in winter at Seoul were influenced by China and/or the transport pattern from China to Seoul was different from that to Gosan due to shorter distance between China and Seoul.
5
One possible PAHs source is North Korea. The information for the biomass burning in North Korea are not available, but, high emission of PAHs from biofuel in North Korea is also expected during winter. According to the report of IEA (2006), the amount of primary solid biomass used for fuel in 2003 was 42 795 GWh in North Korea, about three times higher than that in South Korea, although the oil consumption in North
10
Korea is far lower than that in South Korea, 1680 and 208 264×103tonnes, respectively (IEA, 2006). In the report of IEA (2006), there is no consumption of NG in 2003 in North Korea.
4.3 Effect of coal combustion
The contribution of coal for residential usage increased drastically in winter (28%)
com-15
pared to other seasons (8–10%). The amount of coal residential in winter (13.7 ng m−3) was about one order higher than that in other season (0.62–2.14 ng m−3) mainly due to the residential heating during winter. This finding is in agreement with the result by Zheng et al. (2005), in which the importance of coal combustion became obvious in January accounting 13.9% of the measured OC species in January at Beijing.
How-20
ever, in the result of Zheng et al. (2005), the contribution of coal combustion was also high in October (12.7%). In this study, the contribution of coal residential was rela-tively low in fall (10%) compared to winter (28%). This is probably due to the impact of coal combustion in Beijing being local emissions while that Seoul being transport from outside.
25
The major fossil fuel for residential heating at Seoul and surrounding areas is NG. Thus, the influence of PAHs emission from coal residential might be transported from
ACPD
7, 1479–1506, 2007 Source apportionment of the ambient PAHs at Seoul, KoreaJ. Y. Lee and Y. P. Kim
Title Page Abstract Introduction Conclusions References Tables Figures ◭ ◮ ◭ ◮ Back Close
Full Screen / Esc
Printer-friendly Version Interactive Discussion
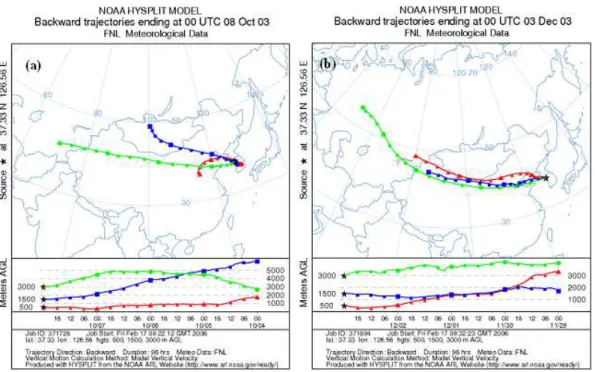
the outside of Korea, especially from China due to the high consumption of coal for res-idential heating and cooking (He et al., 2001; Streets et al., 2001) and dominant wind direction being the westerly and northwesterly during winter as shown in Fig. 6 (Lee et al., 2006b). The backward trajectory of air parcels were calculated for 09:00 LT (sam-pling starting time) on the sam(sam-pling days using the Hybrid Single-Particle Lagrangian
5
Intergrated Trajectory (HYSPLIT4) model (http://www.arl.noaa.gov/ready/hysplit4.html) developed in National oceanic and atmospheric administration (NOAA).
Moreover, the contribution of PAHs from coal in North Korea might be significant. The coal consumption in South Korea was two times higher than that in North Korea, but, about 89% of total coal was consumed at power plants in South Korea (IEA, 2006).
10
In North Korea, about 85% of total coal was consumed by industry sector and the coal consumption from industry sector in North Korea was three times higher compared to South Korea (IEA, 2006). As mentioned in Sect. 4.1, the emission of PAHs from the coal combustion power plant was small due to high combustion efficiency and particle control equipments. Thus, the contribution of coal combustion from South Korea might
15
be small. While, there is a possibility that a significant fraction of the contribution from coal combustion be from North Korea in addition to the contribution from biomass burning.
The high contribution of PAHs concentrations from coke oven was observed in fall (6.64 ng m−3, 31%) and winter (6.98 ng m−3, 14%). In Korea, two steel works having
20
coke oven were located at south-east (Pohang) and south-west (Gwangyang) of Korea shown in Fig. 1. The main directions of the wind at Pohang and Gwangyang were from southwest and northwest, respectively. In China, representative steel works are mainly located near to Beijing and Shanghai (Price et al., 2002). Moreover, the prevailing wind was the northwesterlies observed during the sampling period in fall and winter as
25
shown in Fig. 6. The wind directions were variable in spring and summer. According to Streets et al. (2001), the BC emissions from coal in industry sector were 84% of total in China and this were mainly related to the production and use of coke in the steel works. Thus, it might be related to the transport from China not rather than the influence of
ACPD
7, 1479–1506, 2007 Source apportionment of the ambient PAHs at Seoul, KoreaJ. Y. Lee and Y. P. Kim
Title Page Abstract Introduction Conclusions References Tables Figures ◭ ◮ ◭ ◮ Back Close
Full Screen / Esc
Printer-friendly Version Interactive Discussion
local emissions in Korea. Also, the influence of coke oven emission from North Korea is expected.
Because the coal residential profile used in this study was obtained for Europe, these might not be an accurate indicator to explain the influence from China. Thus, we tried to find PAHs emission profile from residential coal combustion measured in Northeast
5
Asia, especially in China and only one suitable data set was obtained from Chen et al. (2004). When the source profile from Chen et al. (2004) was used instead of the profile used in this study, the seasonal trend of the source contributions for particulate PAHs was similar with this study result. But, there were some statistical problems such as the values of2being higher compared to the original result. It indicates that some
10
PAH compounds concentrations were not well explained by the source contribution estimates of Chen et al. (2004). Thus, the source profile for coal residential shown in Table 3 by Li et al. (2003) was used in this study.
4.4 Implication
The high concentrations of particulate PAHs in winter at Seoul were mainly due to the
15
increase of the emissions from biomass burning, the coal residential heating, and coke oven. These account for 82% of the total PAHs concentration and mainly transported from outside of Seoul, especially China. Moreover, the influence of PAHs emission from North Korea is expected even.
Seoul is the largest city in Korea, however, the long range transport of air pollutants
20
such as PAHs was clearly observed. Therefore, in order to control the level of haz-ardous air pollutants such as PAHs at urban areas, the transport from outside of urban areas as well as the local emission source must be considered. Further, the interna-tional convention such as Stockholm convention should be needed for managing the level of PTS and health effect in global environment. Another implication is the
poten-25
tial impacts on climate change such as radiation balance because PAHs are associated with BC particles and the atmospheric behavior of PAHs is changed by the long-range transport from Northeast Asia.
ACPD
7, 1479–1506, 2007 Source apportionment of the ambient PAHs at Seoul, KoreaJ. Y. Lee and Y. P. Kim
Title Page Abstract Introduction Conclusions References Tables Figures ◭ ◮ ◭ ◮ Back Close
Full Screen / Esc
Printer-friendly Version Interactive Discussion
It is important to note that application of local source profiles is the key for reli-able CMB results. Uncertainty is inevitreli-able when not using source profiles from local sources. Thus, further study is warranted to reduce the uncertainties related to the source profiles.
5 Summary
5
Seoul is a large city itself, besides, closely surrounded by China and Japan which have several mega-cities. Thus, Seoul might be influenced by transport of air pollutants from these areas in addition to local sources. The CMB model was used to apportion the major sources of particulate PAHs at Seoul based on the patterns of fossil fuel consumption in Seoul and Northeast Asia. The major source of particulate PAHs at
10
Seoul on an annual basis was gasoline and diesel vehicles accounting for 31% of total particulate PAHs. The source contributions of PAHs showed distinct seasonal variation. Coal emission (residential and coke oven) and biomass burning became important in fall (63% of total PAHs) and winter (82% of total PAHs). Since these sources were strong in China and the prevailing wind was the northwesterlies observed
15
during sampling period in fall and winter, it might be transported from the outside of Korea, especially from China. Moreover, the influence of PAHs emission from North Korea is expected.
Mega-cities in Asia are significant sources for air pollutants. Thus, the project named mega-cities: Asia managed from NOAA is going on to investigate the contribution of
20
pollutant emissions from Asian mega-cities to local and regional air quality. Related to the project of mega-cities: Asia, this study implies that even the large urban city such as Seoul can be influenced by the long range transport of air pollutants such as PAHs emitted from the outside of Seoul, especially other mega cities. Thus, the transport from outside of urban areas must be considered even at urban areas in order to control
25
the level of PTS such as PAHs at urban areas.
Founda-ACPD
7, 1479–1506, 2007 Source apportionment of the ambient PAHs at Seoul, KoreaJ. Y. Lee and Y. P. Kim
Title Page Abstract Introduction Conclusions References Tables Figures ◭ ◮ ◭ ◮ Back Close
Full Screen / Esc
Printer-friendly Version Interactive Discussion
tion(KOSEF) through the National Research Lab. Program funded by the Ministry of Science and Technology (No. M10600000221-06J0000-22110). The authors thanks to NOAA, USA for the backward trajectory analysis service.
References
ATSDR, Agency for Toxic Substances and Disease Registry:Toxicological profile for polycyclic
5
aromatic hydrocarbons. Atlanta, GA, USA, 1995.
BP: Statistical review of world energy 2005 (available at: http://www.bp.com/downloads.do?
categoryId=9003093\&contentId=7005944), 2005.
Butler, H. T. and Crossley, P.: Reactivity of polycyclic aromatic hydrocarbons adsorbed on soot particles, Atmos. Environ.,15, 91–94, 1981.
10
Chen, Y., Bi, X., Mai, B., Sheng, G., and Fu, J.: Emission characterization of particu-late/gaseous phases and size association for polycyclic aromatic hydrocarbons from resi-dential coal combustion, Fuel, 83, 781–790, 2004.
Duval, M. M. and Friedlander, S. K.: Source resolution of polycyclic aromatic hydrocarbons in the Los Angeles atmosphere: Application of a chemical species balance method with
15
first-order chemical decay, EPA-600/S2-81-161, US, 1982.
Friedlander, S. K.: Chemical element balances and identification of air pollution sources, Envi-ron. Sci. Technol., 7, 235–240, 1973.
He, K., Yang, F., Ma, Y., Zhang, Q., Yao, X., Chan, C. K., Cadle, S., Chan, T., and Mulawa, P.: The characteristics of PM2.5in Beijing, China, Atmos. Environ., 35, 4959–4970, 2001.
20
Hedberg, E., Kristensson, A., Ohlsson, M., Johansson, C., Johansson, P.- ˚A., Swietlicki, E., Vesely, V., Wideqvist, U., and Westerholm, R.: Chemical and physical characterization of emissions from birch wood combustion in a wood stove, Atmos. Environ., 36, 4823–4837, 2002.
Hopke, P. K.: Receptor modeling for air quality management. Elsevier Press, Amsterdam, The
25
Netherlands, 1991.
IEA, International Energy Agency: Energy statistics (available athttp://www.iea.org/Textbase/
stats/index.asp), 2006.
Katz, M., Chan, C., Tosine, H., and Sakuma, T.: Relative rates of photochemical and biological oxidation (in vitro) of polycyclic aromatic hydrocarbons. in: Poly Nuclear Aromatic
ACPD
7, 1479–1506, 2007 Source apportionment of the ambient PAHs at Seoul, KoreaJ. Y. Lee and Y. P. Kim
Title Page Abstract Introduction Conclusions References Tables Figures ◭ ◮ ◭ ◮ Back Close
Full Screen / Esc
Printer-friendly Version Interactive Discussion
carbons, edited by: Jones, P. W. and Leber, P., 171–189, Butterworth-Heinemann, Woburn, Mass., 1979.
Kim, Y. P.: Air quality in Northeast Asia with emphasis on China (in Korean), J. Korean Soc. Atmos. Environ., 15, 211–217, 1999.
Lee, J. Y., Kim, Y. P., and Yi, S. M.: Size distributions and dry deposition fluxes of particulate
5
Polycyclic Aromatic Hydrocarbons (PAHs) at several sites in Korea in 1999, Environ. Eng. Sci., 23, 393–404, 2006a.
Lee, J. Y., Kim, Y. P., Kang, C. H., Ghim, Y. S., and Kaneyasu, N.: Temporal trend and long range transport of particulate PAHs at Gosan in Northeast Asia between 2001 and 2004, J. Geophys. Res., 111, D11303, doi:10.1029/2005JD006537, 2006b.
10
Lee, K. H., Kim, J. E., Kim, Y. J., Kim, J. H., and von Hoyningen-Huene, W.: Impact of the smoke aerosol from Russian forest fires on the atmospheric environment over Korea during May 2003, Atmos. Environ., 39, 85–99, 2005.
Li, A., Jang, J. K., and Scheff, P. A.: Application of EPA CMB8.2 model for source apportionment of sediment PAHs in Lake Calumet, Chicago, Environ. Sci. Technol., 37, 2958–2965, 2003.
15
MOCIE, Ministry of Commerce, Industry and Energy, Korea: Yearbook of regional energy statis-tics, Korea, 2004.
MOCIE, Ministry of Commerce, Industry and Energy, Korea: Yearbook of energy statistics, Korea, 2005.
MOE, Ministry of Environment, Korea: Annual report of air quality in Korea 2004, Korea, 2005.
20
Na, K: Characteristics of atmospheric volatile organic compounds in Seoul: Measurements and chemical mass balance receptor modeling. Ph. D thesis, Yonsei university, Korea, 2001. Price, L., Sinton, J., Worrell, E., Phylipsen, D., Xiulian, H., and Ji, L.: Energy use and carbon
dioxide emissions from steel production in China, Energy, 27, 429–446, 2002.
Rogge, W. F., Hidlemann, L. M., Mazurek, M. A., Cass, G. R., and Simoneit, B. R. T.: Sources
25
of fine organic aerosol. 2. Noncatalyst and catalyst-equipped automobiles and heavy duty diesel trucks, Environ. Sci. Technol., 27, 636–651, 1993a.
Rogge, W. F., Hidlemann, L. M., Mazurek, M. A., Cass, G. R., and Simoneit, B. R. T.: Sources of fine organic aerosol. 5. Natural gas home appliances. Environ, Sci. Technol. 27, 2736–2744, 1993b.
30
Rogge, W. F., Hidlemann, L. M., Mazurek, M. A., and Cass, G. R.: Sources of fine organic aerosol. 9. Pine, oak, and syhthetic log combustion in residential fireplaces, Environ. Sci. Technol., 32, 13–22, 1998.
ACPD
7, 1479–1506, 2007 Source apportionment of the ambient PAHs at Seoul, KoreaJ. Y. Lee and Y. P. Kim
Title Page Abstract Introduction Conclusions References Tables Figures ◭ ◮ ◭ ◮ Back Close
Full Screen / Esc
Printer-friendly Version Interactive Discussion
Ross, A. B., Jones, J. M., Chaiklangmuang, S., Pourkashanian, M., Williams, A., Kubica, K., Andersson, J. T., Kerst, M., Danihelka, P., and Bartle, K. D.: Measurement and prediction of the emission of pollutants from the combustion of coal and biomass in a fixed bed furnace, Fuel, 81, 571–582, 2002.
Schauer, J. J., Rogge, W. F., Hildemann, L. M., Mazurek, M. A., and Cass, G. R.: Source
5
apportionment of airborne particulate matter using organic compounds as tracers, Atmos. Environ., 30, 3837–3855, 1996.
Schauer J. J., Kleeman, M. J., Cass, G. R., and Simoneit, B. R. T.: Measurement of emissions from air pollution sources. 3. C1-C29 Organic compounds from fireplace combustion of wood, Environ. Sci. Technol., 35, 1716–1728, 2001.
10
Seoul: An environmental white paper in 2003: Environment of Seoul, Seoul, 2003.
SNU, Seoul National University: The influence and plan of domestic industries for the global agreement of POPs, Korea, 2000.
Streets, D. G., Gupta, S., Waldhoff, S. T., Wnag, M. Q., Bond, T. C., and Yiyun, B.: Black carbon emissions in China, Atmos. Environ., 35, 4281–4296, 2001.
15
Streets, D. G., Yarber, K. F., Woo, J.-H., and Carmichael, G. R.: Biomass burning in Asia: Annual and seasonal estimates and atmospheric emissions, J. Geophys. Res., 17, 1099, doi:10.1029/2003GB002040, 2003.
UNEP, United Nations Environment Programme: Regionally based assessment of persistent toxic substances, Central and North East Asia regionally report. Global Environment
Fa-20
cility, URR (http://www.chem.unep.ch/pts/regreports/C\&NE%20Asia%20full%20report.pdf), 2002.
US EPA, Environmental Protection Agency: Determination of polycyclic aromatic hydrocarbons (PAHs) in ambient air using gas chromatography/mass spectrometry (GC/MS). EPA publica-tion No. EPA/625/R-96/010b, Cincinnati, OH, 1999.
25
US EPA, Environmental Protection Agency: EPA-CMB8.2 Users manual. EPA publication No. EPA-452/R-04-011, Research Triangle Park, NC, 2004.
Yang, H. H., Lai, S. O., Hsieh, L. T., Hsueh, H. J., and Chi, T.: Profiles of PAH emission from steel and iron industries, Chemosphere, 48, 1061–1074, 2002.
Zheng, M., Cass, G. R., Schauer, J. J., and Edgerton, E. S.: Source apportionment of PM2.5
30
in the southeastern United States using solvent-extractable organic compounds as tracers, Environ. Sci. Technol., 36, 2361–2371, 2002.
ACPD
7, 1479–1506, 2007 Source apportionment of the ambient PAHs at Seoul, KoreaJ. Y. Lee and Y. P. Kim
Title Page Abstract Introduction Conclusions References Tables Figures ◭ ◮ ◭ ◮ Back Close
Full Screen / Esc
Printer-friendly Version Interactive Discussion
R.: Seasonal trends in PM2.5 source contributions in Beijing, China, Atmos. Environ. 39, 3967–3976, 2005.
ACPD
7, 1479–1506, 2007 Source apportionment of the ambient PAHs at Seoul, KoreaJ. Y. Lee and Y. P. Kim
Title Page Abstract Introduction Conclusions References Tables Figures ◭ ◮ ◭ ◮ Back Close
Full Screen / Esc
Printer-friendly Version Interactive Discussion
Table 1. Particulate PAHs extraction recovery and analysis results of the NIST SRM-1649
urban dust samples.
PAH compounds Abbrev. Recovery (%) Certified value Measured value (µg kg−1) (µg kg−1) Naphthalene Naph 91 – – Acenaphthylene Acy 84 – – Acenaphthene Ace 84 – – Fluorene Flu 91 – – Phenanthrene Phen 80 4.14±0.37 4.67±0.49 Anthracene Anthr 90 0.43±0.08 0.46±0.06 Fluoranthene Flt 91 6.45±0.18 5.50±0.18 Pyrene Pyr 94 5.29±0.25 4.37±0.22 Benz(a)anthracene BaA 83 2.21±0.07 1.84±0.59 Chrysene Chry 87 3.05±0.06 3.67±0.54 Benzo(b)fluoranthene BbF 90 6.45±0.64 5.43±0.40 Benzo(k)fluoranthene BkF 86 1.91±0.03 2.27±0.29 Benzo(e)pyrene BeP 84 – – Benzo(a)pyrene BaP 86 2.51±0.09 2.92±0.82 Indeno(1,2,3-c,d)pyrene Ind 88 3.18±0.72 2.87±0.66 Dibenz(a,h)anthracene DahA 92 0.29±0.02 0.35±0.04 Benzo(g,h,i)perylene BghiP 88 4.01±0.91 3.68±0.69
ACPD
7, 1479–1506, 2007 Source apportionment of the ambient PAHs at Seoul, KoreaJ. Y. Lee and Y. P. Kim
Title Page Abstract Introduction Conclusions References Tables Figures ◭ ◮ ◭ ◮ Back Close
Full Screen / Esc
Printer-friendly Version Interactive Discussion
Table 2.Target values and modeling result values for the model performance measures (target
values were set by US EPA, 2004).
Parameter Target This study
Whole period Spring Summer Fall Winter R square (r2) 0.8 to 1.0 0.94±0.06 0.95±0.03 0.90±0.04 0.93±0.05 0.99±0.01 Chi square (χ2) <4.0 2.66±2.35 1.79±1.36 4.72±2.24 3.52±2.38 0.68±0.67 Percent mass (%) 100±20 83±10 82±4 72±9 83±9 94±2 Degrees of freedom (DF) >5 5±1 (n=68)
C/M ratio (Calculated/Measured) 0.5 to 2.0 0.96±0.26 (n=680) R/U ratio (Residuals/Uncertainties) –2.0 to 2.0 –0.39±1.39 (n=680)
ACPD
7, 1479–1506, 2007 Source apportionment of the ambient PAHs at Seoul, KoreaJ. Y. Lee and Y. P. Kim
Title Page Abstract Introduction Conclusions References Tables Figures ◭ ◮ ◭ ◮ Back Close
Full Screen / Esc
Printer-friendly Version Interactive Discussion
Table 3.Source composition of individual PAH compounds in the particle phase used for source
profiles.
Coal Petroleum
Power plant Coke oven Residential Gasoline vehicle Diesel vehicle NG combustion Biomass burning Phen 0.142 0.124 0.333 0.035 0.165 0.002 0.067 Anthr 0.016 0.024 0.070 0.004 0.022 0.000 0.010 Flt 0.160 0.084 0.216 0.078 0.176 0.167 0.127 Pyr 0.140 0.110 0.085 0.098 0.305 0.161 0.166 BaA 0.099 0.245 0.044 0.075 0.049 0.090 0.066 Chry 0.191 0.069 0.064 0.149 0.134 0.436 0.247 BbF 0.073 0.130 0.064 0.114 0.039 0.052 0.063 BkF 0.015 0.020 0.030 0.078 0.036 0.071 0.069 BeP 0.061 0.063 0.025 0.078 0.035 0.021 0.047 BaP 0.035 0.010 0.034 0.075 0.018 NAa) 0.068 Ind 0.025 0.023 0.018 0.018 NDb) NAa) 0.013 DahA 0.005 0.008 NAa) 0.013 NDb) NAa) 0.007 BghiP 0.039 0.089 0.016 0.184 0.022 NAa) 0.052 a)
NA: Not analyzed,b)ND: Not detected.
The values of source composition for individual PAH compounds were normalized to total PAHs concentration in each source.
References for the source profiles: Coal for power plant and residential – Li et al. (2005), coke oven – Yang et al. (2002), gasoline and diesel vehicles. – Rogge et al. (1993a), NG combustion – Rogge et al. (1998), and biomass burning – Rogge et al. (1993b).
ACPD
7, 1479–1506, 2007 Source apportionment of the ambient PAHs at Seoul, KoreaJ. Y. Lee and Y. P. Kim
Title Page Abstract Introduction Conclusions References Tables Figures ◭ ◮ ◭ ◮ Back Close
Full Screen / Esc
Printer-friendly Version Interactive Discussion
Fig. 1. Map of the sampling site (SE) and coke oven locations (PH and GY) in Korea. (SE:
ACPD
7, 1479–1506, 2007 Source apportionment of the ambient PAHs at Seoul, KoreaJ. Y. Lee and Y. P. Kim
Title Page Abstract Introduction Conclusions References Tables Figures ◭ ◮ ◭ ◮ Back Close
Full Screen / Esc
Printer-friendly Version Interactive Discussion
Fig. 2. Temporal trend of the consumption for fossil fuels at Seoul (MOCIE, 2004). Petroleum
ACPD
7, 1479–1506, 2007 Source apportionment of the ambient PAHs at Seoul, KoreaJ. Y. Lee and Y. P. Kim
Title Page Abstract Introduction Conclusions References Tables Figures ◭ ◮ ◭ ◮ Back Close
Full Screen / Esc
Printer-friendly Version Interactive Discussion
Fig. 3. Temporal trend of (a) coal, (b) petroleum, and (c) NG consumption in China, Japan,
ACPD
7, 1479–1506, 2007 Source apportionment of the ambient PAHs at Seoul, KoreaJ. Y. Lee and Y. P. Kim
Title Page Abstract Introduction Conclusions References Tables Figures ◭ ◮ ◭ ◮ Back Close
Full Screen / Esc
Printer-friendly Version Interactive Discussion
ACPD
7, 1479–1506, 2007 Source apportionment of the ambient PAHs at Seoul, KoreaJ. Y. Lee and Y. P. Kim
Title Page Abstract Introduction Conclusions References Tables Figures ◭ ◮ ◭ ◮ Back Close
Full Screen / Esc
Printer-friendly Version Interactive Discussion
ACPD
7, 1479–1506, 2007 Source apportionment of the ambient PAHs at Seoul, KoreaJ. Y. Lee and Y. P. Kim
Title Page Abstract Introduction Conclusions References Tables Figures ◭ ◮ ◭ ◮ Back Close
Full Screen / Esc
Printer-friendly Version Interactive Discussion
Fig. 6.Typical air parcels movement arriving at Seoul during the sampling period in (a) fall and