HAL Id: hal-00303387
https://hal.archives-ouvertes.fr/hal-00303387
Submitted on 4 Mar 2008HAL is a multi-disciplinary open access
archive for the deposit and dissemination of sci-entific research documents, whether they are pub-lished or not. The documents may come from teaching and research institutions in France or abroad, or from public or private research centers.
L’archive ouverte pluridisciplinaire HAL, est destinée au dépôt et à la diffusion de documents scientifiques de niveau recherche, publiés ou non, émanant des établissements d’enseignement et de recherche français ou étrangers, des laboratoires publics ou privés.
Enhancement of N2O during the October?November
2003 solar proton events
B. Funke, M. García-Comas, M. López-Puertas, N. Glatthor, G. P. Stiller, T.
von Clarmann, K. Semeniuk, J. C. Mcconnell
To cite this version:
B. Funke, M. García-Comas, M. López-Puertas, N. Glatthor, G. P. Stiller, et al.. Enhancement of N2O during the October?November 2003 solar proton events. Atmospheric Chemistry and Physics Discussions, European Geosciences Union, 2008, 8 (2), pp.4669-4691. �hal-00303387�
ACPD
8, 4669–4691, 2008
N2O enhancement
during solar proton events B. Funke et al. Title Page Abstract Introduction Conclusions References Tables Figures ◭ ◮ ◭ ◮ Back Close
Full Screen / Esc
Printer-friendly Version Interactive Discussion
Atmos. Chem. Phys. Discuss., 8, 4669–4691, 2008 www.atmos-chem-phys-discuss.net/8/4669/2008/ © Author(s) 2008. This work is distributed under the Creative Commons Attribution 3.0 License.
Atmospheric Chemistry and Physics Discussions
Enhancement of N
2
O during the
October–November 2003 solar proton
events
B. Funke1, M. Garc´ıa-Comas1, M. L ´opez-Puertas1, N. Glatthor2, G. P. Stiller2, T. von Clarmann2, K. Semeniuk3, and J. C. McConnell3
1
Instituto de Astrof´ısica de Andaluc´ıa, CSIC, Granada, Spain 2
Forschungszentrum Karlsruhe und Universit ¨at Karlsruhe, Institut f ¨ur Meteorologie und Klimaforschung, Karlsruhe, Germany
3
Department of Earth and Space Science and Engineering, York University, Toronto, Ontario, Canada
Received: 4 January 2008 – Accepted: 31 January 2008 – Published: 4 March 2008 Correspondence to: M. L ´opez-Puertas ([email protected])
ACPD
8, 4669–4691, 2008
N2O enhancement
during solar proton events B. Funke et al. Title Page Abstract Introduction Conclusions References Tables Figures ◭ ◮ ◭ ◮ Back Close
Full Screen / Esc
Printer-friendly Version Interactive Discussion
Abstract
In this paper we present evidence of enhanced N2O concentrations in the upper
strato-sphere/lower mesosphere polar regions after the solar proton events that occurred during October–November 2003. The observations were performed by the MIPAS in-strument on the Envisat satellite. Simulations performed using the Canadian Middle
5
Atmospheric Model (CMAM) show that such enhancements are most likely produced by the reaction of N(4S) with NO2, both of which species are largely enhanced just after the solar proton events in the winter polar night.
1 Introduction
Nitrous oxide is the main precursor of active nitrogen in the middle atmosphere. Its
ma-10
jor sources, both natural and man-made, originate at the surface, and it is transported into the stratosphere, where photo-dissociation by solar UV is its major sink and where its reaction with O(1D) leads to the formation of chemically active nitrogen species like NO2 and NO. Hence it indirectly plays a major role in controlling atmospheric
ozone abundance through the NOx (NOx=NO+NO2) ozone-destroying catalytic cycle 15
(Brasseur and Solomon,2005).
It has been widely reported that solar proton events (SPEs) have significant effects on the composition of the stratosphere and mesosphere in the polar regions (e.g.,
Jackman and McPeters,2004, for a recent review). The major effects have been found
to be significant enhancements in HOx(H+OH+HO2) and NOx(NO+NO2), followed by 20
large depletions of O3in these atmospheric regions.
In recent years, there have been two large solar proton events (October–November 2003 and January 2005) (Jackman et al.,2008) which have been intensively observed by several instruments on different satellite platforms, including, for example, NOAA 16 SBUV/2 and HALOE data (Jackman et al.,2005a,b;Randall et al.,2005); MIPAS,
25
ACPD
8, 4669–4691, 2008
N2O enhancement
during solar proton events B. Funke et al. Title Page Abstract Introduction Conclusions References Tables Figures ◭ ◮ ◭ ◮ Back Close
Full Screen / Esc
Printer-friendly Version Interactive Discussion
2005a,b;von Clarmann et al.,2005;Orsolini et al.,2005;Rohen et al.,2005); and MLS
on AURA (Verronen et al.,2006). In particular, during late October and early November 2003, three active solar regions produced solar flares and solar energetic particles of extremely large intensity, the fourth largest event observed in the past forty years
(Jackman et al.,2005a,2008). Some of the Geostationary Operational Environmental
5
Satellite (GOES)-11 instruments measured very large fluxes of highly energetic protons (e.g.,L ´opez-Puertas et al.,2005a). The protons are guided by the Earth’s magnetic field to both polar regions (geomagnetic latitudes>60◦
), where they penetrate down to ∼87 km, if their energy is >1 MeV, or even down to ∼30 km, if their energy is >100 MeV
(Jackman et al.,2005a).
10
During and after this solar proton event, the MIPAS instrument observed global changes (e.g. in both the Northern and Southern polar regions, during day and night-time) in the stratospheric and lower mesospheric composition. This includes enormous enhancements in NOx, e.g., in NO and NO2, and large depletions in O3(L ´opez-Puertas
et al., 2005a) as well as significant changes in other NOy species, such as HNO3, 15
N2O5, ClONO2 (L ´opez-Puertas et al., 2005b). In addition, there also have been
ob-served changes in ClO and HOCl, as evidence of perturbations by solar protons on the HOxand chlorine species abundances (von Clarmann et al.,2005).
However, to our knowledge, no solar-proton-event induced changes in N2O
concen-tration have so far been reported. A paper on the production and transport of N2O by
20
auroral electron precipitation seen by the Fourier transform spectrometer on SCISAT-1 has just been submitted by Semeniuk et al. (2008).1 One should expect this species being enhanced also if sufficient atomic nitrogen and NO2 is available after the solar
proton event in the polar night upper stratosphere and lower mesosphere. The aim of this paper is to report the enhanced N2O concentration observed by MIPAS during 25
the October–November 2003 solar proton event and to explain the reason for it using 1
Semeniuk, K., McConnell, J. C., Jin, J. J., Jarosz, J. R., Boone, C. D., and Bernath, P. F.: N2O production by high energy auroral electron precipitation, J. Geophys. Res., submitted, 2008.
ACPD
8, 4669–4691, 2008
N2O enhancement
during solar proton events B. Funke et al. Title Page Abstract Introduction Conclusions References Tables Figures ◭ ◮ ◭ ◮ Back Close
Full Screen / Esc
Printer-friendly Version Interactive Discussion
modeling calculations by the Canadian Middle Atmospheric Model (CMAM).
2 MIPAS measurements
MIPAS is a limb emission Fourier transform spectrometer designed for the measure-ment of trace species from space (Fischer and Oelhaf,1996;ESA,2000;Fischer et al.,
2007). It is part of the instrumentation of the Environmental Satellite (ENVISAT) which
5
was launched into its sun-synchronous polar orbit of 98.55◦inclination at about 800 km
altitude on 1 March 2002. MIPAS operated from July 2002 to March 2004 at full spec-tral resolution of 0.035 cm−1
(unapodized) in terms of full width at half maximum and with reduced resolution since August 2004. MIPAS observes the atmosphere during day and night with global coverage from pole to pole. Within its standard observation
10
mode at full spectral resolution, MIPAS covers the altitude range from 68 down to 6 km with tangent altitudes at 68, 60, 52, 47, and then at 3 km steps from 42 to 6 km. Oc-casionally, MIPAS also operates in several upper atmospheric modes scanning up to 170 km. The field of view of MIPAS is 30 km in horizontal and approximately 3 km in vertical direction. MIPAS passes the equator in southerly direction at 10.00 am local
15
time 14.3 times a day. During each orbit up to 72 limb scans are recorded. The Level-1b processing of the data (version 4.61/62 was used here), including processing from raw data to calibrated phase-corrected and geolocated radiance spectra, is performed by the European Space Agency (ESA) (Nett et al.,1999,2002).
The retrieval of N2O abundances was performed with the IMK-IAA data processor 20
(von Clarmann et al.,2003a), which is based on a constrained non-linear least squares
algorithm with Levenberg-Marquardt damping and line by line radiative transfer calcula-tions with the Karlsruhe Optimized and Precise Radiative Transfer Algorithm (KOPRA)
(Stiller et al.,2000). The first step in the L2 processing was the determination of the
spectral shift, followed by the retrieval of temperature and elevation pointing (von Clar-25
mann et al.,2003b), where pressure is implicitly determined by means of hydrostatic equilibrium. The retrieval of volume mixing ratio (vmr) profiles of species was carried
ACPD
8, 4669–4691, 2008
N2O enhancement
during solar proton events B. Funke et al. Title Page Abstract Introduction Conclusions References Tables Figures ◭ ◮ ◭ ◮ Back Close
Full Screen / Esc
Printer-friendly Version Interactive Discussion
out in the following order: O3, H2O, HNO3, and then CH4and N2O simultaneously. The results of the species retrieved first are then used in the retrievals of the subsequent species.
The N2O vmr was retrieved from the MIPAS spectra around 1284.9 cm−1, where the
ν1 band of N2O is located (Glatthor et al.,2005). The retrievals were performed from 5
selected spectral regions (micro-windows) which vary with observation geometries in order to optimize computation time and minimize systematic errors (von Clarmann and
Echle,1998). Thus, height dependent combinations of micro-windows were selected with a trade-off between computation time and total retrieval error. The retrieval noise error in the N2O vmr for unperturbed conditions (i.e., not during solar proton events)
10
is typically 3% at 10–44 km and 22% at 50 km. The total error varies between 10 and 20% at 10–35 km and is about 30% between 35–50 km (Glatthor et al.,2005).
The resulting vertical resolution was typically about 4 km in the altitude range 15– 40 km and decreased to more than 10 km below and above this region. More details on the N2O retrieval strategy can be found in Glatthor et al. (2005). For a profile of 15
the enhanced N2O during the SPE (typical of the data shown here) the noise error
is about 0.2 ppbv (smaller than 5%) at 50–75 km. However, the vertical resolution is rather sparse with values of 8-15 km above 52 km. This study is focussed mainly on MIPAS data from 25 October to 22 November 2003, which were retrieved by the IMK-IAA processor (data version V3O N2O 12) from Level-1b data version 4.61/62.
20
In addition to N2O we also use MIPAS data for NO2for that period and for 1
Novem-ber for NO. These data correspond to the IMK/IAA processed versions V3O NO2 9 and V3O NO2 11 and V3O NO 9, which have been significantly improved from previ-ously published data inL ´opez-Puertas et al.(2005a).
2.1 N2O Enhancement in polar regions
25
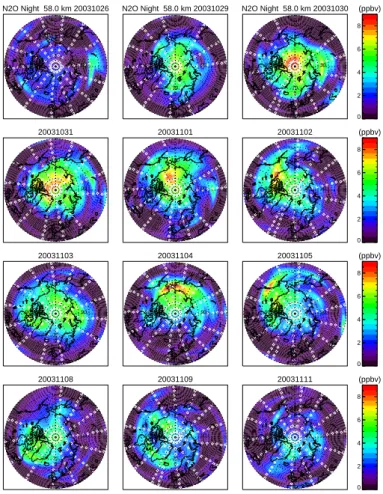
Figure1shows the temporal evolution of the N2O distribution at an approximate altitude
of 58 km in the Northern polar Hemisphere (40◦N–90◦N) for the period of 26 October
ACPD
8, 4669–4691, 2008
N2O enhancement
during solar proton events B. Funke et al. Title Page Abstract Introduction Conclusions References Tables Figures ◭ ◮ ◭ ◮ Back Close
Full Screen / Esc
Printer-friendly Version Interactive Discussion
until about ten days after them (note that some days are not shown). Since we are comparing these data with the corresponding NO2maps (see below), and at this height
nighttime–NO2is a good proxy of total NOx, we have plotted the N2O maps considering
only nighttime conditions.
A large increase in the N2O abundance is observed at polar latitudes reaching val-5
ues of about 9 ppbv at 58 km after the SPEs. This coincides with the latitudes where solar protons penetrate into the atmosphere, that is, in the polar cap regions (approxi-mately at>60◦
geomagnetic latitude). Note the contrast between the distribution on 26 October, before the SPEs, and on 29 October and following days, during and after the SPEs. Maximum N2O abundances are observed during the first few days of the SPEs
10
(on 30 October until 2 November), when the larger proton fluxes took place (see Fig. 1
inL ´opez-Puertas et al.,2005a). We also observe that the enhancement in N2O
con-centration lasts until 22 November (see Fig.5a) when the enhancement is still above 2 ppbv and moved to lower altitudes.
The energetic charged particles (protons and associated secondary electrons)
col-15
lide with and dissociate N2, thus producing atomic nitrogen and, subsequently, odd
nitrogen in the forms of NO and NO2through reactions:
N + O2→ NO + O, (R1)
and the further oxidation of nitric oxide through
NO + O3→ NO2+ O2. (R2)
20
The generation of N(4S) can also lead to a reduction in odd nitrogen (NOy) via
N(4S) + NO → N2+ O. (R3)
This NOy loss mechanism thus limits the buildup of NOx and is important especially
during large SPEs, when a huge amount of NOy is produced in a short time (Rusch
et al., 1981). However, as a net effect, SPEs will result in an increase in NOy con-25
ACPD
8, 4669–4691, 2008
N2O enhancement
during solar proton events B. Funke et al. Title Page Abstract Introduction Conclusions References Tables Figures ◭ ◮ ◭ ◮ Back Close
Full Screen / Esc
Printer-friendly Version Interactive Discussion
For reasons discussed below, we think that the N2O enhancement shown in Fig.1is produced from the enhancements in N(4S) and in NO2followed by the reaction
N(4S) + NO2→ N2O + O, (R4)
which is effective only during nighttime conditions since NO2 is rapidly dissociated in
the sunlight, e.g.,
5
NO2+ hν → NO + O. (R5)
Thus, the condition required for producing N2O in the upper stratosphere is to have
sufficient amounts of atomic nitrogen N and NOx under dark conditions, which is well
fulfilled when solar proton events occur in the dark polar winter region.
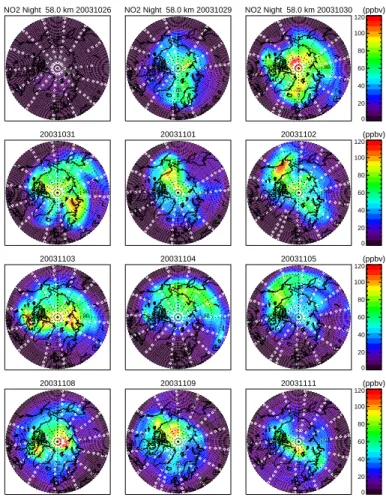
To verify this hypothesis we have investigated the spatial correlation between N2O 10
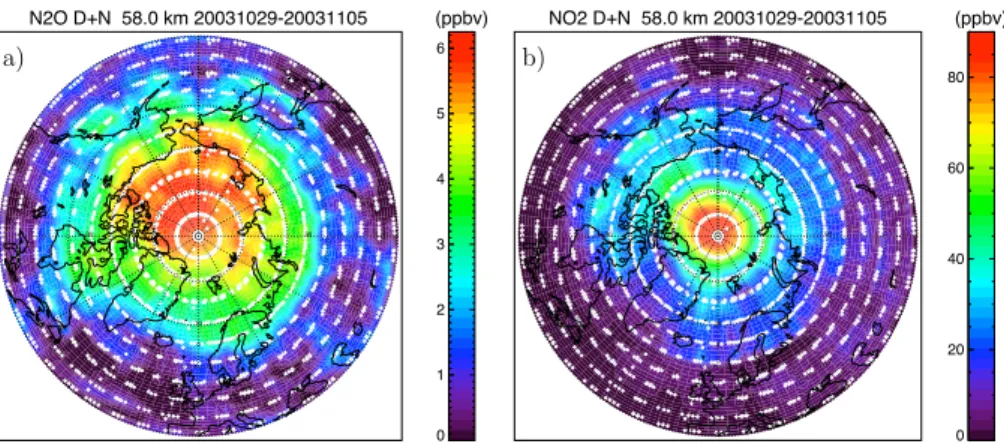
and NO2 which indeed is very pronounced for the whole period under investigation (Figs.1and2) and thus supports our explanation. Figure3shows the mean distribution of both species at the same altitude averaged over the first eight days after the first SPE, from 29 October to 5 November 2003. In this case we have included all data, accounting both day and nighttime conditions. The good spatial correlation between
15
the enhancements in both species is again evident, being both confined to the polar cap (>60◦geomagnetic latitude). Note the larger abundances in NO
2close to the North
pole (& 80◦), which reflects the dark polar night where NO
2is not photodissociated.
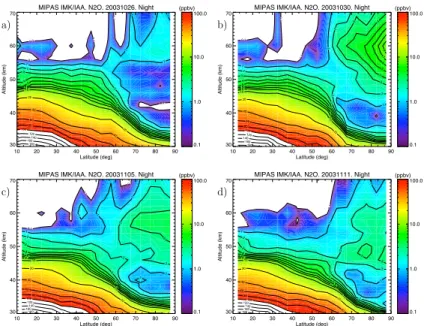
The altitude/latitude distribution of the enhancement is shown in Fig.4for four days, one just before the SPEs and three days after these events. The sudden appearance of
20
the N2O enhancement after the SPE on 29 October, delimited to latitudes northward of 60◦
and at altitudes above around 40 km, is clearly evident in the top right panel. The other panels of the figure show that the enhancement persists for the following fews days, being slightly diluted and descended downwards. There seems to be also an indication of aurorally enhanced N2O (e.g., produced by energetic electron precipitation 25
EEP), in the top left panel of Fig.4 (26 October). This small enhancement, as that appearing in late November (see next section) is not the focus of this work.
ACPD
8, 4669–4691, 2008
N2O enhancement
during solar proton events B. Funke et al. Title Page Abstract Introduction Conclusions References Tables Figures ◭ ◮ ◭ ◮ Back Close
Full Screen / Esc
Printer-friendly Version Interactive Discussion
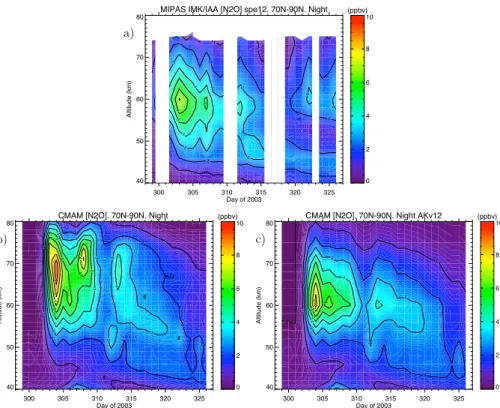
2.2 Temporal evolution of the N2O enhancement
Figure5a shows the temporal evolution of zonal mean N2O in the Northern polar cap
(latitudes polewards of 70◦ geographic) for nighttime conditions. The maximum
en-hancement took place at 50–55 km on 30–31 October (day of year (doy) 303–304) just after the first major SPE that came about on 29 October. Another enhancement
oc-5
curred on 3–4 November (doy 307–308), following another major increase in the high-energy solar proton flux (see Fig. 1 inL ´opez-Puertas et al.,2005a). A weaker enhance-ment is also observed around 60 km near the end of this period (18–22 November, doy 324–326). This enhancement seems not to be related to solar proton events. Although a smaller SPE took place on 22–25 November the ionization rates due to protons
cal-10
culated byJackman(2007b) for these days were about three orders of magnitude lower than for 30–31 October. Also, this N2O enhancement already started on 18 November, a few days before this secondary SPE occurred. This weaker enhancement, how-ever, seems to be correlated with the onset of the polar winter descent of NOx from
the mesosphere-lower thermosphere (MLT) region which took place in the second half
15
of November and made available sufficient NO2during nighttime below approximately
70 km (see Fig.6a). Atomic nitrogen, also required for N2O formation, has a too short
chemical lifetime to be transported downward from the MLT region, but it could be pro-duced by the high-energy electron precipitation (EEP) taking place at that time. Indeed, fluxes of electrons with energies >100 keV (able to penetrate down to 70 km)
mea-20
sured by the MEPED instrument on NOAA 16 (http://poes.ngdc.noaa.gov/data/avg/) were significantly increased on 16 and 20 November.
The temporal evolution of N2O in the Northern Hemisphere (Fig.5a) shows also that
N2O-rich air masses were descending from around 50 km to ∼ 43 km during November.
This descent is also observed in the temporal evolution of NO2(Fig.6a) and is related
25
to the polar winter descent of the meridional circulation.
Smaller N2O enhancements have also been observed in the Southern Hemisphere
ACPD
8, 4669–4691, 2008
N2O enhancement
during solar proton events B. Funke et al. Title Page Abstract Introduction Conclusions References Tables Figures ◭ ◮ ◭ ◮ Back Close
Full Screen / Esc
Printer-friendly Version Interactive Discussion
smaller enhancements in the sunlit Southern Hemisphere polar cap are expected due to less available NO2 during daytime conditions (see Fig. 4a in L ´opez-Puertas et al.,
2005a). The temporal evolution of N2O in the Southern Hemisphere shows, in contrast
to the Northern Hemisphere, a small upward motion which can also be explained by the meridional circulation pattern in this period.
5
3 Modelling
We have also investigated N2O production by the 2003 SPEs using the Canadian Mid-dle Atmosphere Model (CMAM). CMAM is a chemistry climate model with a compre-hensive set of physical parameterizations and chemistry package. The model chem-istry takes into account 102 gas phase, 37 photolysis and 12 heterogeneous reactions
10
on type Ib and II polar stratospheric clouds (de Grandpr ´e et al.,2000). For the simula-tions conducted here the model chemistry was extended to include Reaction (R4) and the additional branches:
N(4S) + NO2→ NO + NO (R6)
N(4S) + NO2→ N2+ O2. (R7)
15
Based on multiple simulations, it was decided to ascribe 50% of the reaction rate to the primary branch (R4) and 25% to each of the secondary branches (R6 and R7). This split is not excluded by the laboratory work used to determine the reaction rate
(Wennberg et al.,1994) and without it the N2O production is too high for a given amount
of NO2.
20
The October–November 2003 SPEs production of NOx, HOx and atomic oxygen
based on vertical profiles of hourly ion pair production rates derived from NOAA GOES-11 observations of proton fluxes was implemented as inSemeniuk et al.(2005). How-ever, here we use a new chemistry solver that is fully implicit without any approximation
ACPD
8, 4669–4691, 2008
N2O enhancement
during solar proton events B. Funke et al. Title Page Abstract Introduction Conclusions References Tables Figures ◭ ◮ ◭ ◮ Back Close
Full Screen / Esc
Printer-friendly Version Interactive Discussion
to the Jacobian matrix. Ground state atomic nitrogen is not assumed to be in photo-chemical steady state. We carried out one simulation where Reaction (R4) and its branches were turned off and one simulation where they were active.
The run performed without including Reaction (R4) shows very little N2O above ∼40 km (due to descent during this time of the year). When this reaction is included,
5
however, the model predicts a significant enhancement for N2O (see Figs. 5b and 5c). The values computed by the model (Fig.5b) look, in a first instance, significantly larger than those measured by MIPAS (Fig.5a) and with the peak values situated at about 5–10 km higher. We mentioned before that MIPAS measurements have a rather sparse vertical resolution at these altitudes. Hence, for meaningful comparisons, the
10
MIPAS averaging kernels have to be applied to model results. This is shown in Fig.5c, where we show the model predictions as would have been measured by MIPAS. There is excellent agreement with the measurements (panel a), both in the magnitude of the enhancement (slightly overestimated by the model) and in the altitude of the peak of the enhancement. The model also simulates well the double peak in the temporal
evolu-15
tion of the enhancement, corresponding to the two major SPEs on 29 October and 3–4 November, and the dilution and slow descent of the N2O increase during the following days. This then confirms our hypothesis about the origin of the N2O enhancement. The
model does not show the weaker enhancement on 18–20 November at about 60 km, since this is likely produced by EEPs which are not modeled in the results shown here.
20
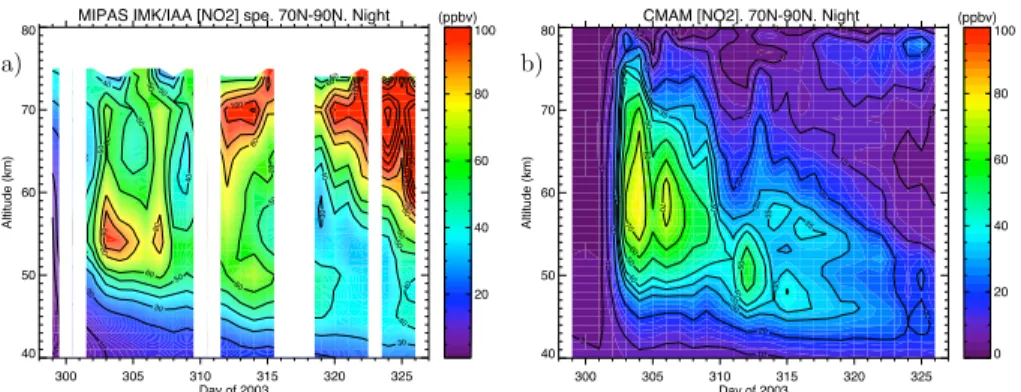
As a further check of the mechanism, we compared the measured and modeled values for NO2, one of the precursors of the N2O, during this period. The results
are shown in Figs.6a and 6b for MIPAS and the model, respectively. In absence of reprocessed MIPAS NO data to compare the total NOxabundance, we compared only
nighttime NO2data, which, below about 70 km, is a good proxy for NOx. 25
As has been discussed in the introduction, and shown in Fig.6, NO2increased sig-nificantly during these SPEs. Focusing on the first few days after the SPEs, the figure shows that measured and modeled NO2 are in rather good agreement. This is more
ACPD
8, 4669–4691, 2008
N2O enhancement
during solar proton events B. Funke et al. Title Page Abstract Introduction Conclusions References Tables Figures ◭ ◮ ◭ ◮ Back Close
Full Screen / Esc
Printer-friendly Version Interactive Discussion
see that below ∼50 km the agreement is very good although between 55 to 65 km mod-eled NO2and NOxare overpredicted. This model overestimation is consistent with the slightly larger values predicted by the model for the N2O enhancement in this region
(see Fig.5).
Large values of NO2 seen by MIPAS above 60 km are noticeable in Fig.6a starting
5
on 8 November (doy 312) and mainly after 16 November (doy 320). This enhancement is attributed to a strong descent of mesospheric air, very rich in NOx, which was
pro-duced by energetic electron precipitation in the mesosphere and with some possible local contribution by EEPs (see, e.g.,L ´opez-Puertas et al.,2006). This NOx-production
mechanism is not included in the current model runs. Note that MIPAS N2O also ex-10
hibits a weak enhancement in this region and time (see Fig.5a), which is not shown in the model run because of insufficient NO2 and lack of high-energy electron
precipita-tion. The detailed study of these N2O and NO2 enhancements are, however, beyond
the scope of this paper.
As a final remark, we should note that the small enhancement of 1–1.2 ppbv in
15
the Southern Hemisphere is also consistent with the N2O production mechanism
pro-posed here. Peak averaged NO2values in the Northern Hemisphere are about 80 ppbv (Fig.6a) while the enhancement in the SH (not shown here) is about 15 ppbv. The ratio of both is about a factor of 5–6, very similar to the NH/SH ratio for N2O of (6–7)/(1–1.2).
In that sense, CMAM predictions for the Southern Hemisphere are also very similar to
20
those measured with peak averaged enhancements ranging from 1 to 1.5 ppbv.
4 Summary and conclusions
We have shown in this paper the first evidence of enhanced N2O concentrations in the upper stratosphere/lower mesosphere polar regions after solar proton events. In partic-ular we show the enhanced N2O in the Northern Hemisphere polar cap after the SPEs 25
that occurred during October–November 2003. The observations were performed with the MIPAS instrument on the Envisat satellite and show that N2O was enhanced by
ACPD
8, 4669–4691, 2008
N2O enhancement
during solar proton events B. Funke et al. Title Page Abstract Introduction Conclusions References Tables Figures ◭ ◮ ◭ ◮ Back Close
Full Screen / Esc
Printer-friendly Version Interactive Discussion
about 5 ppbv in the upper stratosphere/lower mesosphere Northern polar cap. Simu-lations performed using the Canadian Middle Atmospheric Model (CMAM) show that such enhancements can be produced by the reaction of N(4S) with NO2, both of which
species are largely augmented just after the solar proton events in the polar night. Such N2O enhancement requires a condition which is rarely present in the upper 5
stratosphere: the simultaneous presence of atomic nitrogen, N, and high amounts of NO2, a condition which is met when solar proton events come up under polar night conditions. High-energy electron precipitation is also capable of producing atomic ni-trogen in the middle mesosphere, and might then represent a continuous source of atmospheric N2O in the polar night regions in the upper mesosphere, which can
occa-10
sionally descend to the stratopause region (Semeniuk et al., 20081)
N2O is almost completely produced at the surface by both natural and anthropogenic
sources. The mechanism presented here represents an additional natural atmospheric source of N2O. Its investigation in the future is therefore of high importance.
Acknowledgements. The IAA team was supported by the Spanish project ESP2004-01556
15
and EC FEDER funds. The authors acknowledge ESA for providing MIPAS spectra. The IMK team was supported by the Priority Program CAWSES of the German science foundation (DFG) under the project MANOXUVA. J. C. McConnell and K. Semeniuk would like to thank the Natural Sciences and Engineering Research Council of Canada, the Canadian Foundation for Climate and Atmospheric Sciences and the Canadian Foundation for Innovation.
ACPD
8, 4669–4691, 2008
N2O enhancement
during solar proton events B. Funke et al. Title Page Abstract Introduction Conclusions References Tables Figures ◭ ◮ ◭ ◮ Back Close
Full Screen / Esc
Printer-friendly Version Interactive Discussion
References
Brasseur, G. and Solomon, S.: Aeronomy of the middle Atmosphere, 3rd revised and enlarged ed., Springer, Dordrecht, 644 pp., 327–358, 2005.4670
de Grandpr ´e, J., Beagley, S. R., Griffioen, E., McConnell, J. C., and Medvedev, A. S.: Ozone cli-matology using interactive chemistry: Results from the Canadian Middle Atmosphere Model,
5
J. Geophys. Res., 105, 26 475–26 491, 2000. 4677
European Space Agency, Envisat, MIPAS An instrument for atmospheric chemistry and cli-mate research, ESA Publications Division, ESTEC, The Netherlands, SP-1229, 1–123, 2000.
4672
Fischer, H. and Oelhaf, H.: Remote sensing of vertical profiles of atmospheric trace
con-10
stituents with MIPAS limb-emission spectrometers, Appl. Optics, 35, 16, 2787–2796, 1996.
4672
Fischer, H., Birk, M., Blom, C., Carli, B., Carlotti, M., von Clarmann, T., Delbouille, L., Dudhia, A., Ehhalt, D., Endemann, M., Flaud, J. M., Gessner, R., Kleinert, A., Koopmann, R., Langen, J., L ´opez-Puertas, M., Mosner, P., Nett, H., Oelhaf, H., Perron, G., Remedios, J., Ridolfi, M.,
15
Stiller, G., and Zander, R.: MIPAS: An Instrument for Atmospheric and Climate Research, Atmos. Chem. Phys. Discuss., 7, 8795–8893, 2007,
http://www.atmos-chem-phys-discuss.net/7/8795/2007/. 4672
Funke, B., L ´opez-Puertas, M., Gil-L ´opez, S., Clarmann, T., Stiller, G., Kellmann, S., and Fis-cher, H.: Downward transport of upper atmospheric NOx into the polar stratosphere and
20
lower mesosphere during the Antarctic 2003 and Arctic 2002/2003 winters, J. Geophys. Res., 110, D24308, doi:10.1029/2005JD006463, 2005.
Glatthor, N., von Clarmann, T., Fischer, H., Funke, B., Grabowski, U., H ¨opfner, M., Kellmann, S., Kiefer, M., Linden, A., Milz, M., Steck, T., Stiller, G. P., Mengistu Tsidu, G., and Wang, D.-Y.: Mixing processes during the Antarctic vortex split in September–October 2002 as inferred
25
from source gas and ozone distributions from ENVISAT-MIPAS, J. Atmos. Sci., 62, 787–800, 2005. 4673
Jackman, C. H. and McPeters, R. D.: The effects of solar proton events on ozone and other constituents, Solar variability and its Effects on climate, Geophys. Mon., 141, 305–319, 2004.
4670
30
Jackman, C. H., DeLand, M. T., Labow, G. J., Fleming, E. L., Weisenstein, D. K., Ko, M., Sinnhu-ber, M. K. W., and Russell, J. M.: Neutral atmospheric influences of the solar proton events
ACPD
8, 4669–4691, 2008
N2O enhancement
during solar proton events B. Funke et al. Title Page Abstract Introduction Conclusions References Tables Figures ◭ ◮ ◭ ◮ Back Close
Full Screen / Esc
Printer-friendly Version Interactive Discussion
in October–November 2003, J. Geophys. Res., 110, A09S27, doi:10.1029/2004JA010888, 2005a.4670,4671
Jackman, C. H., DeLand, M. T., Labow, G. J., Fleming, E. L., Weisenstein, D. K., Ko, M., Sinnhuber, M. K. W., Anderson, J., and Russell, J. M.: The influence of the several very large solar proton events in Years 2000–2003 on the neutral middle atmosphere, Adv. Space
5
Res., 35, 445–450, 2005b. 4670
Jackman, C. H., Marsh, D. R., Vitt, F. M., Garcia, R., Fleming, E. L., Labow, G. J., Randall, C., L ´opez-Puertas, M., and Funke, B.: Short- and medium-term atmospheric effects of very large solar proton events, Atmos. Chem. Phys., 8, 765–785, 2008,
http://www.atmos-chem-phys.net/8/765/2008/. 4670,4671
10
Jackman, C. H.: Ionization rates for 1963–2007 from Solar Proton events,
http://strat-www.met.fu-berlin.de/∼matthes/sparc/SOLARIS Jackman SPEs.pdf, 2007.4676
L ´opez-Puertas, M., Funke, B., Gil-L ´opez, S., von Clarmann, T., Stiller, G. P., H ¨opfner, M., Kellmann, S., Fischer, H., and Jackman, C. H.: Observation of NOxenhancement and ozone depletion in the Northern and Southern Hemispheres after the October–November 2003
15
solar proton events, J. Geophys. Res., 110, A09S43, doi:10.1029/2005JA011050, 2005a.
4670,4671,4673,4674,4676,4677
L ´opez-Puertas, M., Funke, B., Gil-L ´opez, S., Mengistu Tsidu, G., Fischer, H., and Jackman, C. H.: HNO3, N2O5, and ClONO2 enhancements after the October–November 2003 solar proton events, J. Geophys. Res., 110, A09S44, doi:10.1029/2005JA011051, 2005b. 4671
20
L ´opez-Puertas, M., Funke, B., Clarmann, T., Fischer, H., and Stiller, G.: The Variability of Stratospheric and Mesospheric NOy in the Arctic and Antarctic 2002–2004 Polar Winters, Space Sci. Rev., 125, 403–416, doi:10.1007/s11214-006-9073-2, 2006. 4679
Nett, H., Carli, B., Carlotti, M., et al.: MIPAS ground processor and data products, Proc. IEEE 1999 Inter. Geosci. and Remote Sensing Symp., Hamburg, Germany, 1692–1696, 1999.
25
4672
Nett, H., Perron, G., Sanchez, M., Burgess, A., and Mosner, P.: MIPAS in-flight calibration and processor verification, in: ENVISAT Calibration Review–Proc. of the European Workshop, 9–13 September 2002, ESTEC, Noordwijk, The Netherlands, CD-ROM, SP–520, edited by: H. Sawaya-Lacoste, ESA Publications Division, ESTEC, Postbus 299, 2200 AG Noordwijk,
30
The Netherlands, 1–10, 2002.4672
Orsolini, Y. J., Manney, G. L., Santee, M. L., and Randall, C. E.: An upper stratospheric layer of enhanced HNO3 following exceptional solar storms, Geophys. Res. Lett., 32, L12S01,
ACPD
8, 4669–4691, 2008
N2O enhancement
during solar proton events B. Funke et al. Title Page Abstract Introduction Conclusions References Tables Figures ◭ ◮ ◭ ◮ Back Close
Full Screen / Esc
Printer-friendly Version Interactive Discussion
doi:10.1029/2004GL021588, 2005. 4671
Randall, C. E., Harvey, V. L., Manney, G. L., et al.: Stratospheric effects of energetic particle precipitation in 2003–2004, Geophys. Res. Lett., 32, L05802, doi:10.1029/2004GL022003, 2005. 4670
Rohen, G., von Savigny, C., Sinnhuber, M., Llewellyn, E. J., Kaiser, J. W., Jackman, C. H.,
5
Kallenrode, M.-B., Schroter, J., Eichmann, K.-U., Bovensmann, H., and Burrows, J. P.: Ozone depletion during the solar proton events of Oct./Nov. 2003 as seen by SCIAMACHY, J. Geo-phys. Res., 110, A09S39, doi:10.1029/2004JA010984, 2005. 4671
Rusch, D. W., Gerard, J.-C., Solomon, S., Crutzen, P. J., and Reid, G. C.: The effect of particle precipitation events on the neutral and ion chemistry of the middle atmosphere, 1, Odd
10
nitrogen, Planet. Space Sci., 29, 767–774, 1981.4674
Semeniuk, K., McConnell, J. C., and Jackman, C. H.: Simulation of the October–November 2003 solar proton events in the CMAM GCM: Comparison with observations, Geophys. Res. Lett., 32, L15S02, doi:10.1029/2004GL022392, 2005. 4677
Sepp ¨al ¨a, A., Verronen, P. T., Kyr ¨ol ¨a, E., Hassinen, S., Backman, L., Hauchecorne, A., Bertaux,
15
J. L., and Fussen, D.: Solar proton events of October–November 2003: Ozone depletion in the Northern Hemisphere polar winter as seen by GOMOS/Envisat, Geophys. Res. Lett., 31, L19107, doi:10.1029/2004GL021042, 2004. 4670
Stiller, G. P.: The Karlsruhe Optimized and Precise Radiative Transfer Algorithm (KOPRA), Wiss. Ber. FZKA 6487, Forschungszentrum, Karlsruhe, Germany, 521–540, 2000.4672
20
Verronen, P. T., Sepp ¨al ¨a, A., Kyr ¨ol ¨a, E., Tamminen, J., Pickett, H. M., and Turunen, E.: Pro-duction of odd hydrogen in the mesosphere during the January 2005 solar proton event, Geophys. Res. Lett., 33, L24811, doi:10.1029/2006GL028115, 2006.4671
von Clarmann, T. and Echle, G.: Selection of optimized microwindows for atmospheric spec-troscopy, Appl. Optics, 37, 7661–7669, 1998. 4673
25
von Clarmann, T., Chidiezie Chineke, T., Fischer, H., et al.: Remote sensing of the middle at-mosphere with MIPAS, in: Remote Sensing of Clouds and the Atat-mosphere VII, 4882, edited by: Sch ¨afer, K., Lado-Bordowsky, O., Comer ´on, A., and Picard, R. H., SPIE, Bellingham, WA, USA, 172–183, 2003a. 4672
von Clarmann, T., Glatthor, N., Grabowski, U., et al.: Retrieval of temperature and tangent
30
altitude pointing from limb emission spectra recorded from space by the Michelson Inter-ferometer for Passive Atmospheric Sounding (MIPAS), J. Geophys. Res., 108, D23, 4736, doi:10.1029/2003JD003602, 2003b.4672
ACPD
8, 4669–4691, 2008
N2O enhancement
during solar proton events B. Funke et al. Title Page Abstract Introduction Conclusions References Tables Figures ◭ ◮ ◭ ◮ Back Close
Full Screen / Esc
Printer-friendly Version Interactive Discussion
von Clarmann, T., Glatthor, N., H ¨opfner, M., et al.: Stratospheric HOCl measurements provide evidence of increased stratospheric odd hydrogen abundances due to solar proton events 2003, J. Geophys. Res., 110, A09S45, doi:10.1029/2005JA011053, 2005. 4671
Wennberg, P. O., Anderson, J. G., and Weisenstein, D. K.: Kinetics of reactions of ground state nitrogen atoms (4S3/2) with NO and NO2, J. Geophys. Res., 99, 18 839–18 846, 1994. 4677
ACPD
8, 4669–4691, 2008
N2O enhancement
during solar proton events B. Funke et al. Title Page Abstract Introduction Conclusions References Tables Figures ◭ ◮ ◭ ◮ Back Close
Full Screen / Esc
Printer-friendly Version Interactive Discussion N2O Night 58.0 km 20031026 -90 0 90 180 40 70 N2O Night 58.0 km 20031029 -90 0 90 180 40 70 N2O Night 58.0 km 20031030 -90 0 90 180 40 70 (ppbv) 0 2 4 6 8 20031031 -90 0 90 180 40 70 20031101 -90 0 90 180 40 70 20031102 -90 0 90 180 40 70 (ppbv) 0 2 4 6 8 20031103 -90 0 90 180 40 70 20031104 -90 0 90 180 40 70 20031105 -90 0 90 180 40 70 (ppbv) 0 2 4 6 8 20031108 -90 0 90 180 40 70 20031109 -90 0 90 180 40 70 20031111 -90 0 90 180 40 70 (ppbv) 0 2 4 6 8
Fig. 1. Northern Hemisphere distributions of N2O (in ppbv, parts per billion by volume) for days from 26 October to 11 November 2003 at an altitude of 58 km. Only nighttime data is included. Contours are zonally smoothed within 700 km. Individual measurements are represented by white symbols.
ACPD
8, 4669–4691, 2008
N2O enhancement
during solar proton events B. Funke et al. Title Page Abstract Introduction Conclusions References Tables Figures ◭ ◮ ◭ ◮ Back Close
Full Screen / Esc
Printer-friendly Version Interactive Discussion NO2 Night 58.0 km 20031026 -90 0 90 180 40 70 NO2 Night 58.0 km 20031029 -90 0 90 180 40 70 NO2 Night 58.0 km 20031030 -90 0 90 180 40 70 (ppbv) 0 20 40 60 80 100 120 20031031 -90 0 90 180 40 70 20031101 -90 0 90 180 40 70 20031102 -90 0 90 180 40 70 (ppbv) 0 20 40 60 80 100 120 20031103 -90 0 90 180 40 70 20031104 -90 0 90 180 40 70 20031105 -90 0 90 180 40 70 (ppbv) 0 20 40 60 80 100 120 20031108 -90 0 90 180 40 70 20031109 -90 0 90 180 40 70 20031111 -90 0 90 180 40 70 (ppbv) 0 20 40 60 80 100 120
ACPD
8, 4669–4691, 2008
N2O enhancement
during solar proton events B. Funke et al. Title Page Abstract Introduction Conclusions References Tables Figures ◭ ◮ ◭ ◮ Back Close
Full Screen / Esc
Printer-friendly Version Interactive Discussion a) b) N2O D+N 58.0 km 20031029-20031105 -90 0 90 180 40 70 (ppbv) 0 1 2 3 4 5 6 NO2 D+N 58.0 km 20031029-20031105 -90 0 90 180 40 70 (ppbv) 0 20 40 60 80
Fig. 3. Northern Hemisphere mean distributions of N2O (a) and NO2 (b) for days from 29
October to 5 November 2003 at an altitude of 58 km. Both day and nighttime data are included. Contours are zonally smoothed within 700 km. Individual measurements are represented by white symbols.
ACPD
8, 4669–4691, 2008
N2O enhancement
during solar proton events B. Funke et al. Title Page Abstract Introduction Conclusions References Tables Figures ◭ ◮ ◭ ◮ Back Close
Full Screen / Esc
Printer-friendly Version Interactive Discussion
a) b)
MIPAS IMK/IAA. N2O. 20031026. Night
10 20 30 40 50 60 70 80 90 Latitude (deg) 30 40 50 60 70 Al ti tu d e (km) 0.1 0.1 0.1 0.1 0.1 1 1 1 1 1 1 2 2 3 3 4 4 5 5 6 6 7 7 8 8 10 10 20 20 40 40 60 80 100 120 140 160 180 (ppbv) 0.1 1.0 10.0 100.0
MIPAS IMK/IAA. N2O. 20031030. Night
10 20 30 40 50 60 70 80 90 Latitude (deg) 30 40 50 60 70 Al ti tu d e (km) 0.1 0.1 0.1 1 1 1 2 2 2 2 3 3 3 3 4 4 4 4 5 5 5 6 6 6 7 7 7 8 8 8 10 10 20 20 40 60 80 100 120 140 160 180 (ppbv) 0.1 1.0 10.0 100.0 c) d)
MIPAS IMK/IAA. N2O. 20031105. Night
10 20 30 40 50 60 70 80 90 Latitude (deg) 30 40 50 60 70 Al ti tu d e (km) 0.1 0.1 0.1 1 1 1 1 1 1 2 2 2 2 3 3 3 4 4 5 5 6 6 7 7 8 8 10 10 20 20 40 60 80 100 120 140 160 180 (ppbv) 0.1 1.0 10.0 100.0
MIPAS IMK/IAA. N2O. 20031111. Night
10 20 30 40 50 60 70 80 90 Latitude (deg) 30 40 50 60 70 Al ti tu d e (km) 0.1 0.1 1 1 1 1 2 2 2 2 3 3 3 3 4 4 5 5 6 6 7 7 8 8 10 10 20 20 40 40 60 80 100 120 140 160 180 (ppbv) 0.1 1.0 10.0 100.0
Fig. 4. Zonal mean cross sections of N2O in the Northern Hemisphere for the days 26 and 30 October (a, b) and 5 and 11 November (c, d) 2003 measured in nighttime conditions. The enhancement of N2O at high latitudes above 40 km is evident. White areas at highest altitudes represent MIPAS measurements with no information and those at the lowest altitudes near the tropics denote values outside of the color scale range.
ACPD
8, 4669–4691, 2008
N2O enhancement
during solar proton events B. Funke et al. Title Page Abstract Introduction Conclusions References Tables Figures ◭ ◮ ◭ ◮ Back Close
Full Screen / Esc
Printer-friendly Version Interactive Discussion a)
MIPAS IMK/IAA [N2O] spe12. 70N-90N. Night
300 305 310 315 320 325 Day of 2003 40 50 60 70 80 Al ti tu d e (km) 1 1 1 1 1 2 2 2 2 2 2 2 3 3 3 3 3 3 4 4 4 5 5 6 (ppbv) 0 2 4 6 8 10 b) c)
CMAM [N2O]. 70N-90N. Night
300 305 310 315 320 325 Day of 2003 40 50 60 70 80 Al ti tu d e (km) 1 1 1 1 1 2 2 2 2 2 2 2 2 2 2 3 3 3 3 3 3 4 4 4 4 5 5 5 6 6 6 7 7 8 9 (ppbv) 0 2 4 6 8 10
CMAM [N2O]. 70N-90N. Night AKv12
300 305 310 315 320 325 Day of 2003 40 50 60 70 80 Al ti tu d e (km) 0 1 1 1 1 1 2 2 2 2 2 2 3 3 3 3 4 4 4 5 6 6 7 8 (ppbv) 0 2 4 6 8 10
Fig. 5. Time series of N2O abundance after the solar proton events of October–November 2003 for the Northern Hemisphere polar cap (70–90◦N) during nighttime conditions. (a) MIPAS measurements; where white areas at highest altitudes represent MIPAS measurements with no information and the vertical white bands represent days with no processed data. Lower panels: Simulations by the Canadian Middle Atmosphere Model without (b) and with (c) application of the averaging kernels of the MIPAS retrievals.
ACPD
8, 4669–4691, 2008
N2O enhancement
during solar proton events B. Funke et al. Title Page Abstract Introduction Conclusions References Tables Figures ◭ ◮ ◭ ◮ Back Close
Full Screen / Esc
Printer-friendly Version Interactive Discussion
a) b)
MIPAS IMK/IAA [NO2] spe. 70N-90N. Night
300 305 310 315 320 325 Day of 2003 40 50 60 70 80 Al ti tu d e (km) 5 10 20 20 30 30 30 30 40 40 40 40 40 40 40 50 50 50 50 50 50 50 50 60 60 60 60 60 60 60 60 80 80 80 80 80 90 90 90 90 100 100 100 110 120 120 130 130 (ppbv) 20 40 60 80
100 CMAM [NO2]. 70N-90N. Night
300 305 310 315 320 325 Day of 2003 40 50 60 70 80 Al ti tu d e (km) 5 5 5 5 5 5 5 5 10 10 10 10 10 10 10 20 20 20 20 20 20 20 30 30 30 30 35 35 35 35 35 35 40 40 40 40 50 50 50 60 60 70 70 (ppbv) 0 20 40 60 80 100
Fig. 6. Time series of NO2 enhancement after the solar proton events of October–November 2003 for the Northern Hemisphere polar cap (70–90◦N) at nighttime conditions as measured by MIPAS (a) and modeled by the Canadian Middle Atmosphere Model (CMAM) (b). The vertical white bands in panel (a) represent days with no processed data.
ACPD
8, 4669–4691, 2008
N2O enhancement
during solar proton events B. Funke et al. Title Page Abstract Introduction Conclusions References Tables Figures ◭ ◮ ◭ ◮ Back Close
Full Screen / Esc
Printer-friendly Version Interactive Discussion NOx. MIPAS vs. CMAM (jtab). 1 Nov 2003. 70N-90N. Night
0 50 100 150 200 250 vmr (ppbv) 30 40 50 60 70 80 Altitude (km) NO NO2 NOx Solid: MIPAS Dash: CMAM
Fig. 7. Mean NO, NO2, and NOx profiles for the Northern Hemisphere polar cap (70–90◦N) at nighttime conditions for the 1 November 2003 measured by MIPAS and modeled by the CMAM model.