HAL Id: hal-00295742
https://hal.archives-ouvertes.fr/hal-00295742
Submitted on 20 Sep 2005
HAL is a multi-disciplinary open access
archive for the deposit and dissemination of
sci-entific research documents, whether they are
pub-lished or not. The documents may come from
teaching and research institutions in France or
abroad, or from public or private research centers.
L’archive ouverte pluridisciplinaire HAL, est
destinée au dépôt et à la diffusion de documents
scientifiques de niveau recherche, publiés ou non,
émanant des établissements d’enseignement et de
recherche français ou étrangers, des laboratoires
publics ou privés.
methane by solar FTIR spectrometry at the
Ground-Truthing Station Zugspitze
R. Sussmann, W. Stremme, M. Buchwitz, R. de Beek
To cite this version:
R. Sussmann, W. Stremme, M. Buchwitz, R. de Beek. Validation of ENVISAT/SCIAMACHY
colum-nar methane by solar FTIR spectrometry at the Ground-Truthing Station Zugspitze. Atmospheric
Chemistry and Physics, European Geosciences Union, 2005, 5 (9), pp.2419-2429. �hal-00295742�
www.atmos-chem-phys.org/acp/5/2419/ SRef-ID: 1680-7324/acp/2005-5-2419 European Geosciences Union
Chemistry
and Physics
Validation of ENVISAT/SCIAMACHY columnar methane by solar
FTIR spectrometry at the Ground-Truthing Station Zugspitze
R. Sussmann1, W. Stremme1, M. Buchwitz2, and R. de Beek2
1IMK-IFU, Forschungszentrum Karlsruhe, Garmisch-Partenkirchen, Germany
2Institute of Environmental Physics (iup), University of Bremen FB1, Bremen, Germany
Received: 27 January 2005 – Published in Atmos. Chem. Phys. Discuss.: 13 April 2005 Revised: 1 July 2005 – Accepted: 5 September 2005 – Published: 20 September 2005
Abstract. Methane total-vertical column retrievals from ground-based solar FTIR measurements at the Permanent Ground-Truthing Station Zugspitze (47.42◦N, 10.98◦E,
2964 m a.s.l.), Germany are used to validate column averaged methane retrieved from ENVISAT/SCIAMACHY spectra by WFM-DOAS (WFMD) version 0.4 and 0.41 for 153 days in 2003. Smoothing errors are estimated to be be-low 0.10% for FTIR and 0.14% for SCIAMACHY-WFMD retrievals and can be neglected for the assessment of ob-served bias and day-to-day-scatter. In order to minimize the altitude-difference effect, dry-air column averaged mix-ing ratios (XCH4) have been utilized. From the
FTIR-time series of XCH4 an atmospheric day-to-day
variabil-ity of 1% was found, and a sinusoidal annual cycle with a ≈1.6% amplitude. To obtain the WFMD bias, a poly-nomial fitted to the FTIR series was used as a reference. The result is WFMD v0.4/FTIR=1.008±0.019 and WFMD v0.41/FTIR=1.058±0.008. WFMD v0.41 was significantly improved by a time-dependent bias correction. It can still not capture the natural day-to-day variability, i.e., the standard deviation calculated from the daily-mean values is 2.4% us-ing averages within a 2000-km radius, and 2.7% for a 1000-km radius. These numbers are dominated by a residual time-dependent bias in the order of 3%/month. The latter can be reduced, e.g., from 2.4% to 1.6% as shown by an empirical time-dependent bias correction. Standard deviations of the daily means, calculated from the individual measurements of each day, are excluding time-dependent biases, thus show-ing the potential precision of WFMD daily means, i.e., 0.3% for a 2000-km selection radius, and 0.6% for a 1000-km se-lection radius. Therefore, the annual cycle as well as pos-sibly the day-to-day variability could be captured under the prerequisite of further advanced time-dependent bias correc-tions, or the use of other channels, where the icing issue is less prominent.
Correspondence to: R. Sussmann
1 Introduction
The atmospheric trace species methane (CH4)contributes by
15% to the anthropogenic greenhouse forcing, and has re-cently been included into the list of the so called “Kyoto gases”. It has thus become mandatory to better understand and monitor its spatiotemporal distribution on a global and centennial scale. In particular, the locations and strengths of the CH4sources are not sufficiently quantified yet (IPCC,
2001). An obstacle for the quantification of surface sources is that measurements of small variations on top of a large background of this well-mixed gas are required. Therefore, measurements with both high precision and global coverage are needed.
High-precision measurements of in-situ mixing ratios are realized by surface-sampling sites of the GAW (Global At-mosphere Watch) and NOAA/CMDL (National Oceanic and Atmospheric Administration Climate Monitoring and Diag-nostics Laboratory) networks. By the inverse modeling of these in-situ measurements the global atmospheric CH4
cy-cle has been characterized and the average uncertainties of CH4source magnitudes could be reduced by more than one
third (Hein et al., 1997).
Ground-based solar FTIR (Fourier Transform Infrared) spectrometry sites operated within the NDSC (Network for the Detection of Stratospheric Change) are yielding vertical total columns of CH4. The Zugspitze FTIR is a so called
Primary-Status instrument within the NDSC, which certifies both operationality and data quality on a highest level. These ground-based total-column measurements are crucial for the validation of the upcoming satellite missions dedicated to the measurement of greenhouse gases, and are likely to become important constraints on the geographic and temporal distri-bution of CH4sources and sinks in the future.
Satellite-borne remote sounders are also providing total columns and have the potential to add the required infor-mation on the global distribution of CH4 to the highly
ground-truthing. The first global maps of CH4columns have
been retrieved from IMG/ADEOS thermal infrared (TIR) nadir spectra (Kobayashi et al., 1999). The results show qualitatively the expected variability, for example the North-South hemispheric gradient (Clerbaux et al., 2003). The CH4
amounts retrieved from TIR nadir observations are relatively insensitive to changes within the lower troposphere, however. Meanwhile, another satellite instrument has achieved the potential to retrieve global information on CH4, i.e., the
Scanning Imaging Absorption Spectrometer for Atmospheric CHartographY (SCIAMACHY), which is a UV/visible/near-infrared spectrometer onboard ENVISAT launched in 2002 (Bovensmann et al., 1999). Due to the near-infrared (NIR) spectral domain the SCIAMACHY nadir measurements of CH4are highly sensitive to concentration changes at all
alti-tude levels, including the boundary layer (see Sect. 3). In this paper we focus on the validation of the SCIA-MACHY scientific total-column product retrieved at the University of Bremen by the Weighting Function Modified DOAS (WFMD) algorithm (Buchwitz and Burrows, 2004; Buchwitz et al., 2005a, b), which utilizes an iterative spec-tral fitting by scaling of an US-standard a priori profile. CH4
has been retrieved from the 2265–2280 nm spectral region. Simultaneously, oxygen (O2)columns have been retrieved
from the oxygen A band (around 760 nm). This enables the dry-air column averaged mixing ratio, denoted as XCH4, to
be determined: XCH4:=CH4-column/O2-column×0.2095,
where 0.2095 is the O2 mixing ratio of dry air. This
nor-malization is a means of significantly improving the attain-able measurement precision, because many systematic errors are common to the CH4and O2spectrometric retrievals,
re-spectively, and thus cancel out (e.g., errors in pressure or zenith angle are propagating in a similar way to the retrieved columns of CH4 and O2). Our validation study refers to
version 0.4 of the WFMD product 2003 data set, that has been released via the internet on 6 September 2004, includ-ing all consolidated SCIAMACHY level-1B products avail-able for 2003, i.e., 153 days from the time period January 2003–October 2003. Additionally, we validate the version 0.41 XCH4 data update, released on 30 September 2004,
which includes an a-posteriori time-dependent bias correc-tion, based on a channel-8 throughput analysis. Our study is the first validation of this (WFMD version 0.41) promis-ing attempt to compensate for the time-dependent slit func-tion changes due to the SCIAMACHY-channel 8 ice-build up. (XCH4version 0.41 also utilizes a normalization by CO2
rather than O2, which has the advantage of being retrieved
in a spectral domain that is spectrally more closely neigh-bored to the target species). The SCIAMACHY CH4
scien-tific product plays a key role for the users community, since there has been no operational product for CH4 released by
ESA yet.
An initial comparison of WFMD CH4retrievals to global
models showed that the measured column amounts agree with the model columns within a few percent. For individual
measurements the standard deviations of the difference with respect to the models were found to be in the range of 100– 200 ppbv (5–10%) for XCH4(Buchwitz et al., 2005a). Early
characterization studies of SCIAMACHY scientific products have also been presented at the Second Workshop on the At-mospheric Chemistry Validation of ENVISAT (ESA, 2004). In this paper we want to promote the validation and mat-uration of SCIAMACHY XCH4by comparing the WFMD
v.04 and v0.41 retrievals to the ground-based correlative so-lar FTIR data of the clean air site Zugspitze. The goal of this paper is i) to thereby assess the overall bias of WFMD v0.4 and 0.41, ii) characterize the time-dependent bias (ice issue) in detail, in particular the intended effect from the version 0.4 to 0.41 update, and ii) to address the question, to which degree the precision of the WFMD retrievals allows to reflect the true atmospheric variability of CH4in a realistic manner
– both for the version 0.41 at hand, and under the assump-tion that the problem of time-dependent bias could be further reduced in future WFMD-data updates.
2 The correlative ground-data set from Zugspitze solar FTIR
Validation is performed using the ground-based data that are being recorded by the NDSC-Primary Status solar FTIR in-strument at the Zugspitze (47.42◦N, 10.98◦E, 2964 m a.s.l.) continuously. The Zugspitze-FTIR instrument and retrieval-set up has been described in detail elsewhere (Sussmann et al., 1997; Sussmann, 1999). Briefly, a high-resolution Bruker IFS 120 HR Fourier Transform Spectrometer is op-erated with an actively controlled solar tracker, and liquid-nitrogen cooled MCT (HgCdTe) and InSb detectors.
The Zugspitze CH4 total columns are retrieved by using
non-linear least squares spectral fitting software (SFIT) ini-tially developed at NASA Langley Research Center (Rins-land et al., 1984). For the CH4 total-column retrievals we
applied a strong smoothness constraint based upon a VMR a priori profile obtained from balloon-borne FTIR measure-ments (provided by G.C. Toon, JPL/NASA). We have chosen this conservative approach for the validation purpose of this paper, i.e., we are not performing a full profile retrieval (e.g., via optimal estimation). This is because there are still un-resolved spectroscopic problems for CH4, like line mixing,
that can propagate into erroneous profiles retrievals via the forward model, leading to subsequent errors in the retrieved columns. This effect is minimized by applying a strong smoothness constraint to the retrievals. The HITRAN-2000 molecular line parameters compilation was used (Rothmann et al., 2003), and daily p-T-profiles from the Munich radio sonde station (located 80 km to the north of the Zugspitze) have been utilized.
For the CH4 column retrievals two different
spec-tral domains from routine-measurement operations were utilized, i.e., a MCT-detector domain micro-window at
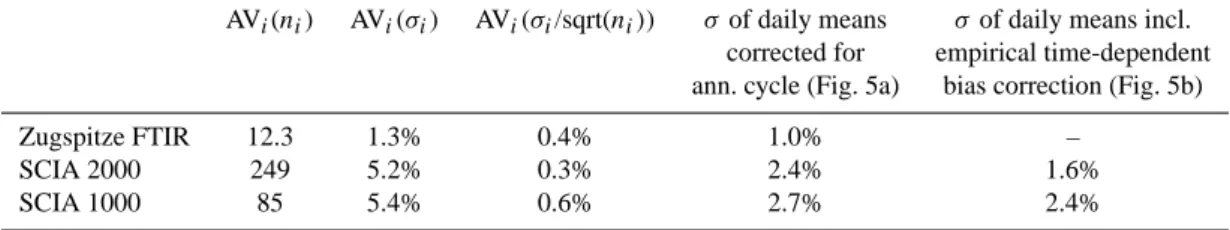
Table 1. Statistics of XCH4data scatter for FTIR and WFMD v0.41 measurements and time periods as indicated in Fig. 5. The index
for the number of measurement days is i. First column: AVi(ni), i.e., average of the numbers ni of individual measurements during each measurement day. Second column: AVi(σi), i.e., average of the “single-value standard deviations” calculated from the individual measurements for the different days. 3rd column: AVi(σi/sqrt(ni)), i.e., average of the “standard deviations of the daily mean values” calculated from the individual measurements for the different days. 4th column: Standard deviations of daily means calculated from the daily-means data sets as shown in Fig. 5a, i.e., normalized to the annual cycle (polynomial fit to FTIR). 5th column: Standard deviations of daily means calculated from the daily-means data sets as shown in Fig. 5b, i.e., after applying an empirical time-dependent bias-correction (polynomial fit to WFMD v0.41). SCIAMACHY data were taken within a 2000-km pixel-selection radius around the Zugspitze for each day (“SCIA 2000”), and a 1000-km selection radius (“SCIA 1000”), respectively.
AVi(ni) AVi(σi) AVi(σi/sqrt(ni)) σof daily means σ of daily means incl. corrected for empirical time-dependent ann. cycle (Fig. 5a) bias correction (Fig. 5b)
Zugspitze FTIR 12.3 1.3% 0.4% 1.0% –
SCIA 2000 249 5.2% 0.3% 2.4% 1.6%
SCIA 1000 85 5.4% 0.6% 2.7% 2.4%
1201.80–1202.65 cm−1, (859 spectra recorded on 133 mea-surement days in 2003; each spectrum resulted from integrat-ing 8 interferometric scans with a 250-cm optical path dif-ference within 20 min) and an InSb-detector domain micro-window at 2835.55–2835.85 cm−1(781 spectra recorded on 133 measurement days in 2003; each spectrum resulted from 5 scans with a maximum optical path difference of 175 cm integrated within 10 min). I.e., on average 6.5 MCT-spectra and 5.8 InSb MCT-spectra were recorded per day, yield-ing 6.5+5.8=12.3 retrieved columns per day. The accura-cies and precisions for CH4vertical-column retrievals from
single ground-based FTIR measurements are well charac-terized and understood and have been estimated from sen-sitivity studies to be below 6.5% and 2.5%, respectively, see, e.g., Zander et al. (1989). The actual numbers depend somewhat on changing geophysical parameters like the ac-tual solar zenith angle. Daily mean columns were calcu-lated using the arithmetic mean of the individual columns. From the above error numbers the precision of a daily-mean column from our FTIR retrievals is estimated to be below 2.5%/sqrt(12.3)=0.7%. We will show in Sect. 4.2.1 below, that we find an even smaller number of 0.4% for the preci-sion of a daily mean XCH4 columns derived directly from
our real FTIR measurements.
We calculated Zugspitze XCH4, i.e., air-column averaged
mixing ratios for the validation purpose of this paper by di-viding the FTIR CH4columns by the air columns calculated
from the daily radio soundings. Note that alternatively, other authors have used for the ground-based retrievals a normal-ization to O2columns measured by FTIR at the same time
(Washenfelder et al., 2003), i.e., an analogous approach as described for the satellite retrievals above. On the one side this helps to significantly improve the precision. On the other hand, this increases the uncertainties in the absolute XCH4
values due to additional errors from the O2spectroscopic
pa-rameters propagating into the result.
3 Validation approach
First we focus on investigating the bias of absolute XCH4
values. The retrieval of WFMD version 0.4 XCH4includes
an empirical column scaling factor, i.e., an O2column
scal-ing factor or 0.85 (no scalscal-ing factor for CH4), which will be
validated. Version 0.41 XCH4data include a time-dependent
bias correction in order to account for the icing issue of SCIAMACHY channel 8, and a normalization to CO2
in-stead of O2, which both will be validated.
Subsequently, validation focus will be put in our study on precision and dynamic response of the SCIAMACHY re-trievals. I.e., we will investigate, whether the atmospheric day-to-day variabilities, which are dominated by dynami-cally induced tropopause movements, can be retrieved from the SCIAMACHY data. Furthermore, we find from the Zugspitze FTIR measurements, that the amplitude of the si-nusoidal XCH4annual cycle (dominated by the tropopause
annual cycle) is only slightly larger than the standard devi-ation of the day-to-day scatter (see Sect. 4). Therefore, it is challenging to investigate the potential of the SCIAMACHY retrievals to reflect the dynamic response to this weak annual cycle in spite of limited precision and time dependent biases due to the detector-icing issue.
Our approach to this is as follows. Individual WFMD re-trievals in the near-infrared spectral domain are showing a significant scatter. The reasons are discussed in detail by Buchwitz and Burrows (2004) and Buchwitz et al. (2005a). Therefore, our validation approach is investigating to what extent the quality of SCIAMACHY data allows to approach the true variability of CH4 columns as a function of the
amount of the averaging of individual measurements per-formed in time and space. For this purpose, we are using daily-mean pixel averages within a stepwise increased selec-tion radius around the Zugspitze ground site. The goal is to thereby stepwise reduce the scatter of the daily means by statistically averaging over increasing ensembles of pixels.
One might argue that also source and sink regions may be more and more included into the ensemble while increasing the selection radius, and this could potentially be compensat-ing the statistical effect of reduccompensat-ing the scatter of the daily means. However, this effect is obviously weaker than the re-duction of scatter by the statistical effect of increasing the averaging ensemble, as our test of the statistical parameters in Sect. 4 (Table 1) below is proving.
Since we are using selection radii of up to 2000 km around the Zugspitze, i.e., daily averages of XCH4 values from all
the SCIAMACHY pixels available within this radius for that day, the question arises how i) the absolute XCH4 values,
ii) the amplitude of their annual cycle, and iii) the day-to-day variability of the 2000-km averages compare to the cor-responding quantities seen in the column time series above the center site (i.e., the Zugspitze). Ad i) we state that we expect no significant bias (i.e., less than a few percent) be-tween the daily average column averaged mixing ratio above a single site (e.g., 47◦N, 11◦E), and an average over a 2000-km radius around that site on that day. The argumentation for this is as follows. First of all, we obtained a standard deviation of the individual SCIAMACHY column averaged mixing ratios of ≈5.2% using all pixels per day within the 2000-km selection radius (Sect. 4.2.3, Table 1). Using this value we derive an estimate of the standard deviation of the true individual XCH4 values within the 2000-km radius of
≈4% per day. This is obtained assuming a quadratic error superposition of the true scatter together with the known sta-tistical SCIAMACHY error sources, i.e., instrumental noise causing an ≈1% error (Buchwitz et al., 2005a) as well the so called-retrieval noise of ≈3% (the latter resulted from a com-parison to models in Buchwitz et al., 2005b). We state that this variability of ≈4% within the 2000-km selection circle is dominated by regional sources and sinks, and this scatter-ing effect appears strongly reduced by a factor in the order of
≈10, considering the “standard deviation of the mean value” of all radius-2000-km values, as done in Sect. 4.2.3 below (Table 1). From these considerations it is obvious, that we do not expect any significant bias between the column averaged mixing ratio obtained at the Zugspitze site (which shows a day-to-day variability of only ≈1% and is located in the free troposphere and is therefore representative for a wider hor-izontal area), versus that obtained from the 2000-km radius average. In particular, it becomes clear that the current study focusing upon characterization of a time-dependent bias of SCIAMACHY in the order of ≈10%, is not significantly af-fected by any possible bias due to the horizontal averaging. As an additional effect, the well known north-south gradient in the tropopause altitude results in an absolute tropopause increase of ≈2 km between the northern boarder and the southern boarder of our selection circle. However, this trans-fers only to a gradient of XCH4of ≈2% expected between
the northern and southern boarder. The underlying relation for the change of XCH4with the tropopause altitude was
de-rived using an ensemble of radio-sonde pressure-temperature
profiles with differing tropopause altitudes, together with a methane volume mixing ratio profile that was iteratively distorted according to varying tropopause altitudes (vertical scale linearly compressed or stretched below and above the tropopause, respectively, or vice versa). I.e., there is a small north-south increase of the columns within our selection ra-dius on the ≈2% level, but since it is to a good approxima-tion a linear increase, this does not introduce any significant bias to the 2000-km average versus the center-site value, con-sidering the magnitude of the effect we are investigating in this study, i.e., the ≈10% time-dependent bias effects. Ad ii) we expect the amplitude of the annual cycle in the 2000-km radius daily averages to be very close to the magnitude of the amplitude at the center (Zugspitze) site. For an ex-planation, we make reference to the FTIR station at Iza ˜na (Teneriffa, 28◦N, −16◦E) which shows an amplitude of the
annual cycle of ≈1% (I. Kramer, personal communication, 2005), which is within the same order of magnitude as the Zugspitze amplitude of ≈1.6% (see Sect. 4.2.1), and shows the same phase. Since the annual cycles both at the center site (Zugspitze) and at the southern boarder site (Iza ˜na) are in the same order of ≈1–2%, and they are showing the same phase, we conclude, that the amplitude of the annual cycle of the full 2000-km XCH4average is also within this same order
of ≈1–2%, i.e., it is by no means expected to be completely different in amplitude or phase. Ad iii) we state that the day-to-day variability of the 2000-km radius average is proba-bly in the same order of magnitude as that above the center (Zugspitze) site (≈1%), with a tendency to be smaller. We derive this from the consideration that day-to-day variabili-ties of column averaged methane are caused by tropopause movements due to synoptic planetary-wave activity, and this effect might be somewhat reduced due to averaging, when using the 2000-km radius mean XCH4 values, compared to
when using individual-site values.
Another issue of the validation approach is how to reduce the impact of varying ground altitudes of the different satel-lite pixels that are averaged on one hand, and the (higher) altitude of the Zugspitze mountain site on the other hand. We solve this problem by focusing our validation study on XCH4 data, i.e., the column averaged mixing ratios. This
quantity does not depend on the average pixel ground-level altitude, assuming a constant mixing ratio with altitude. This approximation does not introduce significant additional er-rors, as measured CH4profiles are typically showing nearly
constant volume mixing ratios as a function of altitude up to the tropopause. Deviations from this behavior are in the few per cent range, with a tendency to approach perfectly con-stant mixing rations as a function of altitude after averaging of only a few profiles.
Related to this issue, one might argue whether a high-altitude mountain site or a low-high-altitude ground site, located in the boundary layer, is to be preferred for satellite validation of tropospheric species like CH4. On the one hand, as
relative to the satellite-pixel ground altitude has to be prop-erly considered, which may introduce errors on the per-cent level. On the other hand, a high-altitude site like the Zugspitze located above the boundary layer has the advan-tage to be representative for a much wider horizontal area, and that is exactly what the satellite data are – we will show below that not only the pixel size of the satellite data (60×30 km footprint), but even larger horizontal averages, e.g., selection radii in the order of 1000 km, have to be con-sidered for the validation purposes.
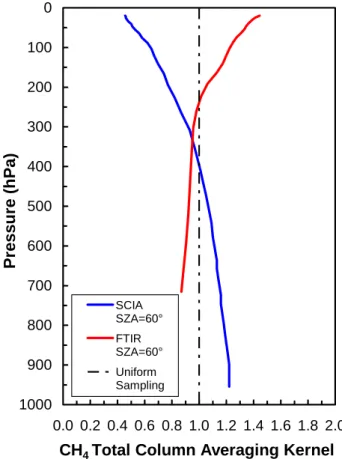
Finally, an important issue in intercomparing two differ-ent remote-sounding systems (satellite versus ground) is to properly take their altitude-dependent sensitivities, i.e., their averaging kernels (Rodgers, 1990) into account. In case of strongly differing kernels, neglecting the effect of dif-ferent smoothing errors can result in intercomparison er-rors in the order of the natural variability of the trace-gas columns (Rodgers and Connor, 2003). However, in our case we encounter the nearly ideal situation, that the ground-based (FTIR) and satellite (SCIAMACHY) instruments are both sampling the CH4columns with nearly the same
total-column averaging kernels as shown in Fig. 1, i.e., both being close to the ideal uniform sampling. The FTIR kernel shown is a weighted mean of the two (slightly differing) FTIR ker-nels we obtain from utilizing the two different spectral micro-windows from alternating MCT and InSb measurements as described in Sect. 2. This mean was weighted by the number ratio of all spectra of the two different spectral domains used in our study (i.e., 859/781, see Sect. 2). The resulting ef-fective FTIR kernel shows only minor differences relative to the SCIAMACHY-WFMD kernel, e.g., at the 700 hPa level, there is a slight under-estimation of the natural variability of ≈13% by FTIR, and a slight overestimation of ≈14% by SCIAMACHY (Fig. 1). In the stratosphere the situation is reversed, with the underestimations/overestimations increas-ing with altitude. However, due to the decreasincreas-ing air-number density the latter does not quantitatively impact the total columns retrieved. To prove this quantitatively, we calculated the smoothing errors sqrt[(aFTIR–aideal)T Sa(aFTIR–aideal)]
for the total columns using the kernels (vectors aFTIR and
aWFMD)shown in Fig. 1, and the total-column kernel aideal
of an ideal remote-sounding system with aTideal=(111...1). For
Sa we adapted a best-estimate variance-covariance matrix
of the atmospheric CH4 variabilities. The relative vertical
change of the diagonal elements (variances) were adopted from results of the Karlsruhe Simulation Model of the Mid-dle Atmosphere (KASIMA). The absolute values of the vari-ances were then scaled in order to reflect the total-column day-to-day variability found by our FTIR measurements (this procedure will be detailed with numbers in Sect. 4 below). For the off-diagonals (covariances) a Gaussian-shaped inter-layer correlation with length of 2.5 km was used. Thereby we end up with smoothing errors of 0.10% for FTIR and 0.14% for SCIAMACHY WFMD, respectively. These errors are small relative to the bias found between FTIR and
SCI-0 100 200 300 400 500 600 700 800 900 1000 0.0 0.2 0.4 0.6 0.8 1.0 1.2 1.4 1.6 1.8 2.0
CH
4Total Column Averaging Kernel
Pr
essu
re
(h
Pa)
SCIA SZA=60° FTIR SZA=60° Uniform SamplingFig. 1. Total-column averaging kernels for Zugspitze FTIR (red
line) and SCIAMACHY-WFMD CH4retrievals (blue line)
calcu-lated for a solar zenith angle (SZA) of 60◦.
MACHY WFMD, and relative to the differences in day-to-day scatter encountered for FTIR and WFMD, respectively during our intercomparisons of Sect. 4. For consistency rea-sons, we briefly state that we do not distinguish between smoothing errors of CH4 columns and XCH4, respectively,
i.e., we are neglecting the smoothing error contribution from the CO2retrieval (being part of the WFMD XCH4retrieval)
throughout this paper. This simplification is valid because the natural variability of column averaged CO2is known to be
significantly (≈ factor 4) smaller than for CH4(Buchwitz et
al., 2005a). All in all, our validation results are not impacted significantly by smoothing errors. In Sects. 4.1.2 and 4.2.2 we will add absolute numbers as to this (small) smoothing-error effect on the bias and relative day-to-day scatter we ob-tained during our intercomparison study.
It is noteworthy, that the SCIAMACHY retrievals (and also the ground-based measurements) are perfectly sensitive down to the lower troposphere. This is indicated by the ker-nels in Fig. 1 showing numbers significantly above zero. This is due to the near-infrared spectral domain utilized for the SCIAMACHY retrievals, and is advantageous over thermal-IR satellite retrievals which are showing a reduced sensitivity in the boundary layer.
1400 1500 1600 1700 1800 1900 2000
Dec-02 Mar-03 May-03 Aug-03 Nov-03
Date XCH 4 ( ppbv) (a) 0.8 0.9 1.0 1.1 1.2 1.3
Dec-02 Mar-03 May-03 Aug-03 Nov-03
Date
XCH
4S
C
IA
/ X
C
H
4FTI
R
(
pol.
3
rdo.
)
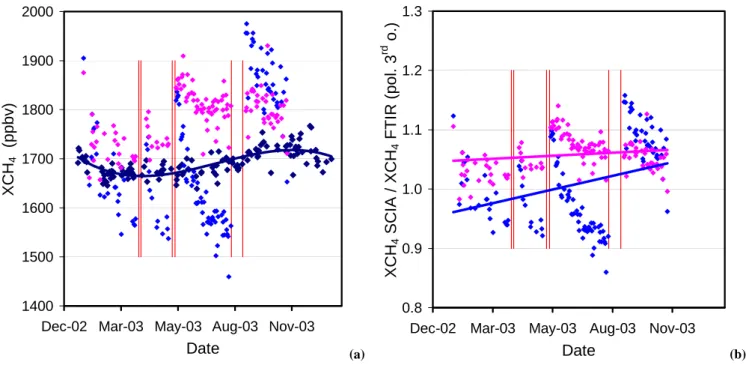
(b)Fig. 2. (a) XCH4daily-mean values plotted for FTIR (dark blue, incl. 3rd order polynomial fit) and averages of all SCIAMACHY WFMD
data for a 2000-km selection radius around Zugspitze for each day; v0.4 (azur) and v0.41 (pink). (b) SCIAMACHY XCH4data (azur: v0.4,
pink: v0.41) divided by the 3rd order polynomial fitted to the FTIR data taken from (a). SCIAMACHY decontamination phases are indicated by red vertical lines.
4 Validation results
4.1 Overall bias
4.1.1 Correlative study FTIR versus WFMD: bias
Figure 2a shows all SCIAMACHY WFMD XCH4data
cur-rently available (i.e., versions 0.4 and 0.41). Each SCIA-MACHY data point is the average of all pixels from one day within a 2000-km radius around the Zugspitze. Cloud flagged pixels have been removed, and we restricted the WFMD data to a maximum threshold of 10% in the indi-vidual retrieval errors reported. Additionally, a flag for er-roneous retrievals had been added with the version 0.41 re-lease, and, subsequently, we excluded all error-flagged data for both versions (i.e., 0.4 and 0.41) for this study. Zugspitze FTIR daily-mean XCH4data are shown in the same plot. A
3rd order polynomial fit to the FTIR data nicely shows the XCH4annual cycle with a ≈1.6% amplitude.
In order to obtain the bias of the SCIAMACHY WFMD data relative to the FTIR data we normalized the SCIA-MACHY data by the 3rd order polynomial fit to the FTIR data. The result is shown in Fig. 2b. Note, that we do not investigate pairwise “coincidences”, as performed in many validation studies. Rather, we herewith propose the approach of fitting a polynomial to the reference series (FTIR) that is subsequently used as a reference. This
ap-proach allows to compare time series even in case of al-ternating time-gaps, which would not allow for the use of “coincidences”. This is partially the case for our time se-ries of SCIAMACHY (measurement gaps due to decontam-ination phases) and FTIR (measurement gaps due to the clear-sky requirement). From Fig. 2b we retrieve an overall XCH4bias for WFMD v0.4/FTIR=1.008±0.019 and WFMD
v0.41/FTIR=1.058±0.008. The statistical errors of the bi-ases given are 3× standard deviation/sqrt(n), where n=126 is the number of the WFMD data points.
4.1.2 Estimate of intercomparison error: impact on bias
We briefly want to estimate, whether the bias of 5.8% found for WFMD v0.41 can be partially affected by the slightly differing averaging kernels, and the different a priori pro-files used for FTIR and WFMD, respectively. Therefore, we calculated the term aTFTIR(xaFTIR–xaWFMD)/total
col-umn=0.74% and the analogous term, i.e., aTWFMD(xaWFMD–
xaFTIR)/total column=0.93%, where a are the total-column
averaging kernel vectors and xaare the vectors of the a
pri-ori profiles. The numbers obtained indicate that the effect from slightly differing a priori profiles and averaging kernels is only a minor contribution to the observed bias of WFMD v0.41.
0.8 0.9 1.0 1.1 1.2
Dec-02 Mar-03 May-03 Aug-03 Nov-03
Date
XCH
4anom
a
ly
Fig. 3. Dark blue points: Anomaly of Zugspitze FTIR XCH4daily means. Dark blue line: 3rd order polynomial fit to FTIR data. Azur points: Anomaly of SCIAMACHY WFMD v0.4 XCH4; average of all data within a 2000-km radius around Zugspitze for each day. Pink points: Same as azur points but for SCIAMACHY WFMD v0.41. SCIAMACHY decontamination phases are indicated by red vertical lines.
4.2 Time-dependent bias, precision, and variability
4.2.1 Precision and variability of the FTIR column data set
Figure 3 shows the FTIR data set (together with WFMD v0.4, WFMD v0.41), but now plotted as anomaly, i.e., the daily mean data are normalized with respect to their overall average. First, is obvious that the FTIR data are monitor-ing a sinusoidal annual cycle with a ≈1.6% amplitude. The dominant cause for this is the corresponding annual cycle of the tropopause altitude. Second, it is obvious that the FTIR daily-mean data are showing some scatter of ≈1% around this sinusoidal cycle. We will show below that this variabil-ity is not caused by limited precision of the FTIR measure-ments but is dominated by the true atmospheric day-to-day variability caused by the dynamic effect of planetary-wave activity.
In the following we want to investigate statistical parame-ters describing the scatter of the FTIR data in detail. Table 1 gives in the first 3 columns the statistical numbers describing the “individual” (FTIR) measurements within one measure-ment day. On average over the ensemble of i=133 FTIR mea-surement days, 12.3 FTIR column meamea-surements have been performed per day. As a measure for the precision of indi-vidual FTIR measurements, the overall average of the stan-dard deviations σi of the individual measurements of each
0.8 0.9 1.0 1.1 1.2
Dec-02 Mar-03 May-03 Aug-03 Nov-03
Date XCH 4 anom aly / FTI R anomaly ( pol. 3 rd o.)
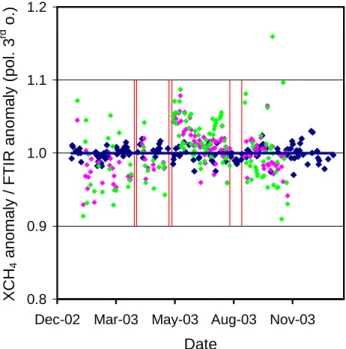
Fig. 4. Dark blue points: Zugspitze FTIR XCH4anomaly daily
means normalized to the annual cycle (i.e., the 3rd order polyno-mial of Fig. 3). Pink points: SCIAMACHY WFMD v0.41 XCH4
anomaly; average of all pixels within a 2000-km radius around Zugspitze for each day normalized to the annual cycle (i.e., the 3rd order polynomial of Fig. 3). Green points: Same as pink points but for a 1000-km selection radius around Zugspitze. SCIAMACHY decontamination phases are indicated by red vertical lines.
day is given in Table 1, i.e., AVi(σi)=1.3% for FTIR.
Fur-thermore, as a measure for the statistical error for one FTIR daily-mean value, the overall average for the daily “standard deviations of the mean value”, i.e., AVi(σi/sqrt(ni))
calcu-lated from the individual measurements is given in Table 1. AVi(σi/sqrt(ni))equals 0.4% for FTIR.
Now we discuss the standard deviations calculated from the FTIR “daily-mean” data. Of course, prior to this calcu-lation from the daily means, the FTIR time series has to be normalized with respect to its obvious annual cycle. See, e.g., Fig. 4 for the result of this normalization. Table 1 shows in column 4 that the resulting standard deviation for FTIR is 1%.
Finally, we want to discuss the obvious discrepancy be-tween the standard deviations we calculated from the daily mean data (1% for FTIR, see Table 1), and the average sta-tistical error of the daily means calculated from the indi-vidual measurements, which is AVi(σi/sqrt(ni))=0.4% for
FTIR. Clearly the numbers indicate, that the standard de-viation of 1% obtained from the FTIR daily means is dominated by true atmospheric day-to-day-variability due to tropopause movements, and not by the statistical error (due to limited single-measurement precision) which is only AVi(σi/sqrt(ni))=0.4%.
4.2.2 Estimate of intercomparison error: impact on vari-ability
Here we like to address the question, to which degree pos-sible differences in the day-to-day variability observed by the FTIR and WFMD, respectively might be attributed to smoothing errors. In the following we present a simple but quantitative estimate for FTIR and WFMD retrievals.
We write the variance of daily-mean total columns
colFTIRobserved by FTIR as σ2(colFTIR)=aTFTIRSaaFTIR+
σ2(εFTIR), where vector aFTIR is the total-column
averag-ing kernel, and Sa is the a priori variance-covariance
ma-trix described in Sect. 3 above. The term aTFTIR Sa aFTIR
describes the variance due to the true variability of the at-mosphere, smoothed by the measurement. By the second term σ2(εFTIR), we denote all further contributions which
do not originate from the true variability of the atmosphere, i.e., contributions due to any kind of random-type measure-ment errors. Using σ (colFTIR)=1% from Table 1, and using
for the error term σ (εFTIR)=AVi(σi/sqrt(ni))=0.4% (see
Ta-ble 1), we find that it should hold sqrt(aT
FTIRSaaFTIR)/total
column=0.92%. We now use aFTIR of Fig. 1 and scale Sa
to fulfil this relation. (See Sect. 3 for the adopted principle shape of Sa.) Using the resulting best-estimate Sa we
cal-culate for WFMD analogously sqrt(aTWFMDSaaWFMD)/total
column=0.93%. For an ideal observing system with
aTideal=(111. . . 1) we would obtain sqrt(aTidealSa aideal)/total
column=0.94%. These numbers tell us that FTIR is under-estimating the true variability by a factor of 0.92/0.94=0.98 and WFMD by a factor of 0.93/0.94=0.99 due to the smooth-ing effect. These underestimations are both similar to each other, and small in absolute terms. This means that possi-ble differences in the day-to-day variability observed by the FTIR and WFMD, respectively (as discussed in the next Sec-tion) do not contain significant contributions from smoothing errors.
4.2.3 Correlative study FTIR versus WFMD: Time-dependent bias, precision, and variability
Figure 2b shows that the time-dependent bias correction in-troduced with version 0.41 for XCH4WFMD, in order to
ac-count for the icing issue, did result in a significant reduction in the time dependence of the bias relative to version 0.4. This holds for both the time dependencies on the monthly scale, i.e., in between the various decontamination phases (marked by red vertical lines in Fig. 2b), as well as for the overall time dependence of the bias on the annual scale, as indicated by the linear fits in Fig. 2b.
Figure 3 again shows the three data sets (FTIR, WFMD v0.4, WFMD v0.41) but now plotted as anomalies, i.e., each data set is normalized with respect to its overall average. This shows even more obvious than Fig. 2a, that the changes asso-ciated with the version 0.41 update succeeded in significantly reducing the time-dependent bias compared to version 0.4.
However, Fig. 3 also shows, that there is still a residual time dependence also in the version 0.41 data, which is clearly related to the decontamination cycles.
Figure 4 shows the WFMD v0.41 daily data both averaged for a selection radius of 1000 km around Zugspitze, as well as for a 2000-km radius. Note, that in Fig. 4 all three data sets have additionally been normalized to the annual cycle, i.e., the 3rd order polynomial fit to the FTIR data shown in Fig. 3. Figure 4 shows that the scatter of the daily WFMD data clearly exceeds the scatter of the FTIR daily means. It can also be seen that the WFMD data for a 1000-km selection radius are showing a higher scatter compared to the WFMD data for a 2000-km selection radius, as expected.
The question arises whether the scatter of the WFMD data in Fig. 4 is limited by systematic issues like a residual time-dependent bias due to the icing issue, or by the lim-ited precision of the individual column retrievals, i.e., the limited signal-to-noise ratio of the SCIAMACHY spectra. This is further investigated in Fig. 5a. We restrict here to SCIAMACHY data out of one uninterrupted measurement period between two decontamination phases, i.e., the period 25 May–12 August 2003. We haven chosen this time pe-riod, because here a systematic time dependence of WFMD-selection-radius-2000-km data can be most clearly identified, see Fig. 5a. Figure 5a shows a polynomial (2nd order) fit to this time dependence of the WFMD-selection-radius-2000-km data, which reflects a residual time-dependent bias of
≈3%/month. In Fig. 5b the WFMD data (both for 1000-km and 2000-km selection radii) are empirically normalized to this time dependence.
Having eliminated all residual systematic time dependence on an empirical best-effort basis (Fig. 5b), the next step is to investigate the statistical parameters describing the scatter of the WFMD version 0.41 data in comparison to the scat-ter of FTIR data in full detail. First, Table 1 gives the sta-tistical numbers describing the “individual” measurements for FTIR and WFMD v0.41. While the number of days for which FTIR data exist (133) is comparable to the number of data for which WFMD data exist, Table 1 shows that av-erage AVi(ni)of the number ni of daily measurements are
quite different, i.e., 12.3 FTIR measurements per day on av-erage versus 249 and 85 individual WFMD measurements per day for a 2000-km and a 1000-km selection radius, re-spectively. As a measure for the precision of the individ-ual measurements AVi(σi), i.e., the overall average of the
standard deviations of the individual measurements of each day is given in Table 1. The precisions are quite different, i.e., AVi(σi)=1.3% for FTIR, and a factor of 4 lower
preci-sions are encountered for WFMD, i.e., AVi(σi)equals 5.2%
and 5.4% for calculation of AVi(σi)from the 2000-km and
1000-km selection ensembles, respectively. Note, that the WFMD single-measurement standard deviations are nearly identical (5.2 versus 5.4%), i.e., nearly independent on the size of the selected ensemble (1000-km versus 2000-km se-lection radius), as expected for an ideal random ensemble.
0.90 0.92 0.94 0.96 0.98 1.00 1.02 1.04 1.06 1.08 1.10
Dec-02 Mar-03 May-03 Aug-03 Nov-03
Date XCH 4 anomaly / FTIR anomaly (pol. 3 rd o. ) (a) 0.90 0.92 0.94 0.96 0.98 1.00 1.02 1.04 1.06 1.08 1.10
Dec-02 Mar-03 May-03 Aug-03 Nov-03
Date
XCH
4anomaly / FTIR
anomaly (pol. 3
rdo.
)
(b)Fig. 5. (a) Same as Fig. 4 but SCIAMACHY data restricted to 25 May–12 August 2003 and a polynomial fit performed to the SCIAMACHY
data with selection radius 2000 km. (b) Same as (a) but data normalized to the polynomial of (a). SCIAMACHY decontamination phases are indicated by red vertical lines.
Furthermore, as a measure for the statistical error for one daily mean value, the overall average for the daily “standard deviations of the mean value”, i.e., AVi(σi/sqrt(ni))
calcu-lated from the individual measurements is given in Table 1. AVi(σi/sqrt(ni))equals 0.4% for FTIR, and for WFMD 0.6%
and 0.3% for the 1000-km and the 2000-km selection radii, respectively. Note again, that this factor-of-two reduction of AVi(σi/sqrt(ni))on doubling the selection radius nicely
re-flects what we would expect for an ideal statistical ensemble. This confirms our assumption of Sect. 3, that the possible ef-fect that also source and sink regions may be more and more included into the ensemble while increasing the selection ra-dius might potentially compensate for the intended reduction of the standard deviation of the daily mean value (by increas-ing the selection radius), is quantitatively negligible. All in all we have found with a selection radius somewhere between 1000–2000 km the threshold, where the statistical errors of WFMD-daily-mean data become comparable to the ones of the FTIR, i.e. in the order of 0.5%. Note, that we had ob-tained a related result validating the species CO in our recent work (Sussmann and Buchwitz, 2005).
Now we discuss the standard deviations calculated from the daily mean data. Table 1 shows in column 5 and 6 the results with and without our empirical correction for a resid-ual systematic time dependence (see Figs. 5a and b). As an important result, it can be seen from Table 1, that in fact the scatter of the WFMD-selection-radius-2000-km-data had been limited by a residual systematic time dependence. This
results from the finding that the standard deviation of daily means could be reduced from 2.4% to 1.6% by our simple and merely illustrative empirical time-dependent bias correc-tion of Fig. 5b. Note, that this is now close to the day-to-day variability of ≈1% observed at the Zugspitze site. However, as stated earlier, an even smaller true day-to-day variability is expected for a 2000-km mean value due to the averaging effect (Sect. 3). I.e., there appears to be still some potential for further improvements.
Finally, we want to discuss the obvious discrepancy between the standard deviations we calculated from the daily-mean data (1% for FTIR and 1.6% for 2000-km-WFMD after correcting for annual cycle and time-dependent bias, see Table 1), and the average statisti-cal errors of the daily means statisti-calculated from the indi-vidual measurements, which is AVi(σi/sqrt(ni))=0.4% for
FTIR, and AVi(σi/sqrt(ni))=0.3% for 2000-kmWFMD, and
AVi(σi/sqrt(ni))=0.6% for 1000-kmWFMD, see Table 1.
In-terpretation is easy for FTIR, where no time-dependent drift is expected. Here clearly the numbers indicate that the stan-dard deviation of 1% obtained from the FTIR daily means is dominated by true atmospheric day-to-day-variability due to tropopause movements, and not by the statistical error (due to limited single-measurement precision) which is only AVi(σi/sqrt(ni))=0.4%. Interpretation for the satellite data
is not so straight forward. Here, we have to stress that the statistical error for a daily mean value, i.e., AVi(σi/sqrt(ni))
during the individual measurement days, i.e., it can in prin-ciple not describe time-dependent drifts on the weekly or monthly scale. Therefore the conclusion from our statistical numbers given above can only be, that WFMD data have the potential – as to their precision – to retrieve natural variabil-ities down to the 0.3% level for a 2000 km-selection radius and down to the 0.6% level for a 1000-km selection radius “if” all systematic type time-dependent drifts would/could be eliminated.
5 Conclusions
Solar FTIR measurements at the Permanent Ground-Truthing Station Zugspitze (47.42◦N, 10.98◦E, 2964 m a.s.l.), Germany were used to validate the EN-VISAT/SCIAMACHY Scientific Data Product for XCH4
retrieved at the University of Bremen, i.e., the near infrared WFM-DOAS version 0.4 and 0.41 products.
The averaging kernels of the ground-based FTIR tech-nique turned out to be similar shaped as the SCIAMACHY WFMD kernels, which both maintain a nearly uniform sam-pling down to the lower troposphere. Therefore, both a di-rect comparison of absolute column levels (bias) and the in-tercomparison of the day-to day-scatter is possible without introducing significant intercomparison errors from smooth-ing errors, which have been estimated to be below 0.10% for FTIR and 0.14% for SCIAMACHY WFMD retrievals, re-spectively.
In order to account for the altitude difference between the ground altitudes of the satellite pixels and the Zugspitze, XCH4 columns have been used for both the satellite and
ground-based data sets for the intercomparison. This ap-proach eliminates the effect of the altitude difference for the case of a constant volume mixing ratio throughout the alti-tude range to be accounted for. This assumption should hold for the case of the lower tropospheric CH4profile within the
per cent level.
Analysing the 2003-time series of the Zugspitze FTIR, we characterized the natural variability of XCH4. It displays
a 1% day-to-day variability and a sinusoidal annual cycle with a ≈1.6% amplitude which is both dominated by related tropopause movements.
In order to obtain the bias of the SCIAMACHY WFMD data relative to the FTIR data we used a new approach, i.e., we did not investigate pairwise “coincidences” (satel-lite versus ground), which are limited in number in case of data series with time-gaps (e.g., decontamina-tion phases, clear sky restricdecontamina-tions). Therefore, we fitted a polynomial to the reference series (FTIR) that is sub-sequently used as a reference. We obtained an overall XCH4bias for WFMD v0.4/FTIR=1.008±0.019 and WFMD
v0.41/FTIR=1.058±0.008.
Finally, we investigated whether WFMD is capable of re-flecting the natural atmospheric variability of XCH4as
char-acterized by FTIR. WFMD version 0.41 shows up with a break through in data quality relative to version 0.4 due to an a-posteriori time-dependent bias correction, that is based on a channel-8 throughput analysis. However, version 0.41 is still not yet able to capture the natural day-to-day variability on the ≤1% level because the standard deviation calculated from the daily-mean values is 2.4% using averages within a 2000-km radius, and 2.7% for a 1000-km radius. We have shown by a merely illustrative (additional) empirical time-dependent bias correction, that it is not the precision of the daily means, but the residual time-dependent bias of WFMD v0.41 (≈3%/month) what currently limits data quality – and that this can still be improved (e.g., from 2.4% to 1.6% by our illustrative empirical time-dependent bias correction). From analysis of the statistics of the individual measurements, we have shown that WFMD data have the potential – as to their pure precision, i.e., neglecting any time-dependent biases – to retrieve natural variabilities down to the 0.3% level for averaging data within a 2000-km selection radius and down to the 0.6% level for a 1000-km selection radius “if” all systematic type time-dependent drifts would/could be elim-inated. This means that the XCH4 annual cycle as well as
possibly the atmospheric day-to-day variability could be cap-tured under the prerequisite of further successful advanced time-dependent bias corrections, or the use of other channels, where the icing issue might be less prominent.
Acknowledgements. The authors like to thank A. Rockmann
(IMK-IFU) for maintaining the Zugspitze FTIR measurements. Funding by BMBF/DLR as part of the German SCIAMACHY validation program (GCVOS) via contract DLR 50 EE 0007 and by the EC within the project UFTIR (contract EVK2-CT-2002-00159) is gratefully acknowledged. This work is contributes to the ESA-ENVISAT-Validation-Project TASTE and is part of the EC-Network of Excellence ACCENT-TROPOSAT-2.
Edited by: P. C. Simon
References
Bovensmann, H., Burrows, J. P., Buchwitz, M., Frerick, J., No¨el, S., Rozanov, V. V., Chance, K. V., and Goede, A.: SCIAMACHY – Mission Objectives and Measurement Modes, J. Atmos. Sci., 56, 127–150, 1999.
Buchwitz, M. and Burrows, J. P.: Retrieval of CH4, CO, and CO2
total column amounts from SCIAMACHY near-infrared nadir spectra: Retrieval algorithm and first results, in Proc. SPIE 5235, Remote Sensing of Clouds and the Atmosphere VIII, edited by: Sch¨afer, K. P., Comeron, A., Carleer, M. R., and Picard, R. H., 375–388, 2004.
Buchwitz, M., de Beek, R., Burrows, J. P., Bovensmann, H., Warneke, T., Notholt, J., Meirink, J. F., Goede, A. P. H., Bergam-aschi, P., K¨orner, S., Heimann, M., Muller, J.-F., and Schulz, A.: Atmospheric methane and carbon dioxide from SCIAMACHY satellite data: initial comparison with chemistry and transport models, Atmos. Chem. Phys., 5, 941–962, 2005a,
Buchwitz, M., de Beek, R., No¨el, S., Burrows, J. P., Bovensmann, H., Bremer, H., Bergamaschi, P., K¨orner, S., and Heimann, M.: Carbon monoxide, methane and carbon dioxide columns re-trieved from SCIAMACHY by WFM-DOAS: Year 2003 initial data set, Atmos. Chem. Phys. Discuss., 5, 1943–1971, 2005b,
SRef-ID: 1680-7375/acpd/2005-5-1943.
Clerbaux, C., Hadji-Lazaro, J., Turquety, S., Megie, G., and Coheur, P.-F.: Trace gas measurements from infrared satellite for chem-istry and climate applications, Atmos. Chem. Phys., 3, 1495– 1508, 2003,
SRef-ID: 1680-7324/acp/2003-3-1495.
ESA: Proceedings of the Second Workshop on the Atmospheric Chemistry Validation of ENVISAT (ACVE-2), 3–7 May 2004, ESA-ESRIN, Frascati, Italy, SP-562, ISBN 92-9092-873-5, ESA Publications Division, ESTEC, The Netherlands, 2004. Hein, R., Crutzen, P. J., and Heimann, M.: An inverse modeling
approach to investigate the global atmospheric methane cycle, Global Biogeochem. Cycles, 11, 43–76, 1997.
IPCC, IPCC Third Assessment: Climate Change 2001, The Scientific Basis, Intergovernmental Panel of Climate Change (http://www.ipcc.ch/), 2001.
Kobayashi, H., Shimota, A., Kondo, K., Okumura, E., Kameda, Y., Shimoda, H., and Ogawa, T.: Development and evaluation of the Interferometric Monitor for Greenhouse Gases: a high through-put Fourier transform infrared radiometer for nadir Earth obser-vations, Appl. Opt., 38, 6801–6807, 1999.
Rinsland, C. P., Boughner, R. E., Larsen, J. C., Stokes, G. M., and Brault, J. W.: Diurnal variations of atmospheric nitric oxide: ground-based infrared spectroscopic measurements and their in-terpretation with time dependent photochemical model calcula-tions, J. Geophys. Res., 89, 9613–9622, 1984.
Rodgers, C. D.: Retrieval of Atmospheric Temperature and Compo-sition From Remote Measurements of Thermal Radiation, Rev. Geophys. Space Phys., 14, 609–624, 1976.
Rodgers, C. and Connor, B. J.: Intercomparison of remote sounding instruments, J. Geophys. Res., 108(D3), 4116, doi:10.1029/2002JD002299, 2003.
Rothmann, L. S., Barbe, A., Benner, D. C., Brown, L. R., Camy-Peyret, C., Carleer, M. R., Chance, K., Clerbaux, C., Dana, V., Devi, V. M., Fayt, A., Flaud, J. M., Gamache, R. R., Goldman, A., Jacquemart, D., Jucks, K. W., Lafferty, W. J., Mandin, J. Y., Massie, S. T., Nemtchinov, V., Newnham, D. A., Perrin, A., Rins-land, C. P., Schroeder, J., Smith, K. M., Smith, M. A. H., Tang, K., Toth, R. A., Vander Auwera, J., Varanasi, P., and Yoshino, K.: The HITRAN molecular spectroscopic database: edition of 2000 including updates through 2001, J. Quant. Spectrosc. Ra-diat. Transfer, 82, 5–44, 2003.
Sussmann, R. and Sch¨afer, K.: Infrared spectroscopy of tropo-spheric trace gases: combined analysis of horizontal and vertical column abundances, Appl. Opt., 36, 735–741, 1997.
Sussmann, R.: Ground-based Fourier transform spectrometry at the NDSC site Zugspitze: Geophysical products for satellite val-idation, in: Proceedings of the European Symposium on At-mospheric Measurements from Space, ESTEC, Noordwijk, The Netherlands, 18–22 Jan 1999, WPP-161, Vol. 2, 661–664, 1999. Sussmann, R. and Buchwitz, M.: Validation of EN-VISAT/SCIAMACHY columnar CO by FTIR profile retrievals at the Ground-Truthing Station Zugspitze, Atmos. Chem. Phys., 5, 1497–1503, 2005,
SRef-ID: 1680-7324/acp/2005-5-1497.
Washenfelder, R. A., Wennberg, P. O., and Toon, G. C.: Tro-pospheric methane retrieved from ground-based near-IR so-lar absorption spectra, Geophys. Res. Lett., 30(23), 2226, doi:10.1029/2003GL017969, 2003.
Zander, R., Demoulin, Ph., Ehhalt, D. H., and Schmidt, U.: Secular Increase of the Vertical Column Abundance of Methane Derived from IR Solar Spectra Recorded at the Jungfraujoch Station, J. Geophys. Res., 94, 11 029–11 039, 1989.