HAL Id: hal-00297789
https://hal.archives-ouvertes.fr/hal-00297789
Submitted on 25 Aug 2005HAL is a multi-disciplinary open access
archive for the deposit and dissemination of sci-entific research documents, whether they are pub-lished or not. The documents may come from teaching and research institutions in France or abroad, or from public or private research centers.
L’archive ouverte pluridisciplinaire HAL, est destinée au dépôt et à la diffusion de documents scientifiques de niveau recherche, publiés ou non, émanant des établissements d’enseignement et de recherche français ou étrangers, des laboratoires publics ou privés.
Profiles of C- and N-trace gas production in N-saturated
forest soils
K. Butterbach-Bahl, U. Berger, N. Brüggemann, J. Duyzer
To cite this version:
K. Butterbach-Bahl, U. Berger, N. Brüggemann, J. Duyzer. Profiles of C- and N-trace gas production in N-saturated forest soils. Biogeosciences Discussions, European Geosciences Union, 2005, 2 (4), pp.1127-1157. �hal-00297789�
BGD
2, 1127–1157, 2005
N- and C-trace gas production in forest soils K. Butterbach-Bahl et al. Title Page Abstract Introduction Conclusions References Tables Figures J I J I Back Close
Full Screen / Esc
Print Version Interactive Discussion EGU Biogeosciences Discussions, 2, 1127–1157, 2005 www.biogeosciences.net/bgd/2/1127/ SRef-ID: 1810-6285/bgd/2005-2-1127 European Geosciences Union
Biogeosciences Discussions
Biogeosciences Discussions is the access reviewed discussion forum of Biogeosciences
Profiles of C- and N-trace gas production
in N-saturated forest soils
K. Butterbach-Bahl1, U. Berger1, N. Br ¨uggemann1, and J. Duyzer2
1
Department of Biogeochemistry and Climate Change, Institute for Meteorology and Climate Research, Atmospheric Environmental Research (IMK-IFU), Kreuzeckbahnstraße 19, 82467 Garmisch-Partenkirchen, Germany
2
The Netherlands Organisation for Applied Research (TNO), Apeldoorn, The Netherlands Received: 11 July 2005 – Accepted: 21 August 2005 – Published: 25 August 2005 Correspondence to: K. Butterbach-Bahl ([email protected])
BGD
2, 1127–1157, 2005
N- and C-trace gas production in forest soils K. Butterbach-Bahl et al. Title Page Abstract Introduction Conclusions References Tables Figures J I J I Back Close
Full Screen / Esc
Print Version Interactive Discussion
EGU
Abstract
This study provides for the first time data on the stratification of NO and N2O production with soil depth under aerobic and anaerobic incubation conditions for different temper-ate forest sites in Germany (spruce, beech, clear-cut) and the Netherlands (Douglas fir). Results show that the NO and N2O production activity is highest in the forest floor
5
and decreases exponentially with increasing soil depth. Under anaerobic incubation conditions NO and N2O production was in all soil layers up to 2–3 orders of magnitude higher then under aerobic incubation conditions. Furthermore, significant differences between sites could be demonstrated with respect to the magnitude or predominance of NO and N2O production. These were driven by stand properties (beech or spruce)
10
or management (clear-cut versus control). With regard to CH4the most striking result was the lack of CH4 uptake activity in soil samples taken from the Dutch Douglas fir site at Speulderbos, which is most likely a consequence of chronically high rates of at-mospheric N deposition. In addition, we could also demonstrate that CH4fluxes at the soil surface are obviously the result of simultaneously occurring uptake and production
15
processes, since even under aerobic conditions a net production of CH4in forest floor samples was found. The provided dataset will be very useful for the development and testing of process oriented models, since for the first time activity data stratified for sev-eral soil layers for N2O, NO, and CH4 production/oxidation activity for forest soils are provided.
20
1. Introduction
Soils are of significant importance as sources or sinks of environmental important at-mospheric trace gases such as CH4, N2O and NO (e.g. IPCC, 1997; Davidson and Kingerlee, 1997; Smith et al., 2000). The exchange rates of these trace gases be-tween soils and the atmosphere are mainly driven by a few microbiological processes
25
mi-BGD
2, 1127–1157, 2005
N- and C-trace gas production in forest soils K. Butterbach-Bahl et al. Title Page Abstract Introduction Conclusions References Tables Figures J I J I Back Close
Full Screen / Esc
Print Version Interactive Discussion
EGU crobial processes responsible for production, but also consumption of these both trace
gases in soils (Conrad, 2002; Robertson and Tiedje, 1987), whereas methanogene-sis and CH4-oxidation are the two processes controlling CH4 soil-atmosphere fluxes (Conrad, 1996). The magnitude of N and C trace gas exchange and the direction of flux, i.e. deposition or emission, is strongly controlled by the aeration status of the
5
soil. Under anaerobic conditions soils can act e.g. as a source for atmospheric CH4, whereas under aerobic conditions most soils tend to be a sink for atmospheric CH4 (Butterbach-Bahl and Papen, 2002). Though the exchange of N2O and NO at the soil surface is also the result of simultaneously occurring production and consumption pro-cesses in the soils, soils have predominantly been found to be net emission sources
10
for N2O and NO (e.g. Bremner, 1997; Davidson and Kingerlee, 1997). Changes in the aeration status directly affect the contribution of nitrification and denitrification to the observed net-N trace gas emissions (Bollmann and Conrad, 1998). Under aerobic conditions nitrification may contribute significantly to N2O and especially NO produc-tion, whereas under prevailing anaerobic conditions denitrification is the main process
15
of N trace gas production (Bateman and Baggs, 2005). Several field and laboratory studies have shown that under non-substrate limiting conditions N trace gas produc-tion under anaerobic condiproduc-tions tend to be up to several orders of magnitude higher than under aerobic soil conditions (Bollmann and Conrad, 1998). However, there is still only limited information available to which extend the aeration status will change C and
20
N trace gas exchange under controlled environmental conditions. Furthermore, most of such studies have been performed for agricultural or grassland soils rather than for forest soils.
This study was intended to complement field measurements of N and C trace gas exchange at two different forest locations in the Netherlands and Germany, which were
25
carried out in the framework of the EU-funded NOFRETETE project. Both forest sites, i.e. H ¨oglwald in South Germany and Speulderbos in the Netherlands, are exposed to high loads of atmospheric N deposition (20–50 kg N ha−1yr−1) and have been shown previously to be strong emitters of NO (Gasche and Papen, 1999; van Dijk and Duyzer,
BGD
2, 1127–1157, 2005
N- and C-trace gas production in forest soils K. Butterbach-Bahl et al. Title Page Abstract Introduction Conclusions References Tables Figures J I J I Back Close
Full Screen / Esc
Print Version Interactive Discussion
EGU 1999) and, with regard to H ¨oglwald, also of N2O (Butterbach-Bahl et al., 2002a).
Fur-thermore, soils at H ¨oglwald were also found to be significant net sinks for atmospheric CH4 (Butterbach-Bahl and Papen, 2002). In the context of this study we aimed to characterize the vertical distribution of C and N trace gas production and consump-tion at both locaconsump-tions and to identify how atmospheric N deposiconsump-tion, forest type (beech,
5
spruce, Douglas fir) or forest management (clear-cutting) may have affected the net exchange of NO, N2O and CH4.
2. Materials and methods
2.1. Study sites
Stratification of N2O, NO and CH4-trace gas production and consumption in forest soils
10
was done for four different forest sites in Germany and the Netherlands. Three of the four sites were located at H ¨oglwald, Germany, where stands of mature beech and ma-ture spruce as well as a recently cleared spruce stand (clear cut in March 2000) were investigated. The latter site is in the following referred to as clearcut site. The area of H ¨oglwald is located in South Germany approx. 40 km west of the city of Munich
15
and is characterized by high atmospheric N deposition in the range of 15 (clear cut) to 30 kg N ha−1a−1 (Table 1). The fourth site was located at Speulderbos, Netherlands. The investigated Douglas fir plantation receives approx. twofold higher amounts of at-mospheric N deposition than compared to H ¨oglwald (Table 1). Further information on main climatic and soil characteristics is provided in Table 1.
20
2.2. Determination of rates of microbial NO, N2O and CH4production/consumption In order to determine changes in rates of microbial N and C trace gas production and consumption with soil depth, stratified soil samples were taken at all sites. The spruce and clearcut sites at H ¨oglwald were sampled in November 2000, April 2001, August
BGD
2, 1127–1157, 2005
N- and C-trace gas production in forest soils K. Butterbach-Bahl et al. Title Page Abstract Introduction Conclusions References Tables Figures J I J I Back Close
Full Screen / Esc
Print Version Interactive Discussion
EGU 2002 and January 2004. The Douglas fir site at Speulderbos and the beech site at
H ¨oglwald were sampled in October 2003 and January 2004, respectively. An overview about the stratification of soil sampling at the different sites is provided in Table 1. With the exception of the beech site at H ¨oglwald, where the forest floor is <0.02 m, the forest floor was subdivided into two sampling horizons (Table 1). All soil samples were
trans-5
ferred to the microbiological laboratory of IMK-IFU at Garmisch-Partenkirchen where analysis was started within a few days after sampling. Soil samples were pre-incubated at 10◦C two days prior of the experiments. All experiments were carried out at 10◦C. For all sampling dates soil moisture values were highest for forest floor samples (>100% w/w basis) and lower for soil samples taken from the mineral soil (in average 40–60%
10
w/w soil moisture for samples taken from 0–0.1 m soil depth and 15–30% w/w soil moisture for samples taken from 0.1–0.35 m soil depth).
Soil samples of a given horizon were further subdivided into 3 subsamples. For subsamples taken from the forest floor 20 g, for subsamples taken from the mineral soil horizon from 0–0.05 m soil depth 50 g and for all other soil depths 100 g of soil
15
were filled into 350 ml glass flasks. For aerobic incubations these flasks were closed with butyl rubber stoppers, and the change in concentrations of N2O, NO and CH4 in the headspace of the flasks was followed for the next 1–2 h in intervals of 15–20 min for NO, and 6–8 h in hourly intervals for N2O and CH4, respectively, by taking 3 ml air samples from the headspace of the flasks with gas tight syringes. Air samples
20
were immediately analysed for the respective concentrations of the investigated trace gases (see below). The same procedure was also followed for anaerobic incubations. However, for these experiments the headspace air was exchanged versus a pure N2 atmosphere immediately after closure of the flasks as described by Butterbach-Bahl et al. (1997) and Butterbach-Bahl and Papen (2002). Production or consumption rates
25
were calculated on a soil dry weight basis (SDW) from the linear increase of N and C trace gas concentrations with time (see Butterbach-Bahl and Papen, 2002).
Concentrations of CH4and N2O in air samples were determined by gas chromatog-raphy using either a flame ionization detector (FID) for the detection of CH4or a 63Ni
BGD
2, 1127–1157, 2005
N- and C-trace gas production in forest soils K. Butterbach-Bahl et al. Title Page Abstract Introduction Conclusions References Tables Figures J I J I Back Close
Full Screen / Esc
Print Version Interactive Discussion
EGU electron capture detector for the detection of N2O. Analytical conditions are described
in detail by Papen and Butterbach-Bahl (1999) and Butterbach-Bahl and Papen (2002). NO concentrations in air samples were detected by injecting 3 ml of gas sample in the sampling gas flow of a chemoluminescence detector (CLD 770 AL ppt, Ecophysics AG, D ¨urnten, Switzerland). As sampling gas NO-free synthetic air (Messer Griesheim,
5
Olching, Germany) at a flow rate of approx. 500 ml min−1 was used. All instruments were routinely calibrated either hourly (N2O and CH4) or every other day (NO) with calibration standards (Messer Griesheim, Olching, Germany).
2.3. Auxiliary measurements
The pH of soil samples was measured after addition of 50 ml of aqueous 0.1 M (?)
10
CaCl2 solution to 10 g soil and vigorous shaking for 15 min. NH4 and NO3 concen-trations in soil samples taken from the spruce and clearcut plots at H ¨oglwald were determined by extracting soil subsamples (5 g) with 50 ml 0.1 N KAl(SO4)2. The sus-pension was shaken for 20 min, and centrifuged for 15 min at 4◦C and 12 000 g (Beck-mann Instruments, M ¨unchen, Germany). The supernatant was filtered through 0.2 µm
15
membrane filters (Millipore, Frankfurt) and analyzed immediately for NH+4 and NO−3 by ion chromatography (DIONEX DX 500; anion-column: AS4A; cation column: CS12; DIONEX Company, Idstein, Germany). For the determination of microbial biomass C the fumigation extraction method as described by Vance et al. (1987) was used. All experiments were performed at least in triplicate.
20
2.4. Statistical analyses
All statistical analyses were performed with SPSS 8.0 (SPSS Inc., US) and Microcal Origin 6.1. Tests of significance of differences between specific rates of C and N trace gas production were performed by using the multiple range test (LSD) by ANOVA.
BGD
2, 1127–1157, 2005
N- and C-trace gas production in forest soils K. Butterbach-Bahl et al. Title Page Abstract Introduction Conclusions References Tables Figures J I J I Back Close
Full Screen / Esc
Print Version Interactive Discussion
EGU
3. Results
3.1. Vertical distribution of microbial biomass, soil pH and inorganic N
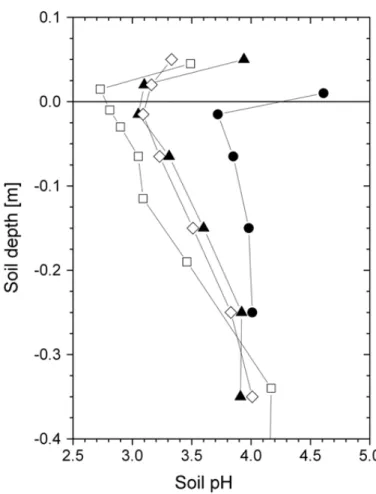
At all sites soil pH values were well below 5.0 and showed a typical check mark shape, with most acidic conditions in the uppermost mineral layer, and significantly or slightly higher pH values in the forest floor and in deeper soil layers of the mineral soil (Fig. 1).
5
Most acidic conditions were observed for the Speulderbos site, where for the upper-most mineral soil a pH of only 2.7 was found. On the other hand, at this site pH values increased most significantly with soil depth to values well above 4.1 at a soil depth of 0.35 m. For the H ¨oglwald sites, soil pH values were lowest for the spruce site and the recently clear-felled spruce site. Soil pH values of the beech site were for all soil layers
10
at least half a pH value higher than compared to respective soil layers of the spruce and clear-felled sites, respectively. Such pronounced differences in soil pH between spruce and beech stands at H ¨oglwald, which are mainly due to differences in cation cycling and atmospheric N input have already been reported previously (Rothe et al., 2002).
15
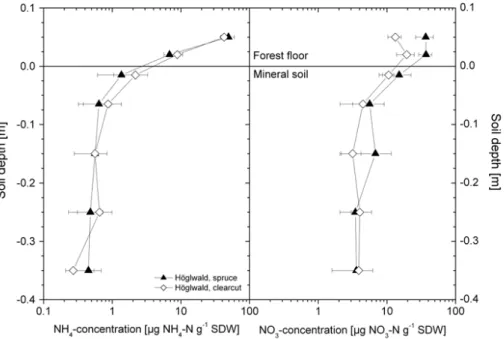
Ammonium and nitrate concentrations in different soil depths were only measured for the spruce and the clear-felled sites at H ¨oglwald. Figure 2 shows that in average over all sampling dates ammonium concentrations were highest in the forest floor with val-ues >7 µg N g−1 SDW and decreased exponentially to values <0.7 µg N g−1SDW with increasing soil depth. No significant differences were found in ammonium
concentra-20
tions between sites and a given soil layer. Also with regard to nitrate concentrations in soil samples, highest values were found in the forest floor (>10 µ g N g−1SDW). Some-what lower concentrations of nitrate were found in the mineral soil, but in contrast to ammonium concentrations the decrease in nitrate concentrations with soil depth was less pronounced (e.g. 30 cm soil depth: 4 µg nitrate N g−1SDW) (Fig. 2). Compared to
25
the spruce control site nitrate concentrations at the clear-felled site were significantly lower for forest floor samples (p<0.05). For all other soil layers no significant di ffer-ences were found
BGD
2, 1127–1157, 2005
N- and C-trace gas production in forest soils K. Butterbach-Bahl et al. Title Page Abstract Introduction Conclusions References Tables Figures J I J I Back Close
Full Screen / Esc
Print Version Interactive Discussion
EGU At all sites investigated the amount of microbial biomass C decreased exponentially
with soil depth from up to 10 mg C g−1 SDW in the forest floor to <0.02 mg C g−1 SDW in 0.3–0.4 m soil depth (Fig. 3). For all soil depths microbial biomass C values obtained for the beech site at H ¨oglwald were at least a factor of two higher than compared to the other sites (p<0.05). Microbial biomass was not significantly different between the
5
spruce and clear-felled sites at H ¨oglwald and the Douglas fire site at Speulderbos. However, of all sites investigated the Speulderbos site tended to show lowest values of microbial biomass C in the mineral soil (Fig. 3).
3.2. Vertical distribution of N2O and NO production in the soil profiles
At all sites N2O production was found to be highest in the forest floor (Fig. 4). Mean N2O
10
production in the forest floor of the H ¨oglwald beech site was 28.3±9.7 ng N2O-N g−1 SDW h−1, whereas N2O production in the forest floor of the other sites was significantly lower (H ¨oglwald, spruce: 0.6–3.3 ng N2O-N g−1 SDW h−1, H ¨oglwald, clearcut: 0.4– 0.8 ng N2O-N g−1 SDW h−1; Speulderbos, Douglas fir: 0.1–6.0 ng N2O-N g−1 SDW h−1). Except for the 0.25 m layer of the mineral soil at the H ¨oglwald beech site N2O
15
production in the mineral soil layers was mostly one magnitude lower than compared to the forest floor with values <0.2 ng N2O-N g−1 SDW h−1. This vertical stratification of N2O production was even more pronounced for the Douglas fir site at Speulderbos, where N2O production in the mineral soil was approx. three orders of magnitude lower than in the forest floor (Fig. 4). Mean specific N2O production, i.e. ng N2O-N production
20
per mg microbial biomass C, was highest for the H ¨oglwald beech site with a mean value of 3.5±2.9 ng N microbial biomass C h−1and lowest for the Speulderbos Douglas fir site (0.4±0.2 ng N microbial biomass C h−1). However, site differences were not significant on a p<0.05 level (Table 2).
Under anaerobic incubation conditions N2O production increased by at least 1–2
or-25
ders of magnitude than compared to aerobic incubation conditions. Also under anaer-obic incubation conditions highest N2O production was observed with values >100 ng
BGD
2, 1127–1157, 2005
N- and C-trace gas production in forest soils K. Butterbach-Bahl et al. Title Page Abstract Introduction Conclusions References Tables Figures J I J I Back Close
Full Screen / Esc
Print Version Interactive Discussion
EGU N2O-N g−1 SDW h−1 for soil samples taken from the forest floor (Fig. 5). In contrast
to results obtained for aerobic incubation conditions anaerobic N2O production in soil samples taken either from the forest floor or from the uppermost 0.2 m of the mineral soil of the H ¨oglwald spruce or H ¨oglwald clearcut site was significantly higher than com-pared to soil samples taken from the H ¨oglwald beech or Speulderbos Douglas fir site.
5
Except for the H ¨oglwald beech site specific N2O production under anaerobic incuba-tion condiincuba-tions at all other sites was approx. two orders of magnitude higher than under aerobic incubation conditions, whereas this difference was only a factor of two for the H ¨oglwald beech site (see Table 2).
The vertical stratification of NO production with soil depth was comparable to the
10
results obtained for N2O production, i.e. aerobic NO production was highest in the for-est floor and sharply decreased in soil samples taken from the mineral soil (Fig. 6). Compared to aerobic N2O production aerobic NO production in the forest floor was significantly higher and reached up to 371 ng NO-N g−1 SDW h−1 (H ¨oglwald spruce site). Specific NO production was with a value of 130.6±57.7 ng N microbial biomass
15
C h−1significantly higher at the H ¨oglwald spruce site than compared to the other sites (3.3–32.4 ng N microbial biomass C h−1) (Table 2). Except for the H ¨oglwald beech site specific NO production was at least one magnitude higher than specific N2O produc-tion, thus showing that NO is produced in larger quantities in the soil as N2O.
As was also found for N2O production anaerobic incubation of soil samples strongly
20
enhanced NO production (Fig. 7). Peak values of anaerobic NO production as e.g. ob-served for the H ¨oglwald spruce site were with 1494 ng NO-N g−1SDW h−1in the same range as anaerobic N2O production. Anaerobic NO production in the mineral soil was at least one magnitude lower in the mineral soil and decreased to values <40 ng NO-N g−1 SDW h−1 for all soil samples taken from soil layers deeper than 0.02 m. Specific
25
NO production under anaerobic incubation condition was significantly highest for the H ¨oglwald spruce site (848 ng N mg−1 microbial biomass C h−1) (Table 2), which is in accordance with the results for aerobic incubation conditions. Lowest specific NO pro-duction under anaerobic but also under aerobic incubation conditions were observed
BGD
2, 1127–1157, 2005
N- and C-trace gas production in forest soils K. Butterbach-Bahl et al. Title Page Abstract Introduction Conclusions References Tables Figures J I J I Back Close
Full Screen / Esc
Print Version Interactive Discussion
EGU for the H ¨oglwald beech site.
3.3. Vertical distribution of CH4production and consumption in the soil profiles Under aerobic incubation conditions the direction of CH4 flux, i.e. uptake or net-production, was found to depend on the soil depth from which samples were taken. In most cases soil samples taken from the forest floor, i.e. predominantly organic material,
5
showed a small net CH4 production (range: −0.015–0.546 ng CH4-C g−1 SDW h−1) (Fig. 8). In contrast, soil samples of the uppermost layers of the mineral soil were found to be a net sink for CH4at the H ¨oglwald sites. Figure 8 shows that CH4uptake at the H ¨oglwald beech site was with −0.62±0.01 ng CH4-C g−1SDW h−1at least 5 times higher than CH4 uptake rates in the mineral soil at the H ¨oglwald spruce and clearcut
10
sites, which are in direct vicinity of the H ¨oglwald beech site (100 m distance). At all sites at H ¨oglwald CH4uptake activity in the mineral soil decreased with increasing soil depth. However, under aerobic incubation conditions the soil was still a weak sink for CH4even at 0.35 m (Fig. 8). In contrast to the H ¨oglwald sites there was no significant net uptake of CH4 by the mineral soil of the Speulderbos Douglas fir site. If mineral
15
soil samples were derived from soil layers >0.1 m even a small net production of CH4 under aerobic incubation conditions could be observed. Therefore, the mean specific CH4 exchange rate at the Speulderbos site was positive (net production across the soil profile) with 0.02±0.06 ng C mg−1 microbial biomass C h−1, and not negative (net uptake across the soil profile) than for the H ¨oglwald sites (−1.56 to −0.46 ng C mg−1
20
microbial biomass C h−1) (Table 2).
Under anaerobic incubation conditions CH4 production in forest floor soil samples was found to be strongly enhanced (Fig. 9). CH4 production in the forest floor at the H ¨oglwald sites was in a range of 0.5–1.5 ng CH4-C g−1 SDW h−1, whereas CH4 pro-duction in the forest floor of the Speulderbos Douglas fir site was significantly lower
25
with values <0.1 ng CH4-C g−1 SDW h−1. CH4 production in mineral soil samples taken at soil depths <0.05 m were at least one order of magnitude lower than
com-BGD
2, 1127–1157, 2005
N- and C-trace gas production in forest soils K. Butterbach-Bahl et al. Title Page Abstract Introduction Conclusions References Tables Figures J I J I Back Close
Full Screen / Esc
Print Version Interactive Discussion
EGU pared to CH4production in the forest floor. As was found for CH4uptake under aerobic
incubation conditions, also under anaerobic incubation conditions and for CH4 produc-tion in 0.065 m and 0.15 m soil depth a significant difference could be found between the beech site on the one hand (0.01–0.2 ng CH4-C g−1 SDW h−1) and the spruce or clearcut sites on the other hand (0.03–0.08 ng CH4-C g−1 SDW h−1). Even though the
5
stratification of CH4production at the Speulderbos Douglas fir site was comparable to those found for the H ¨oglwald sites, CH4 production under anaerobic incubation con-ditions was in all soil layers approx. one order of magnitude lower than compared to the respective soil layers at the H ¨oglwald sites (Fig. 9). Site differences diminished for the Speulderbos Douglas fir site and H ¨oglwald beech site if mean specific rates of CH4
10
production are calculated. With 0.07 ng C mg−1 microbial biomass C h−1 (H ¨oglwald beech site) and 0.12 ng C mg−1 microbial biomass C h−1 (Speulderbos Douglas Fir site) these values were not significantly different, but significantly lower than the values for the H ¨oglwald spruce and clearcut sites (>0.69 ng C mg−1microbial biomass C h−1) (Table 2).
15
4. Discussion
The amount of microbial biomass found at the coniferous forest sites at Speulderbos or H ¨oglwald in the forest floor and first 0.05 m of the mineral soil are with 0.1–10 mg C g−1 SDW (approx. 1–16 g microbial C m−2) in a comparable range than observed also for other nitrogen deposition affected temperate coniferous forest ecosystems in
20
central Europe such as the Solling area (e.g. spruce: 4–5 g Microbial C m−2; Corr ´e and Lamersdorf, 2004). Throughout the profile higher values for microbial biomass were found for the beech site at H ¨oglwald, but such a difference between spruce (coniferous) and beech (deciduous) sites was also reported for the Solling (Corr ´e et al., 2003; Corr ´e and Lamersdorf, 2004) and for other sites in Austria (Zechmeister-Boltenstern et al.,
25
2002). Also observed ammonium and nitrate concentrations in soils at H ¨oglwald are within reported ranges (nitrate: 1–30 ng N g−1; Ammonium: 2–200 ng N g−1) (Priha et
BGD
2, 1127–1157, 2005
N- and C-trace gas production in forest soils K. Butterbach-Bahl et al. Title Page Abstract Introduction Conclusions References Tables Figures J I J I Back Close
Full Screen / Esc
Print Version Interactive Discussion
EGU al., 1999; Herman et al., 2002; Wang and Ineson, 2003; Aubert et al., 2005). However,
it is worthwhile to mention that soil nitrate concentrations at the clear-cut site were at least for the forest floor layers significantly lower than compared to the control site, and, thus, further support the explanation that mainly increased rates in soil water fluxes are responsible for observed increases in nitrate leaching (>30 kg N ha−1yr−1) after
clear-5
cutting (Weiss, Technical University of Munich, personnel communication).
At all sites N2O and NO production under aerobic and anaerobic incubation con-ditions was highest in the forest floor. Our laboratory results are in good agreement with results from field experiments at H ¨oglwald, where soil layers were subsequently removed and where also the forest floor was identified as the layer contributing most to
10
the actual N2O (70%) or NO (79%) emissions (Gasche and Papen, 1999; Papen and Butterbach-Bahl, 1999).
The magnitude of aerobic N2O production in the forest floors of our study sites (0.1– 28 ng N2O-N g−1SDW) were in most cases much higher as production rates of N2O un-der aerobic conditions in agricultural soils (Bollmann and Conrad, 1998, who reported
15
rates in a range of 0.05–0.2 ng N2O-N g−1 SDW). However, with regard to mineral soil samples differences in the aerobic N2O production between the investigated forest soils (range in this study: 0.001–0.2 ng N2O-N g−1 SDW) and agricultural (Bollmann and Conrad, 1998), or other meadow or forest soils (0.02–0.4 ng N2O-N g−1 SDW; G ¨odde and Conrad, 2000) diminish. The range of N2O production observed within
20
this study for forest floor samples is close to those observed by others in fertilized soil incubations (0.3–600 ng N2O-N g−1 SDW) (Parton et al., 1988; Bateman and Baggs, 2005; Kinney et al., 2005). The observed significantly lower N2O production poten-tial of the Speulderbos Douglas fir site than compared to the H ¨oglwald sites mirrors results from field measurements. Also here, Speulderbos showed low rates of N2O
25
emissions. This is remarkable, since one would assume that the observed high rates of N deposition (approx. 50 kg N ha−1yr−1) not only enhance NO emissions, as ob-served already earlier by Van Dijk and Duyzer (1999), but also N2O emissions. Since for this site nitrate concentrations in the soil solution are with 74–97 mg l−1 (Duyzer,
BGD
2, 1127–1157, 2005
N- and C-trace gas production in forest soils K. Butterbach-Bahl et al. Title Page Abstract Introduction Conclusions References Tables Figures J I J I Back Close
Full Screen / Esc
Print Version Interactive Discussion
EGU unpublished) even higher than for the H ¨oglwald spruce site (approx. 40 mg l−1, Rothe
et al., 2002), we only can speculate that the reason for low N2O emissions must be due to hydrological properties of the site. The Speulderbos forest site is a very well de-veloped Douglas fir stand with a very dense canopy (LAI>9), thus losing considerable amounts of precipitation by interception. Furthermore, a thick forest floor prevents or
5
limits the penetration of throughfall into the mineral soil. All these factors result in rela-tively low soil moisture conditions in the mineral soil, which means that N2O production by denitrification would not occur due to water limitations or, to be more precise, due to the sufficient aeration of the soil limiting denitrification (Conrad, 1996). This hypoth-esis is further supported by our finding that under anaerobic incubation conditions the
10
differences between the Speulderbos Douglas fir site and the H¨oglwald beech site dis-appears. Though, it still remains if compared to the spruce and clear-cut site. This shows that the Speulderbos site has a high potential for elevated N2O emissions if the environmental conditions and here especially the soil hydrology would change, e.g. due to selected cutting or clear-cutting. Our laboratory data also suggest that changes
15
in the hydrological conditions due to clear-cutting has not affected the anaerobic N2O production potential. Figure 5 shows that the stratification of anaerobic N2O produc-tion at the clear-cut site, on which previously spruce was grown, was down to 0.2 m soil depth not significantly different from the spruce site. Only for deeper soil layers anaer-obic N2O production was higher at the clear-cut site than compared to the spruce site.
20
This can be explained with higher values of nitrate leaching at the clear cut site, which supports higher denitrification activities also in deeper soil layers. Even though general soil properties and meteorological conditions are identical (Rothe et al., 2002) for the H ¨oglwald Forest sites, anaerobic N2O production as well as specific anaerobic N2O production remained significantly lower at the beech site than compared to the spruce
25
and clear-cut sites. This is remarkable, since soil moisture conditions especially in spring and winter time at the beech site are higher than compared to the spruce site (Butterbach-Bahl et al., 2002b). For that reason one would assume that the beech site supports a larger denitrifying population in the soil, which would finally support a
BGD
2, 1127–1157, 2005
N- and C-trace gas production in forest soils K. Butterbach-Bahl et al. Title Page Abstract Introduction Conclusions References Tables Figures J I J I Back Close
Full Screen / Esc
Print Version Interactive Discussion
EGU higher potential of N2O production under anaerobic conditions. First results on counts
of denitrifying bacteria in the soil of the beech and spruce sites would also support this hypothesis (Papen, personnel communication). But, obviously higher counts of den-itrifying bacteria and higher average soil moisture values for the beech site have not resulted in a higher anaerobic N2O production potential. The reason for that is most
5
likely associated to differences in average nitrate availability throughout the year, which is lower at the beech site than compared to the spruce site. Rothe et al. (2002) found for the H ¨oglwald Forest that nitrate leaching under beech is close to zero, but approx. 20 kg N ha−1 yr−1 at the spruce site. This difference is partly due to differences in the magnitude of atmospheric N deposition, which is approx. 10 kg higher at the spruce
10
site. But, the lower nitrate concentrations in the soil under beech are most likely also due to differences in nitrate uptake by roots of beech and spruce. Geßler et al. (1998) found for the H ¨oglwald beech and spruce sites, that beech roots do still show nitrate uptake activity under conditions of nitrogen saturation, whereas spruce roots did not show any nitrate uptake activity at all.
15
The observed increase of N2O production under anaerobic incubation conditions by two to three orders of magnitude than compared to aerobic incubation conditions is in agreement with the results on the oxygen dependency of N2O production in agricultural soils by Bollmann and Conrad (1998). However, their maximum N2O production under anaerobic conditions was around 100 ng N2O-N g−1 SDW, whereas in our study we
20
found values of up to 2000 ng N2O-N g−1 SDW in forest floor samples taken from the H ¨oglwald clear-cut site.
NO production activity in soils is mostly attributed to nitrification rather than to denitri-fication (Skiba et al., 1997; Conrad, 2002). Only if oxygen is depleted below values of 0.1–0.5% denitrification may become the dominating source for NO production in soils
25
(Bollmann and Conrad, 1998). For two agricultural soils in Germany Bollmann and Conrad (1998) reported rates of aerobic NO production in a range of 0.5–2 ng NO-N g−1SDW and for anaerobic incubation conditions rates of NO production of 100–200 ng NO-N g−1 SDW. Even in a study were soils were taken from recently fertilized
agricul-BGD
2, 1127–1157, 2005
N- and C-trace gas production in forest soils K. Butterbach-Bahl et al. Title Page Abstract Introduction Conclusions References Tables Figures J I J I Back Close
Full Screen / Esc
Print Version Interactive Discussion
EGU tural fields, NO production remained ≤20 ng NO-N g−1SDW (Tortoso and Hutchinson,
1990). Also in an other detailed study were the influence of soil properties on the turnover of nitric oxide was investigated (G ¨odde and Conrad, 2000) NO production in mineral soil samples taken either from agricultural, meadow or forest sites remained lower than 15 soils ng NO-N g−1. Compared to these values rates of NO production
un-5
der aerobic or anaerobic incubation conditions were much higher for soil samples taken from the forest floor (aerobic: 7–320 ng NO-N g−1 SDW; anaerobic: 100–1500 ng NO-N g−1 SDW), but in the same range for samples taken from the mineral soil (aerobic: 0.05–10 ng NO-N g−1 SDW; anaerobic: 1–130 ng NO-N g−1 SDW). This underlines that especially coniferous forest soils exposed to high loads of atmospheric N
depo-10
sition will act as strong sources of nitric oxide. At least for the H ¨oglwald sites it can be summarized that the high rates of NO production especially in the forest floor are matched by high nitrification activities (Gasche et al., 2002). The observed site dif-ferences in NO production activity, i.e. H ¨oglwald spruce>H ¨oglwald clear-cut>H ¨oglwald beech≈Speulderbos fire, is in agreement with results of field measurements (Gasche
15
and Papen, 1999; van Dijk and Duyzer, 1999; Gasche, unpublished) and demonstrate the usefulness of laboratory studies for evaluating site differences. The reason for such high NO production potentials and NO emissions especially from coniferous forest soils are most likely manifold: a) due to high rates of N deposition nitrogen is not limited, b) acidic soil reaction in the forest floor than compared to neutral pH values in agricultural
20
soils can support higher NO production rates (e.g. Yamulki et al., 1997; Ormecci et al., 1999; Kesik et al., 20051), c) the accumulation of “fresh” litter support high microbial C and N turnover rates, and d) modest soil moisture conditions in the forest floor support high nitrification activities and due to its favourable diffusivity also reduce the likeliness of NO consumption via denitrification and nitrification (Dunfield and Knowles, 1997).
25
Our incubation studies on CH4 dynamics revealed principal differences in CH4 up-1Kesik, M., Blagodatsky, S., Papen, H., and Butterbach-Bahl, K.: Effect of pH, temperature and substrate on N2O, NO, and CO2 production by Alcaligenes faecalis, J. Appl. Microbiol., submitted, 2005.
BGD
2, 1127–1157, 2005
N- and C-trace gas production in forest soils K. Butterbach-Bahl et al. Title Page Abstract Introduction Conclusions References Tables Figures J I J I Back Close
Full Screen / Esc
Print Version Interactive Discussion
EGU take and production between the H ¨oglwald sites and the Speulderbos Douglas fir site.
For the latter site CH4 fluxes were insignificant under aerobic incubation conditions, whereas under such incubation conditions samples from the forest floor were signifi-cant net CH4producers in contrast to mineral soil samples which showed a significant net CH4 uptake. The high potential of the forest floor to act as a net CH4-production
5
source even under well aerated conditions has also been described previously for some other temperate forest sites (Saari et al., 1997; Yavitt et al., 1990) and is due to the high mineralisation activity in the forest floor obviously creating strictly anaerobic microsites in which CH4production can occur. At all H ¨oglwald Forest sites, i.e. beech, spruce, and clear-cut, highest CH4-oxidation activity was found in 0–0.15 m soil depth, where CH4
-10
oxidation rates of up to -0.6 ng CH4g−1SDW h−1(beech), −0.13 ng CH4g−1SDW h−1 (spruce) and −0.06 ng CH4 g−1 SDW h−1 (clear-cut) were observed. The magnitude of CH4-oxidation activity found for the H ¨oglwald sites are in excellent agreement with values reported in the literature for the 0–0.05 m mineral soil layer of a spruce forest site in the Netherlands (−0.44 ng CH4-C g−1 SDW h−1, Saari et al., 1997) which is
15
also – like H ¨oglwald – exposed to high loads of atmospheric N-deposition or with pre-vious results for the beech and spruce sites of H ¨oglwald (Butterbach-Bahl and Papen, 2002). However, compared to rates of CH4-oxidation with low atmospheric N-input in Finland (−1.43 ng CH4g−1SDW h−1, Saari et al., 1997) or the Black Forest region in Germany (Steinkamp et al., 2001), the CH4-oxidation activity in our soil samples was
20
approx. 2–3 times lower. This finding, as well as the absence of CH4 uptake activity at the Speulderbos site strongly support the hypothesis that chronic atmospheric N-deposition will strongly decrease the CH4-oxidation capacity of temperate forest soils (e.g. Butterbach-Bahl et al., 1998; Sitaula et al., 1995; Steudler et al., 1989) due to the inhibitory effect which elevated ammonium concentrations can exert on CH4oxidation
25
(for a detailed discussion also of possible stimulating effects of moderate doses of N additions on CH4 uptake see Bodelier and Laanbroek, 2004). Furthermore, our data also show that forest management measures such as clear-cutting can significantly re-duce CH4uptake activities throughout the soil profile. This finding is in agreement with
BGD
2, 1127–1157, 2005
N- and C-trace gas production in forest soils K. Butterbach-Bahl et al. Title Page Abstract Introduction Conclusions References Tables Figures J I J I Back Close
Full Screen / Esc
Print Version Interactive Discussion
EGU results from field measurements at the H ¨oglwald sites (Butterbach-Bahl et al.,
unpub-lished) and with results on effects of land use changes on CH4oxidation (Priem ´e et al., 1997).
5. Conclusions
This study provides for the first time data on the stratification of NO and N2O production
5
with soil depth under aerobic and anaerobic incubation conditions for different temper-ate forest sites in Germany and the Netherlands. Such data are urgently needed as guidelines for the development and testing of process-oriented models, which are able to describe the biosphere atmosphere exchange of C and N trace gases on the basis of the underlying soil microbial processes. Furthermore, our results showed that
labo-10
ratory studies are very useful to detect site differences in magnitude and predominance of NO or N2O emissions, respectively. Our observation that CH4 uptake activity was not detectable at the Speulderbos site throughout the soil profile, most likely in con-sequence of chronically high rates of atmospheric N deposition, is very remarkable. It indicates that measurements of CH4uptake activities in the uppermost mineral soil
un-15
der standardized incubation conditions may have the potential to serve as a biological indicator system for N saturation.
Acknowledgements. The NOFRETETE project was funded by the EU commission under
con-tract number EVK2-CT2001-00106.
References
20
Aubert, M., Bureau, F., and Vinceslas-Akpa, M.: Sources of spatial and temporal variability of inorganic nitrogen in pure and mixed deciduous temperate forests, Soil Biol. Biochem., 37, 67–79, 2005.
BGD
2, 1127–1157, 2005
N- and C-trace gas production in forest soils K. Butterbach-Bahl et al. Title Page Abstract Introduction Conclusions References Tables Figures J I J I Back Close
Full Screen / Esc
Print Version Interactive Discussion
EGU Bateman, E.J., and Baggs, E.M.: Contribution of nitrification and denitrification to N2O
emis-sions from soils at different water-filled pore space, Biol. Fertil. Soils, doi:10.1007/s00374-005-0858-3, 2005.
Bodelier, P. L. E. and Laanbroek, H. J.: Nitrogen as a regulatory factor of methane oxidation in soils and sediments, FEMS Microbiol. Ecol., 47, 265–277, 2004.
5
Bollmann, A. and Conrad, R.: Influence of O2availability on NO and N2O release by nitrification and denitrification in soils, Global Change Biol., 4, 387–396, 1998.
Bremner, J. M.: Sources of nitrous oxide in soils, Nutr. Cycl. Agroecosys. 49, 7–16, 1997. Butterbach-Bahl, K., Papen, H., and Rennenberg, H.: Impact of gas transport through rice
cultivars on methane emission from rice paddy fields, Plant, Cell and Environment, 20, 1175–
10
1183, 1997.
Butterbach-Bahl, K. and Papen, H.: Four years continuous record of CH4-exchange between the atmosphere and untreated and limed soil of a N-saturated spruce and beech forest ecosystem in Germany, Plant and Soil, 240, 77–90, 2002.
Butterbach-Bahl, K., Willibald, G., Papen, H., and Gasche, R.: Exchange of N-gases at the
15
spruce and beech sites at the H ¨oglwald Forest – A summary, Plant and Soil, 240, 117–123, 2002a.
Butterbach-Bahl, K., Rothe, A., and Papen, H.: Effect of tree distance on N2O- and CH4-fluxes from soils in temperate forest ecosystems, Plant Soil, 240, 91–103, 2002b.
Conrad, R.: Soil microorganisms as controllers of atmospheric trace gases (H2, CO, CH4, OCS,
20
N2O and NO), Microbiol. Rev., 60, 609–640, 1996.
Conrad, R.: Microbiological and biochemical background of production and consumption of NO and N2O in soil, in: Trace Gas Exchange in Forest Ecosystems, edited by: Gasche, R., Papen, H., and Rennenberg, H., Kluwer Academic Publishers, Dordrecht, Boston, London, 3–33, 2002.
25
Davidson, E. A. and W. Kingerlee: A global inventory of nitric oxide emissions from soils, Nutr. Cycl. Agroecosyst., 48, 37–50, 1997.
Dunfield, P. F. and Knowles, R.: Biological oxidation of nitric oxide in a humisol, Biol. Fert. Soils, 24, 294–300, 1997.
Gasche, R. and Papen, H.: A 3-year continuous record of nitrogen trace gas fluxes from
un-30
treated and limed soil of a N-saturated spruce and beech forest ecosystem in Germany 2. NO and NO2fluxes, J. Geophys. Res., 104, 18 505–18 520, 1999.
BGD
2, 1127–1157, 2005
N- and C-trace gas production in forest soils K. Butterbach-Bahl et al. Title Page Abstract Introduction Conclusions References Tables Figures J I J I Back Close
Full Screen / Esc
Print Version Interactive Discussion
EGU determination of net nitrification rates, Plant Soil, 240, 57–65, 2002.
Geßler, A., Schneider, S., Von Sengbusch, D., Weber, P., Hanemann, U., Huber, C., Rothe, A., Kreutzer, K., and Rennenberg, H.: Field and laboratory experiments on net uptake of nitrate and ammonium by the roots of spruce (Picea abies) and beech (Fagus sylvatica) trees, New Phytol., 138, 175–285, 1998.
5
G ¨odde, M. and Conrad, R.: Influence of soil properties on the turnover of nitric oxide and nitrous oxide by nitrification and denitrification at constant temperature and moisture, Biol. Fertil. Soils, 32, 120–128, 2000.
Herman, F., Smidt, S., Englisch, M., Feichtinger, F., Gerzabek, M., Haberhauer, G., Jandl, R., Kalina, M., and Zechmeister-Boltenstern, S.: Investigations of nitrogen fluxes and pools on
10
a limestone site in the Alps, Environ. Sci. Pollut. Res., Special Issue 2, 46–52, 2002.
IPCC: Intergovernmental Panel on Climate Change guidelines for national greenhouse gas inventories, Chapter 4: Agriculture: Nitrous oxide from agricultural soils and manure man-agement, OCDE, Paris, 1997.
Kinney, C. A., Mandernack, K. V., and Mosier, A. R.: Laboratory investigations into the effects
15
of the pesticides manoceb, chlorothalonil, and prosulforon on nitrous oxide and nitric oxide production in fertilized soils, Soil Biol. Biochem., 37, 837–850, 2005.
Ormecci, B., Sanin, S. L., and Peirce, J. J.: Laboratory studies of NO flux from agricultural soil: Effects of soil moisture, pH, and temperature, J. Geophys. Res., 104, 1621–1629, 1999. Papen, H., and Butterbach-Bahl, K.: A 3-year continuous record of nitrogen trace gas fluxes
20
from untreated and limed soil of a N-saturated spruce and beech forest ecosystem in Ger-many, 1. N2O emissions, J. Geophys. Res., 104, 18 487–18 503, 1999.
Parton, W. J., Mosier, A. R., and Schimel, D. S.: Rates and pathways of nitrous oxide production in a shortgrass steppe, Biogeochem., 6, 45–48, 1988.
Priem ´e, A. Christensen, S., Dobbie, K. E., and Smith, K. A.: Slow increase in rates of methane
25
oxidation in soils with time following land use change from arable agriculture to woodland soil, Biol. Biochem., 29, 1269–1273, 1997.
Priha, O., Grayston, S. J., Pennanen, T., and Smolander, A.: Microbial activities related to C and N cycling and microbial community structure in the rhizospheres of Pinus sylvestris,
Picea abies and Betula pendula seedlings in an organic and mineral soil, FEMS Microbiol.
30
Ecol., 30, 187–199, 1999.
Robertson, G. P. and Tiedje, J. M.: Nitrous oxide sources in aerobic soils: nitrification, denitrifi-cation and other biological processes, Soil Biol. Biochem., 19, 187–193, 1987.
BGD
2, 1127–1157, 2005
N- and C-trace gas production in forest soils K. Butterbach-Bahl et al. Title Page Abstract Introduction Conclusions References Tables Figures J I J I Back Close
Full Screen / Esc
Print Version Interactive Discussion
EGU Rothe, A., Kreutzer, K., and K ¨uchenhoff, H.: Influence of tree species composition on soil
and soil solution properties in two mixed spruce-beech stands with contrasting history in Southern Germany, Plant and Soil, 240, 47–56, 2002.
Skiba, U., Fowler, D., and Smith, K. A.: Nitric oxide emissions from agricultural soils in temper-ate and tropical climtemper-ates: source, controls and mitigation options, Nutr. Cycl. Agroecosys.,
5
48, 139–153, 1997.
Smith, K. A., Dobbie, K. E., Ball, B. C., Bakken, L. R., Sitaula, B. K., Hansen, S., Brumme, R., Borken, W., Christensen, S., Priem ´e, A., Fowler, D., MacDonald, A., Skiba, U., Klemedts-son, L., Kasimir-KlemedtsKlemedts-son, A., Derorska, A., and Orlanski, P.: Oxidation of atmospheric methane in Northern European soils, comparison with other ecosystems, and uncertainties
10
in the global terrestrial sink, Global Change Biol., 6, 791–803, 2000.
Tortoso, A. C. and Hutchinson, G. L.: Contributions of autotrophic and heterotrophic nitrifiers to soil NO and N2O emissions, Appl. Environm. Microbiol., 56, 1799–1805, 1990.
Van Dijk, S. M. and Duyzer, J. H.: Nitric oxide emissions from forest soils, J. Geophys. Res., 104, 15 955–15 961, 1999.
15
Vance, E. D., Brookes, P. C., and Jenkinson, D. S.:. An extraction method for measuring soil microbial biomass C, Soil Biol. Biochem., 19, 703–707, 1986.
Wang, Z. P. and Ineson, P.: Methane oxidation in a temperate coniferous forest soil: effects of inorganic N, Soil Biol. Biochem, 35, 427–433, 2003.
Yamulki, S., Harrison, R. M., Goulding, K. W. T., and Webster, C. P.: N2O, NO and NO2fluxes
20
from a grassland: effect of soil pH, Soil Biol. Biochem., 29, 1199–1208, 1997.
Zechmeister-Boltenstern, S., Hahn, M., Meger, S., and Jandl, R.: N2O emission and nitrate leaching in relation to microbial dynamics in a beech forest soil, Soil Biol. Biochem., 116, 823–832, 2002.
BGD
2, 1127–1157, 2005
N- and C-trace gas production in forest soils K. Butterbach-Bahl et al. Title Page Abstract Introduction Conclusions References Tables Figures J I J I Back Close
Full Screen / Esc
Print Version Interactive Discussion
EGU
Table 1. Main characteristics of the different measuring sites and dates and stratification of soil
sampling.
H ¨oglwald-Forest Speulderbos Beech Spruce Clearcut Douglas fir Location 11◦10’E 5◦41’E
48◦30’N 52◦15’N Height above sea level (m) 540 50 Precipitation (mm yr−1)a 812b 768c Mean annual temperature (◦C)a 9.1b 10.4c N-deposition via throughfall
(kg N ha−1yr−1) ∼20 ∼30 ∼15 ∼50 Stand type Beech Spruce Beech Douglas fir Stand age (yr) 110 100 3
Soil type Hapludalf Hapludalf Hapludalf Hapludalf Soil texture Loam Loam Loam Loamy sand Sand (%) 65 64 64 62.8 Silt (%) 26 30 30 34.2 Clay (%) 9 6 6 3.0 Bulk density 0–5 cm (g cm−3) 0.94 1.09 1.09 0.98 C/N ratio 21.8 24.0 24.0 22.6 Organic C content (%) 5.1 2.9 2.9 3.05 Sampling dates 01/2004 11/2000, 11/2000, 10/2003 04/2001, 04/2001, 08/2002, 08/2002, 01/2004 01/2004 Sampling depths (m) Forest floor 0.00–0.02 0.00–0.03 0.00–0.03 0.00–0.03 0.03–0.05 0.03–0.05 0.00–0.03 Mineral soil 0.00–0.03 0.00–0.03 0.00–0.03 0.02–0.04 0.03–0.10 0.03–0.10 0.03–0.10 0.04–0.09 0.10–0.20 0.10–0.20 0.10–0.20 0.09–0.14 0.20–0.30 0.20–0.30 0.20–0.30 0.14–0.24 0.30–0.40 0.30–0.40 0.24–0.44 0.44–0.64 0.64–1.04
All soil parameters are given for 0-10 cm soil depth.
aAverage values for the years 2002 and 2003. b
Given are meteorological data of the climate station Lelystad, Netherlands, which is approx. 10 km from Speulderbos. Data were provided by the Koninklijk Nederlands Meteorologisch Instituut, de Bilt, Netherlands.
c
Given are meteorological data of the climate station Augsburg, which is approx. 20 km from H ¨oglwald. Data were provided by the Deutscher Wetterdienst (DWD).
BGD
2, 1127–1157, 2005
N- and C-trace gas production in forest soils K. Butterbach-Bahl et al. Title Page Abstract Introduction Conclusions References Tables Figures J I J I Back Close
Full Screen / Esc
Print Version Interactive Discussion
EGU
Table 2. Specific rates of trace gas production across the soil profiles for the different sites
(±SE). Mean trace gas production rates were divided by values for microbial biomass C. Differ-ent lower case letters indicate significant differences (P <0.05) between sites for a given trace gas and a given incubation condition. Different capital letters indicate significant differences (P <0.05) between N trace gas production for a given site (e.g. H ¨oglwald beech site) and given incubation conditions. Different numbers indicate significant differences in N-trace gas produc-tion (P <0.05) between aerobic and anaerobic incubaproduc-tion condiproduc-tions for a given N trace gas and a given site.
Trace Gas H ¨oglwald-Forest Speulderbos
Beech Spruce Clearcut Douglas fir
ng N or C mg−1microbial biomass C h−1 N2O
Aerobic 3.51±2.93aA1 1.70±0.53aA1 0.91±0.24aA1 0.39±0.20aA1 Anaerobic 6.13±2.27aA1 693.9±274.5bB2 434.1±162.5bcAB2 169.4±49.3bcB2 NO
Aerobic 3.31±0.56aA1 130.6±57.7bB1 31.1±6.9aB1 32.4±16.8aA1 Anaerobic 24.8±6.0aA2 845.8±221.7bB2 319.0±47.5aAB2 254.0±87.0aB2 CH4
Aerobic −0.46±0.34ab1 −1.56±0.88b1 −0.50±0.19ab1 0.02±0.06a1 Anaerobic 0.07±0.03a2 1.14±0.31b2 0.69±0.16b2 0.12±0.06a1
BGD
2, 1127–1157, 2005
N- and C-trace gas production in forest soils K. Butterbach-Bahl et al. Title Page Abstract Introduction Conclusions References Tables Figures J I J I Back Close
Full Screen / Esc
Print Version Interactive Discussion
EGU
Figures
Fig. 1. Vertical distribution of soil ph values at the different sampling sites.
BGD
2, 1127–1157, 2005
N- and C-trace gas production in forest soils K. Butterbach-Bahl et al. Title Page Abstract Introduction Conclusions References Tables Figures J I J I Back Close
Full Screen / Esc
Print Version Interactive Discussion
EGU
Fig. 2. Soil NO3- and NH4+ concentrations in different soil depths for the spruce and clearcut
sites at the Höglwald Forest.
Fig. 2. Soil NO−3 and NH+4 concentrations in different soil depths for the spruce and clearcut sites at the H ¨oglwald Forest.
BGD
2, 1127–1157, 2005
N- and C-trace gas production in forest soils K. Butterbach-Bahl et al. Title Page Abstract Introduction Conclusions References Tables Figures J I J I Back Close
Full Screen / Esc
Print Version Interactive Discussion
EGU
Fig. 3. Amount of microbial biomass in different soil depths at the investigated sites.
BGD
2, 1127–1157, 2005
N- and C-trace gas production in forest soils K. Butterbach-Bahl et al. Title Page Abstract Introduction Conclusions References Tables Figures J I J I Back Close
Full Screen / Esc
Print Version Interactive Discussion
EGU
Fig. 4. N2O production in different soil depths and at different sites under aerobic incubation
conditions. Given are mean values ± SE.
Fig. 4. N2O production in different soil depths and at different sites under aerobic incubation
BGD
2, 1127–1157, 2005
N- and C-trace gas production in forest soils K. Butterbach-Bahl et al. Title Page Abstract Introduction Conclusions References Tables Figures J I J I Back Close
Full Screen / Esc
Print Version Interactive Discussion
EGU
Fig.5. N2O production in different soil depths and at different sites under anaerobic incubation conditions. Given are mean values ± SE.
Fig. 5. N2O production in different soil depths and at different sites under anaerobic incubation
BGD
2, 1127–1157, 2005
N- and C-trace gas production in forest soils K. Butterbach-Bahl et al. Title Page Abstract Introduction Conclusions References Tables Figures J I J I Back Close
Full Screen / Esc
Print Version Interactive Discussion
EGU
Fig. 6. NO production in different soil depths and at different sites under aerobic incubation
conditions. Given are mean values ± SE.
Fig. 6. NO production in different soil depths and at different sites under aerobic incubation
BGD
2, 1127–1157, 2005
N- and C-trace gas production in forest soils K. Butterbach-Bahl et al. Title Page Abstract Introduction Conclusions References Tables Figures J I J I Back Close
Full Screen / Esc
Print Version Interactive Discussion
EGU
Fig. 7. NO production in different soil depths and at different sites under anaerobic incubation
conditions. Given are mean values ± SE.
Fig. 7. NO production in different soil depths and at different sites under anaerobic incubation
BGD
2, 1127–1157, 2005
N- and C-trace gas production in forest soils K. Butterbach-Bahl et al. Title Page Abstract Introduction Conclusions References Tables Figures J I J I Back Close
Full Screen / Esc
Print Version Interactive Discussion
EGU
Fig. 8. CH4 production or consumption in different soil depths and at different sites under
aerobic incubation conditions. Given are mean values ± SE.
Fig. 8. CH4 production or consumption in different soil depths and at different sites under
BGD
2, 1127–1157, 2005
N- and C-trace gas production in forest soils K. Butterbach-Bahl et al. Title Page Abstract Introduction Conclusions References Tables Figures J I J I Back Close
Full Screen / Esc
Print Version Interactive Discussion
EGU
Fig. 9. CH4 production in different soil depths and at different sites under anaerobic incubation conditions. Given are mean values ± SE.
Fig. 9. CH4production in different soil depths and at different sites under anaerobic incubation