HAL Id: hal-00408547
https://hal.archives-ouvertes.fr/hal-00408547
Submitted on 18 Mar 2021
HAL is a multi-disciplinary open access
archive for the deposit and dissemination of
sci-entific research documents, whether they are
pub-lished or not. The documents may come from
teaching and research institutions in France or
abroad, or from public or private research centers.
L’archive ouverte pluridisciplinaire HAL, est
destinée au dépôt et à la diffusion de documents
scientifiques de niveau recherche, publiés ou non,
émanant des établissements d’enseignement et de
recherche français ou étrangers, des laboratoires
publics ou privés.
Electromagnetic fluctuations in the vicinity of the
magnetopause
L. Rezeau, S. Perraut, A. Roux
To cite this version:
L. Rezeau, S. Perraut, A. Roux.
Electromagnetic fluctuations in the vicinity of the
magne-topause.
Geophysical Research Letters, American Geophysical Union, 1986, 13, pp.1093-1096.
�10.1029/GL013I011P01093�. �hal-00408547�
ELECTROMAGNETIC FLUCTUATIONS IN THE VICINITY OF THE MAGNETOPAUSE
L. Rezeau, S. Pertaut, and A,. Roux
Centre de Recherches en Physique de l'Environnement, CNET 92131 Issy-les-Moulineaux, France
Abstract. A detailed analysis of electromagnetic 197& We first compute the integrated power of
fluctuations recorded during several magnetopause the fluctuations from 0.`5 to 10 Hz, and then fit
and boundary
layer crossings
by the ESA GEOS-2 power
spectra
with i -c• spectral
laws.
geostationary spacecraft is presented. A high levelof electromagnetic
(3E/ 3B ~ V A) fluctuations
in
GEOS
Observations
the ULF (0 - 10 Hz) range is 6bserved for each
such crossing. The obtained œrequency spectra are The three-component search coil magnetometer
shown
to fit with a power
law B2~ f-c• . The distribu- onboard
the GEOS
2 geostationary
satellite covers
tion of these c• indexes is found to be narrow (stan- a frequency range up to 11.`5 Hz, in wave form. dard deviation • 0.2`5 for 0.`5 _z. f _z. I I Hz), with The BZ component is aligned with the spin axis
a peak value c• ~ 2..5 which does not depend on and hence does not suffer from any effect induced the direction with respect to the magnetic field. by the spacecraft rotation. Rejection of spurious Data suggest that the magnetopause boundary layer signals at the spin frequency on orthogonal compo- is the source of these intense fluctuations. nents is achieved onboard by a filter working at
the spin frequency (T .• 6 s). Data processing is
Introduction
described
by Kodera
•t al. (1977) and Robert et
al (1979). The GEOS 2 magnetic antennas are ratherIt has
been
shown
that a boundary
layer
of dense sensitive
in a broad
frequency_
range•_,r)•amely
10
-2
plasma
exists all over the magnetopause
on the
nT.Hz
-]72 at 0.`5 Hz and 10
-3 nT.Hz tlZ at 3 Hz.
earthward side (Eastman and Hones, 1979; Pasch- This wave experiment in the Ultra Low Frequen- mann et al, 1979). Since this layer is populated cy range has been continuously operating. During by magnetosheath particles, together with a typical periods of large magnetic activity, GEOS 2 has
magnetospheric plasma, and since it always exists, experienced multiple magnetopause crossings in there must be some ways by which the magneto- the morning and dayside sectors. Very strong fluctua- sheath particles can penetrate through the magneto- tions covering the whole œrequency range have pause, whatever the solar wind conditions. Tsurutani been detected at the magnetopause crossings and
and Thorne (1982) have investigated the cross-field in their vicinity (Pertaut et al, 1979). The present
diffusion of magnetosheath ions as a possible way study has been carried out from data of August to explain the existence of the magnetopause bound- 28, 1978 (from `500 to 1000 UT) and September ary layer. While concluding that diffusion by resonant 29, 1978 (from 600 to 1100 UT). During these days,
fluctuations is a likely cause, they were not able the magnetopause and its boundary layer were to identify the relevant turbulence. Gendrin (1983) crossed 19 times.
challenged their conclusion that electrostatic waves
should be operative and showed that the magnetic Integrated Power of the Fluctuations fluctuations reported by Pertaut et al (1979) have
a sufficient level for insuring the required rate Figure I shows a one-hour period selected among of cross-field diffusion. We further investigate this the various magnetopause crossings. The integrated process by using electric field and magnetic field power of the magnetic components is plotted with
data collected on GEOS 2, during several magneto- a time resolution of 22 s and between 0.`5 and pause crossings. This allows to characterize the 10 Hz (the lower limit is about three times the
statistical properties of the spectra of observed spin frequency to avoid any remaining spurious magnetic fluctuations. Indeed, in view of the large effect due to the spacecraft rotation) and it is
level of the fluctuations
and of their random
nature,
shown together with the VDH components
of the
it seems convenient
to use methods
similar to those
DC magnetic field. The magnetopause
is determined
developed for studying fluid turbulence and to compa- from the BH turnover and the boundary layer fromre to power
laws. The well known
k-`5/3
law for
the spacecraœt
potential
(Knott et al, 1983).
It
hydrodynamic turbulence has been established by is clear that the integrated magnetic power is
Kolmogorov (19#1); later Kraichnan (196`5) showed the most intense at the magnetopause crossings
that a k -3/2 law holds
in the case
of incompressible (up to 100 nT2), when
the DC magnetic
field de-
magnetohydrodynamics. These spectral laws are based upon dimensional analysis for which the assumptions of isotropy and homogeneity are manda- tory. It is interesting to compare these laws with experimental data (Montgomery, 198`5). We have made a systematic study of ULF fluctuations during several single or multiple magnetopause crossings which occurred on August 28 and September 29,
creases down to 60 nT, which corresponds to 3 B / B .• 1`5%. In the boundary layer, the power is similar to that observed in the magnetopause (1-100 nT•). In the magnetosheath, the level is lower (1-10 •nT •) and still much lower in the magneto-
sphere (10
-2 - 10
-1 n T•). The observed
large de-
crease in the level of the fluctuations as the space- craft moves away from the magnetopause and its boundary layer suggests the existence of aCopyright 1986 by the American Geophysical Union. source in the magnetopause and boundary layer.
This cannot, however, be directly tested since Paper number 6L6289. we have no way of measuring the distance between 009#-8276/86/006L-6289503.00 the spacecraft and the magnetopause.
1094 Rezeau: Electromagnetic Fluctuations Near the Magnetopause
fiEOS- 2 AUG.28,1978 05.00UT
12o.[;.
'+A F',•
\' •.•'•
ß , •, /•,../ •,,,,,
(Figure t4). The error on c• is deduced from z• by 6a- z• /(log f • max - log f . ). This has been m!
done in two irequency
ranges:
•rom 0.5 Hz to
3 Hz and from 0.5 Hz to 11 Hz. We have studied
29 spectra on August 28, 1978, and 15 on Septem- ber 29, 1978, in two coordinate systems. In the
first case, BZ is aligned with the DC magnetic
field, BL and BR are the left and right-hand compo-
ß
-
•
nents
projected
in
the
plane
perpendicular
to
it;
ram-2ø
the other
coordinate
system
is the standard
VDH
o -40 V \•
t•-60. Btot
"[
...
":"\'!;:
i
coordinate
system.
The
reason
for
displaying
the
BV
t•
•'l
I '21
I / 1•
•i
-80. BD
[ [,
data
in various
coordinate
systems
was
to find
-100 ...
BH
..
...
•'"•'
....
"'""
-•20
0.
., ...
10 .... 2•) ... 3'0,.,'"'
40 50!: whether
60 magnetic field fluctuations. Two spectra are plottedthere
is any
preferred
direction
for the
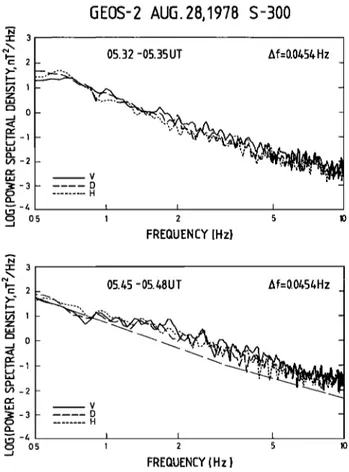
TIME (rain) in Figure 3, the time intervals when they were
2.
o
o
Q_ -2
taken are indicated in Figure 1. During the first one, GEOS 2 was in the magnetosheath, while during the second one, it crossed the magnetopause
twice.
As can be seen for instance in Figure 3, the power law found from the least squares method happens to depend upon the region where the spectra were made, then we have split them into three classes, namely (i) magnetopause or boundary layer
(19 cases), (ii) magnetosheath (14 cases), and (iii)
magnetosphere (11 cases). The level of turbulence is so high during the boundary crossings that it
... • ...
is dominant even if they last less than the three
0 '2• '• 'i0 's'0 •0
TIME(rain) minutes sampled. In each region, we studied the
•:?:::::::::::::.::::::::::::::::::::::::::::•??:::..:::::?:::::::?:::?:::::::::::::::::::::::
statistical
are given in Table 1: for each region, frequencydistribution
of the
indexes
a The
results
Fig. 1. DC magnetic field variations (upper panel) range, and component, we calculated the average and power of the magnetic signal integrated over value of the index < a > , the average error 22 s between 0.5 and 10 Hz (lower panel) on August <6a> and thestandard deviation a of the distribution
28, 1978, in the VDH coordinate system. Location of the indexes a.
of GEOS 2 in the magnetosphere {MSph), the magneto- These results allow to draw some interesting sheath (MS) and in the boundary layer (BL) are conclusions: - first, it is clear that the fit with indicated at the bottom. Magnetopause crossings a power law works pretty well, especially in the
(arrows) are determined from reversal in BH. Also case of the magnetopause and boundary layer; represented are the time intervals (horizontal bars indeed, both the average error and the standard
in the lower panel), over which a Fourier analysis deviation are small. In order to assess the validity of fluctuations has been performed (see Fig. 3 and of the determination of the index a, it is interest-
#). ing to compare the parameters < •a> and a. In the magnetopause and boundary layer, a is close to •a , which means that the fit with a single Spectra of Magnetic Components
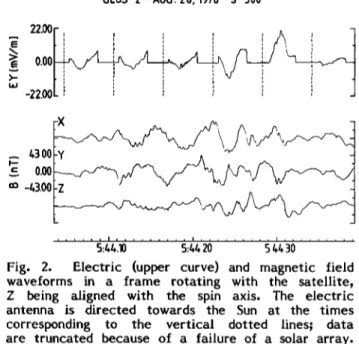
In Figure 2, the wave form of electric and magnetic field fluctuations are presented around 05•:20. The typical ratio 3E/ • B is of the order of V., the Alfven velocity. They are very intense
and s•ow a very erratic behaviour;
both features
are not consistent with what is expected for a wave. Thus it seems more appropriate to plot the spectra of magnetic components. It is difficult to proceed in the same way for the electric compo- nent indeed, because a failure of a solar arrayhas led to truncate the electric field data, as
indicated in Figure 2 by horizontal segments. Magne- tic spectra are computed over 22 s, and then
9 successive spectra are averaged (3 min data).
The spectra displayed in Figure 3 show a rather smooth decrease of the averaged power spectral density versus frequency, consistent with what is expected for a turbulent spectrum. This suggests to fit these spectra with power laws; for this pur- pose, we have used a least squares method. For each spectrum, we have determined the index
a and the power p at I Hz, so that P : p..f-a
O vP bein the power spectral density. The parameter
&:--I
N
1•:•
Ilog
Pi
- 1Ogpo
+
c•1og
fil
indicates
the
6EOS-2 AUG. 28, 1978 S-300
E 0.00
"' -22.00
œ 0.00 J'"'• m-/B.00 Z...
...
...
...
Fig. 2. Electric (upper curve) and magnetic field
waveforms in a frame rotating with the satellite• Z being aligned with the spin axis. The electric
antenna is directed towards the Sun at the times
corresponding to the vertical dotted lines; data
6EOS-2 AU6.28,1978 S-300
•-1 •/)-2 0 Oõ 05.32 -05.35 UT 6f=0.0•+5•+ Hz - I I 1 2 5 10 FREQUENCY [Hz) •-1 •/)-2 CD 0 Oõ05. 45 -05./+8U T Af= 0o045/+H z
•V - D H I I I 1 2 5 10 FREQUENCY (Hz)
c• is isotropic. It must be noticed, however, that
the coefficient P o is not always
isotropic:
in the
magnetosphere and deep magnetosheath, the power is often lower on the Z component. Besides, there is no significant difference between the two coordi- nate systems, which confirms that fluctuations are isotropic.
-third, in the boundary regions, there is an overlapping of the intervals <•> + < 6•> in the
two frequency ranges (0.5-3 Hz and 0.5-11 Hz),
which strengthens our conclusion that in these regions, the spectra can be fitted with an f power law.
In the magnetosphere, the standard deviation of the results is much larger, thus no f spectral law seems to apply. This is not much surprising, since the level of the fluctuations is very low. In the magnetosheath, it is more difficult to conclu- de, because in both frequency ranges there is a
quite good
agreement
with a f-c• law, yet index c•
changes with the frequency range: in the low fre-
quency
part, the decrease
is much faster (f-3.6)
than in the high one (f-3). How can we explain
the different behaviour of the various parts of the magnetosheath spectra? As mentioned above, the fluctuation levels in the magnetosheath are lower, thus suggesting that the magnetopause and boundary layer are the source of the fluctuations observed in the magnetosheath. Furthermore, this can explain the different frequency dependences in the two media; indeed the propagation of the fluctuations from their source being frequency-depen-
dent, one expects the lower frequencies (larger
Fig. 3.
Spectra of the magnetic fluctuations
in
wave lengths
) to propagate
further out than the
the magnetosheath
(upper panel), and in magneto- higher frequencies
(lower wave lengths
). This
pause and boundary layer crossings
(lower panel).
frequency-dependent
attenuation can explain first
The dot dashed line shows the average of the upper the larger index obtained in the magnetosheath,spectra for comparing
the slope of these spectra.
and second, the fact that this index decreases
from low frequencies to high ones. Thus these frequency-dependent laws are consistent with th•
value of • is appropriate within the accuracy assumption that the magnetopause is the source of the determination of • . In the magnetosheath of the fluctuations.
and magnetosphere, the standard deviation largely exceeds the average error, thus implying that
fitting with a power law with a single index is
Table I.
Computed
values of :<c•>average
value
not possible.
of indexes • , <6•> average
error on c•, astandard
- second, for the three components corresponding to the same frequency range and region, the inter- vals <•> + < 6•> overlap, thus the spectral index
6EOS- 2 AUG. 28,1978 S- 300
3
5./+5 - 5./+8 UT 6f= 0.0/+5/+Hz
deviation of the distribution of a .
0.5 to 3 Hz 0.5 to 11 Hz BOUNDARY CROSSINGS BL 2.52 0.23 0.26 2.59 0.1# 0.22 BR 2.#5 0.21 0.31 2.63 0.13 0.19 BZ 2.## 0.23 0.#l 2.#8 0.1# 0.20 V 2.28 0.23 0.37 2.#9 0.1# 0.22 D 2.57 0.21 0.#0 2.6# 0.13 0.1 3 H 2.#9 0.22 0.36 2.55 0.15 0.2# MAGNETOSHEATH BL 3. 76 0.18 0.5 7 3.02 0.13 0.3# BR 3.#5 0.17 0.37 3.02 0.13 0.38 BZ 3.# 3 0.18 0.50 2.88 0.1 # 0.32 V 3.#5 0.18 0.#5 2.92 0.13 0.32 D 3.73 0.19 0.52 3.07 0.15 0.38 •a H 3.61 0.17 0.#3 3.00 0.13 0.36
,
I
MAGNETOSPHERE
O.S
•
:•
S
10
BL
3.514 0.25
0.96
2.91
0.21
0.514
FREC•UENI:Y IHz) BR 3.32 0.23 0.97 2.87 0.19 0.54Fig. 14. Fit of the D-component
spectrum
wilih
BZ
3.26 0.25
0.614
2.59
0.19
0.66
a P :
P f=a law. a: 2.71, p : 9.1 nT
2 Hz=',
V
3.614 0.26 0.83
2.89 0.19 0.148
z• = 0.16.
]One
two curves
correspon•
to the extremum D
3.32 0.25 1.13
2.81 0.20 0.514
law. The error on the index, 6 cr is visualized at H 3.143 0.25 0.70 2.60 0.19 0.70 the bottom of the figure.
1096 Rezeau: Electromagnetic Fluctuations Near the Magnetopause
Summary and Discussion
During two days where the solar wind ram pressure was so large that GEOS-2 happened to cross the magnetopause several times, a detailed study of ULF fluctuations has been carried out. It has been shown that (i) the power spectral density in the magnetopause boundary layer can
be fitted by a power
law f-a with a single
value
of a ___2.5 for all crossings or all components, (ii)
by applying the same procedure to magnetosheath spectra, we found a different index a , but both
the standard deviation and the difference between
the values of a obtained for each component exceed the uncertainties. Furthermore, a depends
upon the frequency range considered ( a •_ 3.5 for 0.5 < f _< 3 Hz and a•3 for 0.5_< f <_ 11 Hz,
respectively). In the magnetosphere itself, the power spectral density is by 2 or 4 orders of
m_aa•.nitude
weaker; furthermore,
a fit with a
f law is irrelevant. Both the much higher level of fluctuations observed in the magnetopause boundary layer and the change in the spectral laws from magnetopause to magnetosheath are consistent with a source in the magnetopause and its boundary layer. Definitive proof of this, however, cannot be established from single space-craft measurements.
Since the fluctuations observed in the magneto- pause boundary layer are very intense (up to iSB/B ~ 15%), random, and can be fitted with a single power law, it is tempting to interpret them as a turbulent spectrum. The obtained index a = 2.5 is quite different from a= 5/3 anda =
3/2 found by Kolmogorov (1941) and by Kraichnan (1965), respectively. It should, however, be stressed
that neither of these theoretical results apply to the strongly magnetized plasma considered
here. Furthermore, the above authors have obtain-
ed, by dimension analysis, a power law in k space which does not necessarily imply a power law with the same index in frequency space. This problem has been solved by Matthaeus and Goldstein
(1982) , who took advantage of the super-Alfvenic
speed of the solar wind flow and assumed isotropy for converting the frequency spectra observed onboard a single spacecraft into a spectrum in k space. We are not a priori in a position to do
SO.
Given the high level of magnetic fluctua- tions in the magnetopause and its boundary layer, it is worth investigating their potential role in the spatial diffusion of the plasma through this boundary. From the expressions given by Tsurutani
and Thorne (1982) by using a sequence of GEOS
data, Gendrin (1983) concluded that the rate of diffusion he obtained (D ~ 400 km2.sec -') is suffi- cient for explaining the existence of a boundary layer adjacent to the magnetopause. While our study is in general agreement with this conclusion, we feel it necessary to take into account the
dependence
(f-a) of the observed
spectra
in the
evaluation of the diffusion rate; this will be done
elsewhere.
Acknowledgements. We are pleased to acknow-
ledge A. Pedersen (Space Science Department,
ESTEC, The Netherlands), who kindly provided
us with electric field data.
References
Eastman, T.E., and E.W. Hones, Characteristics of the low latitude boundary layer and magneto- pause layer at high time resolution, J. Geophys. Res., • 2019-202 8, 19 79.
Gendrin, R., Magnetic turbulence and diffusion processes in the magnetopause boundary layer, Geoph¾s. Res. Lett., 10_•, 769-771, 1983.
Knott, K., P. D•cr•au, A. Korth, A. Pedersen, and G.L. Wrenn, Observations of the GEOS equili- brium potential and its relation to the ambient energy distribution, ESA/SP-198, 19 - 24, 1983. Kodera, K., R. Gendrin, and C. de Villedary, Complex
representation of a polarized signal and its application to the analysis of ULF waves, J__z-
Geophys. Res., • 1245-1255, 1977.
Kolmogoroff, A.N., The local structure of turbu- lence in incompressible viscous fluid for very large Reynolds numbers, C.R. Acad. Sci. URSS• • 301, 1941.
Kraichnan, R.H., Initial-range spectrum of hydro- magnetic turbulence, Phys. Fluids., _• 1385, 1965. Matthaeus, W.H., and M.L. Goldstein, Measurements
of the rugged invariants of magnetohydrodynamic turbulence in the solar wind, 3. Geophys. Res., g_Z,7 6011, 1982.
Montgomery, D., Characteristic phenomena of magne- tohydrodynamic turbulence, in Future Missions in Solar• Hellospheric and Space Plasma Physics t
ESA/SP-235• pp. 175-179, 1985.
Paschmann, G., N. Sckopke, G. Haerendel, 3. Papamas- torakis, S.3. Bame, 3.R. Asbridge, 3.T. Gosling, E.W. Hones, Jr., and E.R. Tech, ISEE plasma observations near the subsolar magnetopause, Space Sci. Rev., 22.•, 717-737, 1979.
Pertaut, S., R. Gendrin, P. Robert, and A. Roux, Magnetic pulsations observed onboard GEOS-2 in the ULF range during multiple magnetopause
crossings, ESA/SP- 14 8, 113-122, 19 79.
Robert, P., K. Kodera, S. Pertaut, R. Gendrin, and C. de Villedary, Amplitude et polarisation des ondes UBF d6tect6es fi bord du satellite
GEOS-I. M6thodes d'analyse, problSmes rencon-
tr6s et solutions pratiques, Ann. Telecom., • 179-186, 19 79.
Tsurutani, B.T., and R.M. Thorne, Diffusion processes in the magnetopause boundary layer, Geoph¾s. Res. Lett., • 1247-1250, 1982.
L. Rez•au, S. Pertaut and A. Roux, CNET/CRPE,
92131 Issy-les-Moulineaux, France.
( Received July 1 7, 1986; revised August 28, 1986; accepted September 25, 1986.)