HAL Id: hal-00318339
https://hal.archives-ouvertes.fr/hal-00318339
Submitted on 29 Jun 2007
HAL is a multi-disciplinary open access
archive for the deposit and dissemination of
sci-entific research documents, whether they are
pub-lished or not. The documents may come from
teaching and research institutions in France or
abroad, or from public or private research centers.
L’archive ouverte pluridisciplinaire HAL, est
destinée au dépôt et à la diffusion de documents
scientifiques de niveau recherche, publiés ou non,
émanant des établissements d’enseignement et de
recherche français ou étrangers, des laboratoires
publics ou privés.
Electron flux enhancement in the inner radiation belt
during moderate magnetic storms
H. Tadokoro, F. Tsuchiya, Y. Miyoshi, H. Misawa, A. Morioka, D. S. Evans
To cite this version:
H. Tadokoro, F. Tsuchiya, Y. Miyoshi, H. Misawa, A. Morioka, et al.. Electron flux enhancement in the
inner radiation belt during moderate magnetic storms. Annales Geophysicae, European Geosciences
Union, 2007, 25 (6), pp.1359-1364. �hal-00318339�
www.ann-geophys.net/25/1359/2007/ © European Geosciences Union 2007
Annales
Geophysicae
Electron flux enhancement in the inner radiation belt during
moderate magnetic storms
H. Tadokoro1, F. Tsuchiya1, Y. Miyoshi2, H. Misawa1, A. Morioka1, and D. S. Evans3
1Planetary Plasma and Atmospheric Research Center, Tohoku University, Aoba-ku, Sendai, 980-8578, Japan 2Solar-Terrestrial Environment Laboratory, Nagoya University, Nagoya, 464-8601, Japan
3Space Environment Center, NOAA, Boulder, CO 80305, USA
Received: 26 September 2006 – Revised: 3 May 2007 – Accepted: 21 May 2007 – Published: 29 June 2007
Abstract. During moderate magnetic storms, an electron
channel (300–1100 keV) of the NOAA satellite has shown sudden electron flux enhancements in the inner radiation belt. After examinating the possibility of contamination by differ-ent energetic particles, we conclude that these electron flux enhancements are reliable enough to be considered as natural phenomena, at least for the cases of small to moderate mag-netic storms. Here, we define small and moderate storms to be those in which the minimum Dstranges between −30 and
−100 nT. The electron flux enhancements appear with over
one order of magnitude at L∼2 during these storms. The en-hancement is not accompanied by any transport of electron flux from the outer belt. Statistical analysis shows that these phenomena have a duration of approximately 1 day during the period, starting with the main phase to the early recovery phase of the storms. The flux enhancement shows a dawn-dusk asymmetry; the amount of increased flux is larger in the dusk side. We suggest that this phenomenon could not be caused by the radial diffusion but would be due to pitch-angle scattering at the magnetic equator. The inner belt is not in a stationary state, as was previously believed, but is variable in response to the magnetic activity.
Keywords. Magnetospheric physics (Energetic particles,
precipitating; Energetic particles, trapped; Storms and sub-storms)
1 Introduction
The variability of energetic particles in the Earth’s radiation belts has been studied in order to understand particle accel-eration and loss processes and their relationship to magne-tospheric disturbances (see the review for electron radiation belts by Friedel et al., 2002, and the references therein). It
Correspondence to: H. Tadokoro
is also important from the perspective of space weather to realize and predict the flux variation of the trapped particles. Several processes for electron acceleration have been pro-posed to account for the dynamical flux variations in accor-dance with magnetospheric disturbances. Radial diffusion has been discussed from the standpoint of an external source (e.g. Schultz and Lanzerotti, 1974). Some mechanisms per-taining to the internal source mechanisms have also been dis-cussed. In particular, the wave-particle interaction process is regarded as a plausible acceleration process during the ge-omagnetically disturbed periods (e.g. Meredith et al., 2002; Miyoshi et al., 2003, 2007; Horne et al., 2005).
Compared to the outer radiation belt, the inner belt has been believed to be a region where energetic electrons ex-hibit little temporal variability, except when an extremely huge magnetic storm impacts the distribution of the inner belt electrons (e.g. Gusev et al., 1995; Baker et al., 2004). Only a few reports have been presented that demonstrate the response of high energy electrons in the inner region to a magnetic storm (Kikuchi and Evans, 1989; Morioka et al., 2001; Miyoshi et al., 2002). By using data from the NOAA satellite, Kikuchi and Evans (1989) showed that a >30-keV electron flux at the lower L (∼1.3) exhibited a sudden en-hancement during a magnetic storm. Morioka et al. (2001) and Miyoshi et al. (2002) also reported that a 300-keV elec-tron flux enhancement in the inner belt (L∼2) was synchro-nized with the onset of the outer belt electron decrease during some magnetic storms.
A polar orbiting low-altitude satellite such as NOAA is appropriate for observing flux distributions and their dynam-ics over a wide range of L with high time resolution because it permits a detailed comparison between the outer and in-ner radiation belts within time scales of the development of storms. In this paper, we investigate the variability of the electron flux in the inner belt and its relation to magnetic storms.
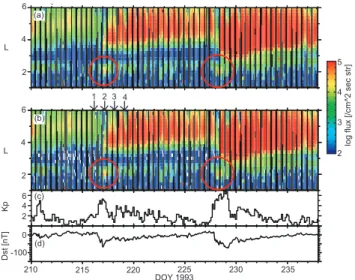
1360 H. Tadokoro et al.: Electron flux enhancement in the inner radiation belt DOY 1993 lo g f lu x [/ cm^ 2 se c st r] 2 5 4 3 210 215 220 225 230 235 (c) (a) (b) (d) D st [ n T ] -100 0 Kp 2 4 6 L 2 4 6 L 2 4 6 234 1
Fig. 1. L-t diagram for a 300-keV electron flux derived from the 90◦
sensor (a), and after subtraction of the count rates of the 0◦sensor
from that of the 90◦sensor (b). (c) The Kpindex. (d) The Dst
index.
2 Observations
To investigate variations of energetic particle flux in the inner belt, we used data from the NOAA 10 and NOAA 12 satel-lites that were in a Sun-synchronous polar orbit with an incli-nation of 98◦and an altitude of about 800 km. The orbital
pe-riod was about 102 min. The local times of the ascending and descending phases of the satellites were 19.5 h (dusk side) and 7.5 h (dawn side), respectively. The Medium Energy Pro-ton Electron Detector (MEPED) on board the NOAA satel-lites measured the electron counts in three energy channels (E1: 30–1100, E2: 100–1100, and E3: 300–1100 keV), pro-ton counts in five energy channels (P1: 30–80, P2: 80–250, P3: 250–800, P4: 800–2500, and P5: >2500 keV), and one omnidirectional channel (P6: >16 MeV). It is well known that the P6 channel also detects >1 MeV electrons (Miyoshi et al., 2004). The MEPED is made up of two sensors; one called the 0◦sensor, which views radially outward along the
vector from the Earth to the satellite, and the other called the 90◦sensor, which views in a direction perpendicular to the
0◦sensor. The details of the MEPED are described in Raben
et al. (1995). In the present study, we made use of the data during the period from 1989 to 1998. Taking into account the flux variation caused by the offset of the terrestrial magnetic field, we restricted the data to a geographic longitude rang-ing from 180◦to 280◦in the Northern Hemisphere, and from
180◦to 250◦in the Southern Hemisphere. The electrons of
the 90◦sensor are in the drift loss cone (Blake et al., 2001).
3 Results and discussion
3.1 The inner electron flux enhancement event
Figure 1a shows the 2-h-averaged flux of energetic elec-trons in the channel of 300–1100 keV, plotted in the L-t di-agram, during the period from the 210 to 238 days of 1993. Figures 1c and d present the Kp and Dst indices,
respec-tively. There were two moderate magnetic storms during this period, whose minimum Dst indices were greater than
−100 nT.
In Fig. 1, the electron channel showed rapid flux enhance-ments in the inner belt (2<L<2.5) during the main phase of the magnetic storms (DOY 217 and 228). The most signif-icant point is that the electron flux at L=2 (the inner belt) increased by more than one order of magnitude during the main phase before the flux increase in the outer belt. The peak of the inner zone depends on data selection. An elec-tron flux peak L<2 (Lyons et al., 1972) is observed in the South Atlantic Anomaly (SAA), where many particles can precipitate deeply into the atmosphere due to a lower mirror point. However, we did not select this region, and restricted the data for geographic longitude ranging from 180◦to 280◦
in the Northern Hemisphere and from 180◦ to 250◦ in the
Southern Hemisphere. Therefore, the peak of the inner belt can be seen around L=2 in the present data set. The dura-tion of the inner belt enhancement was about 1–1.5 days. It should be noted that the inner belt enhancement was sep-arated from the outer belt by the distinct slot region. These inner belt flux enhancements were mostly found during mod-erate intensity storms. Although intense enhancements also occurred during great storms (<−100 nT), it is difficult to distinguish the flux enhancement in the inner belt from the violent injection from the outer belt. Hence, we concentrated only on moderate storms in this study.
3.2 Examination of the possibility of contamination The example shown in Fig. 1a has clearly demonstrated the flux enhancement of energetic electrons in the inner radiation belt during moderate magnetic storms. Before investigations of this phenomena, it should be examined whether the de-tected flux enhancement in the E3 channel of MEPED really does result from electrons of 300–1100 keV or is it a result of an apparent enhancement due to the contamination by differ-ent energetic particles. The E3 (300–1100 keV) channel has some response to energetic protons having energies of 440– 2700 keV and >90 MeV, and to electrons having energies of
>6 MeV (Evans and Greer, 2000). In addition to these pos-sible sources of contamination, it should also be mentioned that the count rate of the E3 channel may become uncertain when the P1 (30–80 keV) channel has count rates that are similar to the E3 channel.
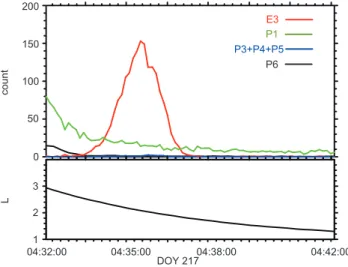
Figure 2 shows the variation in the count rate (top) and the L value (bottom) corresponding to the DOY 217 storm in
co u n t L 0 50 100 150 200 3 2 1 E3 P1 P6 P3+P4+P5 04:32:00 04:35:00 04:38:00 04:42:00 DOY 217
Figure 2 (Tadokoro et al.)
Fig. 2. Variation of the count rates at various channels at the DOY 217 storm. The red, green, blue, and black lines show the count rates of the E3, P1, P3+P4+P5, and P6 channels, respectively. The bottom panel indicates the variation of L.
Fig. 1. The red, green, blue, and black lines indicate count rates of E3, P1, P3+P4+P5, and P6, respectively. It can be seen that the E3 count rates increased around L=2. At the same time, the count rates obtained from P1 were found to be about one-tenth. In addition, the trend in variations of E3 and P1 was completely different. Thus, we conclude that proton flux from P1 of 30–80 keV did not contribute to the corre-sponding flux enhancement in E3 for this case. Regarding the possibility of proton contamination (440–2700 keV), we can examine the possibility by estimating the sum of the P3, P4, and P5 count rates. The count rates were virtually zero dur-ing the enhancement of E3. Therefore, we conclude that the 300-keV electron flux enhancement is not due to the contam-ination from protons (440–2700 keV). Finally, the variation of the P6 count rates provides a rough estimation of the pos-sible contamination by >90 MeV protons and >6 MeV elec-trons (Evans and Greer, 2000). It can be seen that the count rates of the P6 channel were almost zero around L=2. Thus, we can exclude the possibility of contamination by >90 MeV protons and >6 MeV electrons.
Besides the above discussion, we defined the precipitat-ing electron flux by subtractprecipitat-ing counts of the 0◦sensor from
those of the 90◦ sensor. Figure 1b shows the variation of
electron flux (300 keV) extracted the 0◦sensor from the 90◦
sensor. The white color indicates the area where the electron flux from the 0◦ sensor was greater than that from the 90◦
sensor. Assuming a uniform angular distribution of contam-ination, it is natural to consider that the contamination of the 90◦sensor should be equal to that of the 0◦sensor. If the E3
channel contains the contamination, the 90◦and 0◦sensors
comprise true count rates from each sensor and equal con-tamination, respectively. Thus, the electron flux in Fig. 1b underestimates electron flux compared to the true electron
Energy [keV] lo g f lu x [/ cm^ 2 se c st r] 6 5 4 3 20 50 100 200 4 (DOY 219 UT 02:00) 2 (DOY 217 UT 02:00) 3 (DOY 218 UT 02:00) 1 (DOY 216 UT 02:00) 1 2 3 4
Fig. 3. Electron energy spectrum during the initial phase
trum 1), the main phase (spectrum 2), and the recovery phase (spec-trum 3, 4) of the DOY 217 storm.
flux. However, it can be seen that the electron flux enhance-ment appears in the inner belt during the two storms. This is one of the results which supports that the electron flux en-hancement is not due to contamination.
From these examinations, we conclude that the present phenomena of the inner electron flux enhancement, as shown in Fig. 1, are due to the 300–1100 keV electrons. Hereafter, we examine the data sets in which the count rate of the 0◦
sensor data have been subtracted from that of the 90◦sensor,
as shown in Fig. 1b.
3.3 Characteristic of the inner electron flux enhancement To investigate variations in the electron spectral shape in re-sponse to magnetic storms, we examined the variability in electron energy spectra at L=2 during these moderate mag-netic storms. Figure 3 shows energy spectra on the DOY 217, where the vertical axis represents the logarithm of the flux and the horizontal axis, the particle energy. The numbers alongside the figures correspond to the time shown by the arrows in Fig. 1b. The spectrum changed from soft to hard during the main phase of the storm (from Spectrum 1 to 2), corresponding to the electron flux enhancement, as shown in Fig. 1. After this enhancement, the spectra in the storm recovery phase (Spectrum 3, 4) turned again to soft, as in the initial phase (Spectrum 1). This suggests that the higher energy component of the electron flux in the inner belt in-creased more than the lower energy component during the main phase.
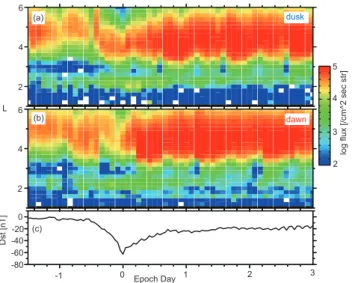
The statistical behavior of the electron flux enhancement in the inner belt during small and moderate magnetic storms was studied by means of the superposed epoch analysis. We selected 32 moderate storms that involved electron flux en-hancement events in the inner belt during the period from 1989 to 1998. We used the data from the NOAA 10 and
1362 H. Tadokoro et al.: Electron flux enhancement in the inner radiation belt Epoch Day lo g f lu x [/ cm^ 2 se c st r] 2 3 -80 0 2 6 (c) 4 4 D st [ n T ] L -60 -40 -20 2 6 4 dawn dusk 0 1 2 3 -1 5 (b) (a)
Fig. 4. Superposed electron flux (300–1100 keV), and Dstindex for
32 storms. The zero epoch is taken to be the time of the minimum
Dst value. (a) h-averaged electron flux at the dusk side. (b)
2-h-averaged electron flux at the dawn side. (c) the superposed Dst
index.
NOAA 12 satellites during the period from 1989 to 1991 and from 1992 to 1998. Here, we define small and mod-erate storms to be those in which the minimum Dst ranged
between −100 and −30 nT. The zero epoch is taken to be the time of the minimum Dst value. The result of the analysis
is shown in Fig. 4, where Figs. 4a and b show L-t diagrams of the superposed 2-h-averaged flux variation from the 90◦
sensor at the dusk and dawn sides, respectively. From these figures it can be seen that inner belt electrons around L∼2.2 increase during the main phase (∼−0.4 day) by about one or-der of magnitude, whereas the flux of the outer belt decreases significantly. The duration of the enhancement was found to be about 1 day from this analysis. The analysis also showed a local time dependence: The enhancement in the flux at the dusk side was found to be greater than that at the dawn side. This local time asymmetry suggests that the phenomena are related to local processes. Our statistical study also indicated that the magnitude of the flux enhancement did not correlate with the minimum Dst (not shown).
Another interesting point to note here is that the flux en-hancement was observed at lower L values than for the typi-cal inner belt positions observed by NOAA. A typitypi-cal exam-ple shown in Fig. 5 illustrates the electron flux variation from the 157 to 163 days of year 1992. The inner belt is faint but can be steadily observed before the storm in the region from L=2 to L=2.5. Just as the main phase of the storm begins on DOY 308, the inner belt flux enhancement was observed at a region having a lower L (L∼2) value than usual. The same feature is also confirmed in Fig. 1.
lo g f lu x [/ cm^ 2 se c st r] 2 5 4 3 DOY 1992 D st [ n T ] 157 158 159 160 161 162 -150 -100 0 Kp 2 4 0 6 L 2 4 6 (b) (c) -50 163 (a)
Fig. 5. (a) L-t diagram of electron flux variations in the radiation
belt from the 157 to 163 days of 1992. (b) The Kpindex. (c) The
Dstindex.
3.4 Possible mechanisms for the enhancement of inner belt electrons
One of possible mechanism explaining the inner belt flux en-hancement during a magnetic storm is radial diffusion (Gu-sev et al., 1995), a process by which particles diffuse from a region of higher phase-space density region to a lower one. The electron flux enhancement event investigated in this study, however, did not exhibit a corresponding trans-port from the outer belt to the inner belt across the slot re-gion, as shown in Fig. 1, and Fig. 4. Loto’aniu et al. (2006) estimated the time scale of radial diffusion for energetic elec-trons for the case of the 2003 Halloween storm. Their results were consistent with the diffusion time scales of 12 h over L=2.1–3.3 observed by SAMPEX during the storm. The dif-fusion time scale for the case of small to moderate storms mentioned in the present study would be longer compared to the great storm because the radial diffusion coefficients de-pend on magnetic activity (e.g. Brautigam and Albert, 2000). However, the inner electron flux enhancement event occurred within 12 h from the start (beginning of the main phase) of the small or moderate storms. Thus, we can conclude that this electron flux enhancement is not caused by the radial diffusion process from the outer belt.
Another possible mechanism for the present phenomenon would be pitch-angle scattering of the trapped electrons by wave-particle interactions at the magnetic equator. The ev-idence of precipitation for energetic electrons (∼ several tens of keV) are observed at low altitude (e.g. Inan et al., 1984). Imhof et al. (1983) showed that such precipitations are caused by VLF signals during the quiet time. To exam-ine this process, we should first investigate the existence of waves that can interact with the electrons during magnetic storms in the inner magnetosphere. Meredith et al. (2004)
showed that plasmaspheric hiss emissions during substorm activity distribute mainly in the dayside. Enhanced plasmas-pheric hiss or other waves could be a possible candidate for the cause of pitch-angle scattering in the inner belt. In the near future, we plan to clarify such a relationship between the generation of whistler mode waves and the response of the inner radiation belt electrons during magnetic storms.
4 Summary
We have examined electron (300–1100 keV) flux enhance-ments in the inner belt during small to moderate magnetic storms. Our results show that the NOAA observed electron flux enhancement in the inner belt is not due to the contam-ination from other energetic particles in small and moder-ate magnetic storms. The enhancement of electron flux also showed characteristics that were different from those in the outer belt. The results are summarized as follows:
1. The flux of inner belt electrons increases by over one order of magnitude during the main phase of magnetic storms. This is a contrary variation to the outer belt. 2. The duration of such electron flux enhancements is
ap-proximately 1 day.
3. During the event, the electron flux shows spectral hard-ening.
4. There is a local time dependence on the flux enhance-ment.
5. The flux enhancement appears at lower L (∼2) values than the typical inner belt positions (L∼2.2) observed by NOAA.
Acknowledgements. We thank K. T. Asai for useful discussions re-garding problems related to contamination of the MEPED
instru-ment. The Dstand Kpindicies are provided from WDC-C2 in
Ky-oto University. NOAA through the WDC-C2 for Aurora, National Institute of Polar Research, Japan.
Topical Editor I. A. Daglis thanks R. Selesnick and another anonymous referee for their help in evaluating this paper.
References
Baker, D. N., Kanekal, S. G., Li, X., Monk, S. P., Goldstein, J., and Burch, J. L.: An extreme distortion of the Van Allen belt arising from the Hallowe’en solar storm in 2003, Nature, 432, 878–881, 2004.
Blake, J. B., Inan, U. S., Walt, M., Bell, T. F., Bortnik, J., Chenette, D. L., and Christian, H. J.: Lightning-induced energetic electron flux enhancements in the drift loss cone, J. Geophys. Res., 106, 29 733–29 744, 2001.
Brautigam, D. H. and Albert, J. M.: Radial diffusion analysis of outer radiation electrons during the October 9, 1990, magnetic storm, J. Geophys. Res., 105, 291–309, 2000.
Evans, D. S. and Greer, M. S.: Polar Orbiting Environmental Satel-lite Space Environment Monitor – 2: Instrument Descriptions and Archive Data Documentation, Space Environment Center, Boulder, Colorado, 2000.
Friedel, R. H. W., Reeves, G. D., and Obara, T.: Relativistic electron dynamics in the inner magnetosphere-a review, J. Atmos. Sol. Terr. Phys., 64, 265–282, 2002.
Gusev, A. A., Kohno, T., Martin, I. M., Pugacheva, G. I., Turtelli Jr., A., Tylka, A. J., and Kudela, K.: Injection and fast radial diffu-sion of energetic electrons into the inner magnetosphere, Planet. Space Sci., 43, 1131–1134, 1995.
Horne, R. B., Thorne, R. M., Shprits, Y. Y., Meredith, N. P., Glauert, S. A., Smith, A. J., Kanekal, S. G., Baker, D. N., Engebretson, M. J., Posch, J. L., Spasojevic, M., Inan, U. S., Pickett, J. S., and De-creau, P. M. M.: Wave acceleration of electrons in the Van Allen radiation belts, Nature, 437, 227–230, doi:10.1039/nature03939, 2005.
Imhof, W., Reagan, J. B., Voss, H. D., Gaines, E. E., Datlowe, D. W., and Mobilia, J.: DIRECT Observation of radiation belt electrons precipitated by the controlled injection VLF signals from ground-based transmitter, Geophys. Res. Lett., 10, 361– 364, 1983.
Inan, U. S., Chang, H. C., and Helliwell, R. A.: Electron Precipita-tion Zones Around Major Ground-Based VLF Signal Sources, J. Geophys. Res., 89, 2891–2906, 1984.
Kikuchi, T. and Evans, D. S.: Energetic electrons observed by NOAA-6 over Japan (L=1.3) at the time of geomagnetic storm on February 8–9, Proc. Res. Inst. Atmos., Nagoya University, 36, 137–149, 1989.
Loto’aniu, T. M., Mann, I. R., Ozeki, L. G., Chan, A. A., Dent, Z. C., and Milling, D. K.: Radial diffusion of relativistic elec-trons into the radiation belt slot region during the 2003 Hal-loween geomagnetic storms, J. Geophys. Res., 111, A04218, doi:10.1029/2005JA011355, 2006.
Lyons, L. R., Thorne, R. M., and Kennel, C. F.: Pitch-Angle Dif-fusion of Radiation Belt Electrons within the Plasmasphere, J. Geophys. Res., 77, 3455–3474, 1972.
Meredith, N. P., Horne, R. B., Summers, D., Thorne, R. M., Iles, R. H. A., Heynderickx, D., and Anderson, R. R.: Evidence for acceleration of outer zone electrons to relativistic energies by whistler mode chorus, Ann. Geophys., 20, 967–979, 2002, http://www.ann-geophys.net/20/967/2002/.
Meredith, N. P., Horne, R. B., Thorne, R. M., Summers, D., and Anderson, R. R., Substorm dependence of plasmaspheric hiss, J. Geophys. Res., 109, A06209, doi:10.1029/2004JA010387, 2004. Miyoshi, Y., Morioka, A., Obara, T., and Nagai, T.: Dynamics of the energetic particles during the storm main phase – EXOS-D (Akebono) and NOAA observations –, Eos. Trans. AGU, 83(22), West. Pac. Geophys. Meet. Suppl., Abstract SP21A-01, 2002. Miyoshi, Y., Morioka, A., Obara, T., Misawa, H., Nagai, T.,
and Kasahara, Y.: Rebuilding process of the outer radiation belt during the 3 November 1993 magnetic storm: NOAA and Exos-D observations, J. Geophys. Res., 108(A1), 1004, doi:10.1029/2001JA007542, 2003.
Miyoshi, Y. S., Jordanova, V. K., Morioka, A., and Evans, D. S.: Solar cycle variations of the electron radiation belts: Observa-tions and radial diffusion simulation, Space Weather., 2, S10S02, doi:10.1029/2004SW000070, 2004.
1364 H. Tadokoro et al.: Electron flux enhancement in the inner radiation belt Evolution of the outer radiation belt during the November 1993
storms driven by corotating interaction regions, J. Geophys. Res., 112, A05210, doi:10.1029/2006JA012148, 2007.
Morioka, A., Miyoshi, Y., and Obara, T.: Dynamics of Energetic Particles in the Inner Radiation Belt During Magnetic Storms, International Space Environment Conference 2001, Queenstown, New Zealand, 2001.
Raben, V. J., Evans, D. S., Sauer, H. H., Sahm, S. R., and Huynh, M.: TIROS/NOAA satellite space environment monitor data archive documentation: 1995 update, NOAA Tech. Memo. ERL SEL-86, 1995.
Schultz, M. and Lanzerotti, L. J.: Particle diffusion in the radia-tion belts, in: Physics and Chemistry in Space, Springer-Verlag, Berlin, 1974.