HAL Id: hal-03027728
https://hal.archives-ouvertes.fr/hal-03027728
Submitted on 27 Nov 2020HAL is a multi-disciplinary open access
archive for the deposit and dissemination of sci-entific research documents, whether they are pub-lished or not. The documents may come from teaching and research institutions in France or abroad, or from public or private research centers.
L’archive ouverte pluridisciplinaire HAL, est destinée au dépôt et à la diffusion de documents scientifiques de niveau recherche, publiés ou non, émanant des établissements d’enseignement et de recherche français ou étrangers, des laboratoires publics ou privés.
Late Pleistocene-Holocene Slip Rate Along the Hasi
Shan Restraining Bend of the Haiyuan Fault:
Implication for Faulting Dynamics of a Complex Fault
System
Rémi Matrau, Yann Klinger, Jerome van der Woerd, Jing Liu-zeng, Zheng Li,
Xiwei Xu, Rongzhang Zheng
To cite this version:
Rémi Matrau, Yann Klinger, Jerome van der Woerd, Jing Liu-zeng, Zheng Li, et al.. Late Pleistocene-Holocene Slip Rate Along the Hasi Shan Restraining Bend of the Haiyuan Fault: Implication for Faulting Dynamics of a Complex Fault System. Tectonics, American Geophysical Union (AGU), 2019, 38 (12), pp.4127-4154. �10.1029/2019TC005488�. �hal-03027728�
Late Pleistocene-Holocene Slip Rate Along the Hasi
Shan Restraining Bend of the Haiyuan Fault: Implication
for Faulting Dynamics of a Complex Fault System
Item Type Article
Authors Matrau, R.; Klinger, Yann; Van der Woerd, J.; Liu-Zeng, J.; Li, Z.; Xu, Xiwei; Zheng, R.
Citation Matrau, R., Klinger, Y., Van der Woerd, J., Liu-Zeng, J., Li, Z., Xu, X., & Zheng, R. (2019). Late Pleistocene-Holocene Slip Rate Along the Hasi Shan Restraining Bend of the Haiyuan Fault: Implication for Faulting Dynamics of a Complex Fault System. Tectonics. doi:10.1029/2019tc005488
Eprint version Post-print
DOI 10.1029/2019TC005488
Publisher American Geophysical Union (AGU)
Journal Tectonics
Download date 27/11/2020 11:24:10
This article has been accepted for publication and undergone full peer review but has not been through the copyediting, typesetting, pagination and proofreading process which may
Klinger Yann (Orcid ID: 0000-0003-2119-6391) Liu-Zeng Jing (Orcid ID: 0000-0001-7108-6452) Xu Xiwei (Orcid ID: 0000-0002-8301-7347)
Late Pleistocene-Holocene slip rate along the Hasi Shan restraining bend of the
Haiyuan fault: implication for faulting dynamics of a complex fault system
R. Matrau1,*, Y. Klinger1, J. Van der Woerd2, J. Liu-Zeng3, Z. Li3, X. Xu4, and R.
Zheng3
1 Université de Paris, Institut de physique du globe de Paris, CNRS, F-75005 Paris, France.
2 Institut de Physique du Globe de Strasbourg, UMR 7516 CNRS Université de Strasbourg,
Strasbourg, France.
3 State Key Laboratory of Earthquake Dynamics, Institute of Geology, China Earthquake
Administration, Beijing, China.
4 Institute of crustal dynamics, China Earthquake Administration, Beijing, China.
* Now at King Abdullah University of Science and Technology, Thuwal, Saudi Arabia.
Corresponding author: Yann Klinger ([email protected])
Key Points:
Slip rate along the Hasi Shan section of the Haiyuan fault is determined from numerous offsets and cosmogenic exposure dates over a period of 50000 years.
The Hasi Shan fault strand horizontal slip rate is about 3.2 mm/yr. This rate is stable over 50000 years. The uplift rate is about 0.5 mm/yr.
Combining slip-rate for the Hasi Shan strand and all sub-parallel stands yields a slip rate of 5 to 7 mm/yr for the Haiyuan fault system.
Abstract
The Haiyuan fault is a major left-lateral strike-slip fault at the boundary between northeast Tibet and the Gobi platform. Combining measurements of offset alluvial terraces with 10Be -
26Al cosmogenic radionuclides (CRN) dating, we bracket the late Quaternary slip rate along
the Hasi Shan fault section (37°00' N, 104°25' E) of the Haiyuan fault. At our reference site, terrace-riser offsets for 5 successive terraces range from ~5 m to ~200 m, and associated CRN ages range from 9 ± 3 kyr to 44 ± 7 kyr. These measurements yield a geological slip rate between 2.7 mm/yr and 3.0 mm/yr. Extending the offset measurements to the entire Hasi Shan front, it yields a slip rate of 3.2 ± 0.2 mm/yr over the last ~50 kyr. Our rate is consistent with the lower estimates of other long-term rates of 4 to 5 mm/yr, as well as with geodetic rates of 3 to 5 mm/yr, determined in the same area. About 150 km farther west, however, Holocene terraces and moraines offsets have suggested higher slip rate values, between 6 mm/yr and 15 mm/yr. We interpret such discrepancy between rates determined along the western section of the Haiyuan fault and rates determined in the Hasi Shan section as being related to the complex geometry of the Haiyuan fault system along its eastern part, with several active strands moving at the same time and resulting in distributed slip among several sections of the fault system.
1 Introduction
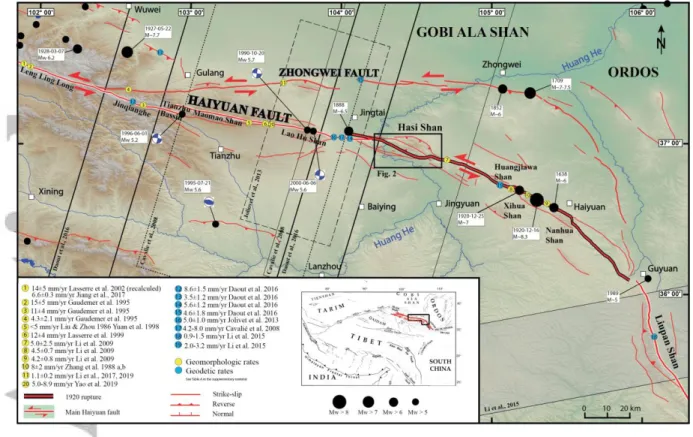
The Haiyuan fault, together with the Altyn Tagh fault, define the northern boundary of the Tibetan blocks. These two faults form a 3000 km-long left-lateral strike-slip fault system that enables eastward extrusion of Tibet relative to Eurasia, in response to the Indo-Asia collision (Figure 1) [Tapponnier and Molnar, 1977]. Although the length and clear morphology of these faults make it the largest active strike-slip fault system of Asia, more quantitative constraints are needed to understand how deformation is accommodated along its different sections. The Haiyuan fault crosses the Chinese provinces of Qinghai, Gansu, Ningxia, and Shaanxi and separates the highly deformed northern Tibetan block to the south, from the undeformed Gobi Ala Shan platform to the north [Burchfiel et al., 1991; Deng et al., 1986; Gaudemer et al., 1995]. The ~1000 km-long left-lateral strike-slip fault runs from 98°E to 107°E, connecting shortening in the Qilian Shan at the eastern termination of the Altyn Tagh fault to the extensional tectonics of northeastern China in the Wei He graben (e.g. [Peltzer et al., 1985; Meyer et al., 1998; Peltzer and Saucier, 1996]). Near 102.3°E, the fault splays in two main branches, the Zhongwei fault to the north and the main Haiyuan fault strand to the south (Figure 1). The Zhongwei fault reconnects with the main Haiyuan strand about 400 km eastward, near the city of Guyuan (106°E). The main Haiyuan fault strikes approximately N100°E west of the Huang He (Yellow River), and progressively veers southward to reach N140°E east of the Huang He, and about N170°E along the Liupan Shan. Eventually it resumes to N150°E west of the Wei He graben.
Several major earthquakes occurred along the central Haiyuan fault (Figure 1). On 16 December, 1920, an earthquake of magnitude M~8.3 ruptured 220 km of the Haiyuan fault between the cities of Jingtai to the west, and Guyuan to the east [Deng et al., 1986; Zhang et
al., 1987], with an estimated maximum co-seismic displacement of ~5 m [Ren et al., 2016]. It
earthquake of magnitude M~7.7 occurred on 23 May, 1927, close to the western Haiyuan-Zhongwei faults junction. This earthquake is believed to have ruptured a thrust-fault system north of the Haiyuan fault [Gaudemer et al., 1995; Xu et al., 2010]. Along the Zhongwei fault, a major earthquake occurred in 1709, with an estimated magnitude M7-7.5 [Wei et al., 2001]. In addition, paleoseismological trenches along the Haiyuan fault suggest that 6 events ruptured the central Haiyuan strand in the last 3500 – 3900 years [Liu-Zeng et al., 2007]. Historical medium-size earthquakes have also been documented along the 1920 rupture section [Liu-Zeng et al., 2015].
The Haiyuan fault system is formed by numerous fault strands (few tens of km long) with different azimuths. Hence, the Haiyuan fault system has a complex geometry. Such complexity has major implications on the distribution of the slip across the fault system, hence on the slip rate along the different branches, and eventually on the regional seismic hazard. Here, we present a detailed morphotectonic analysis of a 20 km-long section in the Hasi Shan restraining bend along the western part of the 1920 earthquake rupture (Figure 2). We document preserved offset alluvial terraces, whose ages are constrained with cosmogenic radionuclide (CRN) dating to estimate the late Pleistocene-Holocene slip rate of the fault. We interpret this slip rate in the framework sets by other studies and discuss the regional balance and distribution of the deformation in relation with the large-scale Haiyuan fault system geometry.
2 Morphotectonic setting of the Haiyuan fault
2.1 Large scale setting
The Haiyuan fault is generally divided in three parts. The western part is about 350 km long, from 98°E to 102°E, with an average azimuth of N100, getting closer to N125 along
the Leng Long Ling restraining bend. The central part is ~450 km long, from 102°E to 106°E, with an azimuth between N100 and N125, depending on the sections. The eastern part is shorter, 210 km, from 106°E to 107.5°E. Its azimuth ranges between N140° and N170°.
In the following, we will mostly focus on the central part of the Haiyuan fault (Figure
1).
The main central Haiyuan strand may be divided into two parts: The first part, between longitude 101.6°E and 104.3°E, is 250 km long. It is located between the 1920 and the 1927 earthquake ruptures and is often referred to as the “Tianzhu seismic gap” [Gaudemer et al., 1995]. The second part of the central segment extends for 220 km between the cities of Jingtai and Guyuan. It corresponds to the section that ruptured during the 1920 earthquake. Along that segment, east of the Mijia Shan, the fault veers toward the south, reaching N120°E along the Hasi Shan (Figure 2). After several left-stepping jogs and successive segments along the Huangjiawa Shan and Nanhua Shan, the fault eventually reaches an almost north-south direction along the ~200 km-long Liupan Shan section, which corresponds to the eastern part of the Haiyuan fault (Figures 1). This change in the fault strike around longitude 105°E results in a significant part of the deformation to become compressional, and this part is dominated by thrust motion.
Similarly, the Zhongwei fault strand, also called the Tianjing Shan fault, may also be divided into three parts according to strike. For about 160 km, from its western junction with the Haiyuan fault at 102°5 to 104°E, the western part of the Zhongwei fault strikes east-west to N85°E. The next part strikes east-west to 105°E, and then veers southward until 105.8°E for a length of 190 km. This part comprises the segment that ruptured during the historical earthquake of 1709 (M7-7.5). The last part strikes N120 to north-south for 100 km and connects with the main Haiyuan fault near Guyuan.
The central part of the Haiyuan fault has been the focus of several studies aiming at determining its slip rate along different sections (Figure 1 and Table S1). Most of these studies analyse only one or two offset markers. Along the Leng Long Ling section, based on high-resolution topography and offset measurements, although with poor age constraints, a slip rate of 6.6 ± 0.3 mm/yr has been proposed for the Holocene period [Jiang et al., 2017]. In contrast, at a near-by site, Lasserre et al. [2002] have estimated a Late Pleistocene slip rate from a 200±40 m moraine offset. This rate ranges from a minimum of 11±3 mm/yr with a proposed maximum Late Glacial Maximum age (LGM 18±1 kyr) for the moraine to a maximum of 15 ± 3 mm/yr with 10Be exposure ages of Younger Dryas boulders (13±1 kyr)
(after updating the original cosmogenic isotope data following current calculation standards, in particular revision of the 10Be production rate, e.g., Borchers et al., 2016). Although not
substantiated by direct dating, Gaudemer et al. [1995] have proposed that east of the Haiyuan-Zhongwei junction, the slip rate decreases to 11 ± 4 mm/yr. Farther east, along the Maomao Shan (103°E) Lasserre et al. [1999] have proposed a slip rate of 12 ± 4 mm/yr. East of the Hasi Shan, Zhang et al. [1988] have proposed a slip rate of 8 ± 2 mm/yr, based on offset stream channels and radiocarbon dating. A more recent study, based on offset terraces and radiocarbon ages, has proposed a Quaternary slip rate ranging from 4 to 5 mm/yr for similar areas, east of the Hasi Shan and west of the city of Haiyuan [Li et al., 2009].
Along the Zhongwei fault, values of slip rates are also contrasted. A combination of geomorphological measurements with assumption on ages, based on regional climatic variations, led Gaudemer et al. [1995] to propose a Quaternary slip rate of 4.3 ± 2 mm/yr, just east of the Haiyuan-Zhongwei junction. Further east, near the city of Xishaomen (103.4°E), OSL dating of offset landforms yield slip rates ranging from 1.1 ± 0.2 mm/yr [Li et al., 2017, 2019] to 4 - 5 mm/yr [Wei et al., 2001].
Short-term slip rates across the Haiyuan fault, both across the main strand and across the Zhongwei strand, based on space geodesy, are rather consistent with the slower geologic rates. Across the main strand south of the city of Jingtai, InSAR data studies yield a slip rate of about 5 ± 1 mm/yr [Cavalié et al., 2008; Daout et al., 2016; Jolivet et al., 2012]. Similarly, GPS measurements yield a slip rate of 3 to 5 mm/yr [Gan et al., 2007; Zheng et al., 2013]. Across the Zhongwei strand, InSAR yields a slip rate of 3.7 ± 1.3 mm/yr [Daout et al., 2016].
2.2 Hasi Shan setting
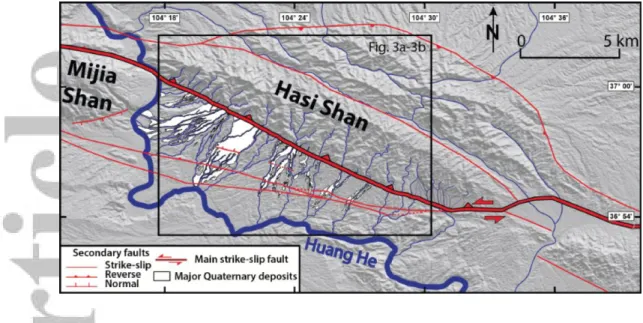
Our study focuses on the 20 km-long section (from 104.33°E to 104.55°E) of the Haiyuan fault located at the southern front of the Hasi Shan (Figures 1 - 3). West of the Hasi Shan, the main fault strikes N105°E. When it reaches to the Hasi Shan, where the fault crosses the Huang He, it veers southward to strike N120°E along the southern front of the Hasi Shan. Further east, it bends back northwards through left-stepping pull-apart basins to reach N112°E east of the Hasi Shan. Hence, these changes in fault strike imply a localized compressional zone resulting in uplifted topography up to 3000 m asl. Indeed, the Hasi Shan forms a restraining bend.
The Hasi Shan is a set of two sub-parallel ranges, 35 km-long and 15 km-wide, (Figure 2). Each of these ranges is bounded on either side by faults, likely to be partly reverse, forming a positive flower structure typical of a transpressional system. Evidence for strike-slip faulting is clear along the main active fault that ruptured in 1920 along the southern front, and much less along the other faults, although cumulative left-lateral offsets can be mapped along parts of the other faults (Figure 2; e.g., Tapponnier and Molnar, 1977; Deng et al., 1984; Burchfiel et al., 1991; Gaudemer et al., 1995; Su et al., 2019).
Additional faults cutting through the frontal alluvial fans can also be seen south of the main active fault associated to the trace of the Tertiary Haiyuan fault zone (Gaudemer et al. [1995]; Gansu geological Bureau, 1975, Geological map of Gansu province, 1:10000000, Geological press, Beijing). These faults affect the Late Quaternary sediments (Figure 3), attesting of recent activity, although cumulative offsets remain small and suggest that these faults only accommodate limited deformation.
Here, we focus our study on the southern main frontal fault bounding the Hasi Shan (Figure 3). The main fault shows clear evidence of cumulative motion, in addition to the 1920 earthquake displacement still visible as left-laterally offset alluvial fans and stream-beds. In many places, evidence of vertical displacement can also be found, as cumulative scarps across terraces, or in sections where the main Haiyuan fault is a north-dipping thrust with oblique slip.
The main active fault separates the uplifted Paleozoic bedrock (Silurian metasedimentary schists and Devonian coarse conglomerates) forming the core of Hasi Shan, to the north, from folded orange-yellow colored Neogene sandstones and conglomerates covered unconformably by white-grey Quaternary alluvial fans that form the apron of the mountain range (Figure 3a) (Gansu geological Bureau, 1975, Geological map of Gansu province, 1:10000000, Geological press, Beijing). These alluvial fans originate from the erosion products of the Hasi Shan that are directly deposited at the outlet of the local small catchments, which are on average 1.5 to 3 km in width and 3 to 4 km in length (Figures 2
and 3).
Because the range front is steep, the local rivers draining the Hasi Shan are deeply incised and outlets are most often characterized by narrow riverbeds with no, or limited, alluvial deposition upstream from the outlet. South of the range front, however, alluvial fans and terraces develop in a highly dissected bajada, which pattern could be partly controlled by
the underlying Neogene bedrock, resulting in numerous places in long narrow strips of alluvial terraces connecting to the local base level formed by the Huang He. Incision is strongly controlled by the size of the catchments of the individual streams, small catchments with less bedload will incise much deeper forming narrow valleys, while larger catchments with more sediments will incise less and abandon successions of terrace levels (e.g., Van der
Woerd et al. 2001). Overall, the best-preserved fans are located on the western part of the
Hasi Shan southern front, whereas the eastern piedmont is more degraded, consisting mainly of incised alluvial deposits and bedrock with few fan remnants (Figures 2 and 3).
3 Methodology
3.1 Image processing and offset measurements
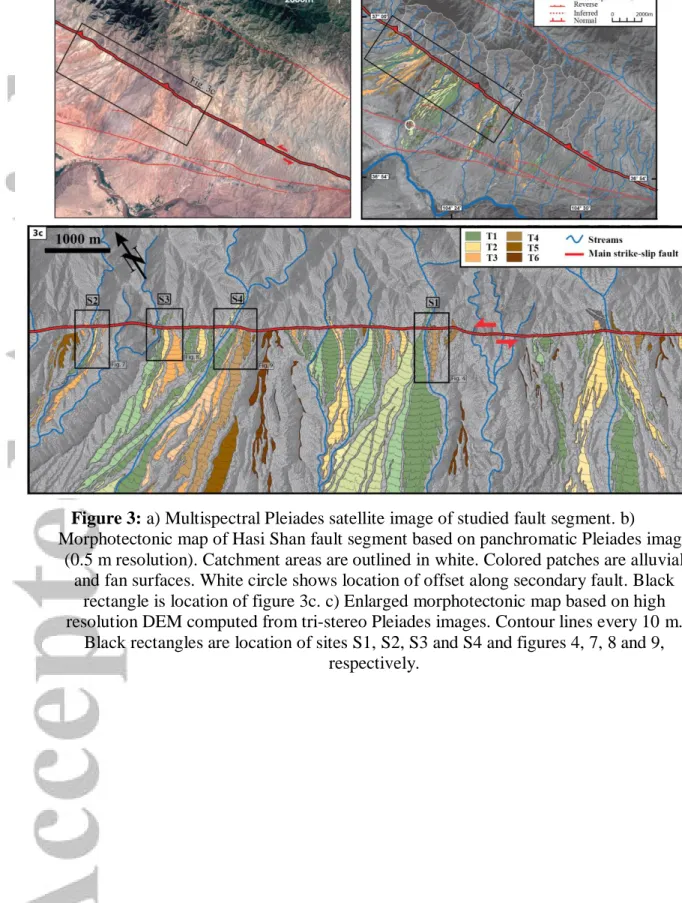
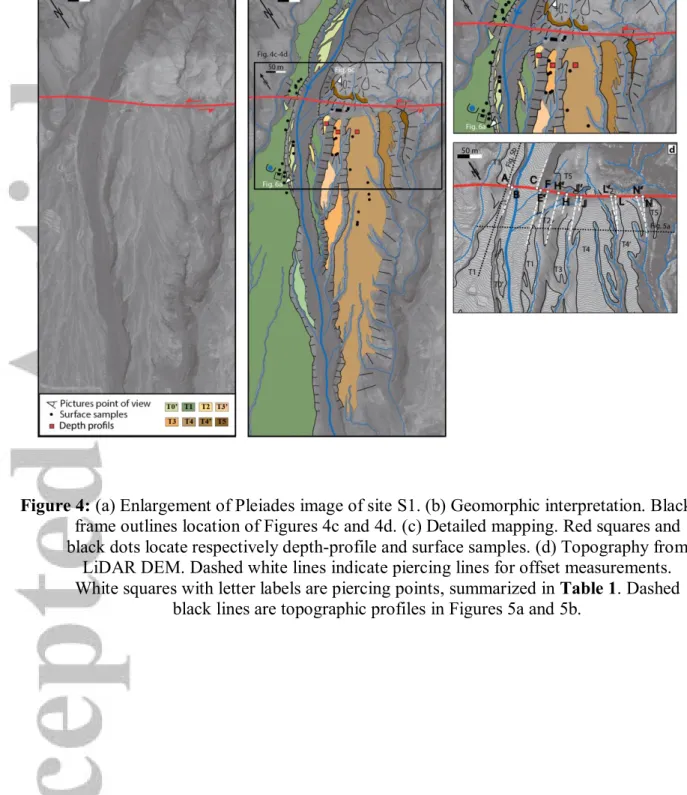
To document the morphology of the Hasi Shan front, we used high-resolution tri-stereo Pleiades images (0.5 m resolution). The images have a span of 20 km x 17 km, covering the entire southern front of the Hasi Shan. We computed a high-resolution DEM (resolution of 0.5 m per pixel, down-sampled to 2 m) using image correlation techniques and the free software package MicMac [Rosu et al., 2015]. The Pleiades images and the associated DEM were locally complemented by airborne Lidar data [Liu et al., 2013] centered on a chosen reference site (Figure 4a-d). These data allow constructing a local DEM with a centimeter ground resolution. These different datasets were used to map in details alluvial fans along the 20 km-long Hasi Shan fault section. Most of these fans are characterized by several levels of inset terraces (Figures 3a, b and c), which formed in response to the combined effect of incision and deposition, and fault activity [e.g., Bull, 1991; Sieh and Jahns, 1984; Weldon, 1986; Lasserre et al., 1999; Li et al., 2005; Van Der
Woerd et al., 2002]. Specifically, inset terraces are characterized by flat surfaces limited by
risers separating successive terrace emplacements.
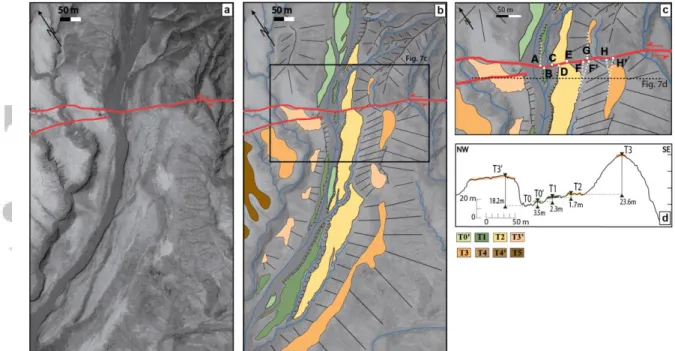
We chose a reference site S1 (Figure 3c) where the terrace morphology is nicely developed and where the river outlet is sharply defined. At site S1 we mapped the inset terraces using the high-resolution Lidar DEM and systematically measured offsets of the downstream terraces relative to the river outlet. Then, each terrace level has been dated (see next sections). Assuming similar climatic and tectonic processes along the entire Hasi Shan section, we used the sequence of terraces and risers identified at site S1 as a template to identify similar terrace sequences at three other catchments along the Hasi Shan.
Geomorphic offsets are measured by matching the risers of the same terrace on both sides of the fault. A terrace riser piercing point is defined as the intersection between the terrace riser and the mapped fault trace. However, risers are not always continuous to the fault trace due to post-depositional erosion or width of the fault zone. In addition, especially downstream from the fault, the river channel becomes wider and the riser is often not vertical. Thus, realigning the top or the base of the riser with its counterpart across the fault leads to differences (Figure S1) that are factored into the uncertainty attached to each measurement. Eventually, we define our preferred offset value as the projection of the best-preserved part of the riser into the fault trace. When the terrace is not preserved upstream, as it is the case for most of the terraces at site S1, instead we used the riser carved in the bedrock as an upstream piercing line. Because imagery and topography are at high-resolution, the main source of uncertainties in offset measurements comes from the identification of the different piercing points. Indeed, patterns related to fault scarp, riser geometry, and local erosion of terraces are considered when accounting for uncertainties (e.g, [Gaudemer et al., 1995; Gold et al., 2009;
3.2 CRN dating and age determination
Cosmogenic Radionuclide (CRN) dating is nowadays commonly used to infer the ages of alluvial terraces from surface and sub-surface samples in a wide range of tectonic and climatic contexts [e.g., Balco et al., 2008; Gosse and Phillips, 2001; Lal, 1991; Le Béon et
al., 2010, 2012; Van der Woerd et al., 1998, 2006; Anderson et al., 1996; Meriaux et al.,
2004; Repka et al., 1997; Hancock et al., 1999; Perrineau et al., 2011; Saint-Carlier et al., 2016; Guilbaud et al., 2017; Hetzel et al., 2013; Gold et al., 2015; Yang et al., 2018; Delmas
et al., 2018; Yang et al., 2019] . At site S1, we collected quartz-rich pebbles and cobbles from
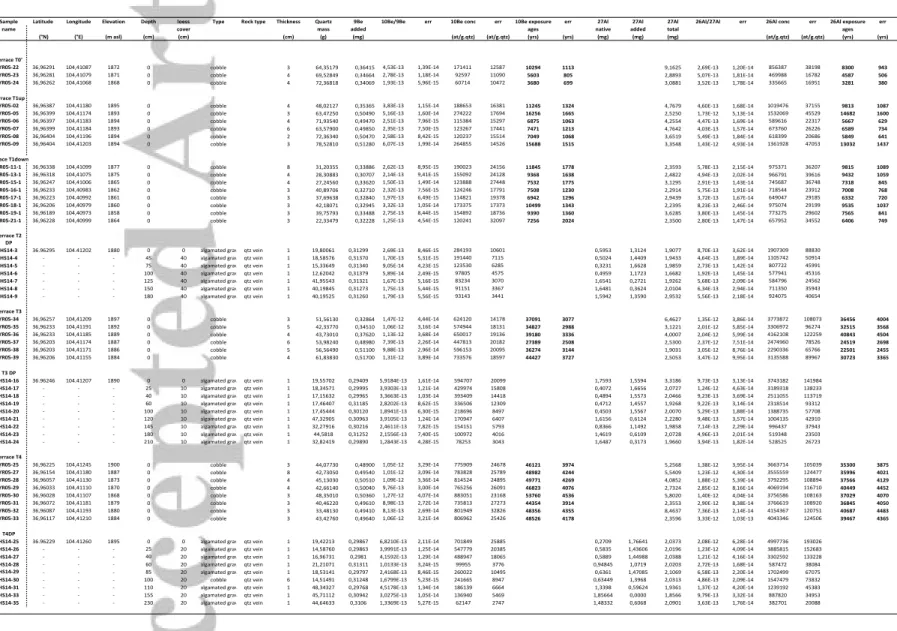
the terrace surfaces, and amalgamated quartz-rich gravel samples along depth profiles in 2-3 m-deep pits dug within the terraces to measure the concentration of 10Be and 26Al. The
concentration N for the radionuclide n can be calculated as a function of depth z (cm), time t (yr) and erosion rate ε (cm.yr-1) as written in Equation (1) (e.g., [Lal, 1991; Braucher et al.,
2003; Gosse and Phillips, 2001]):
𝑁𝑛(𝑧, 𝑡, 𝜀) = 𝑁0,𝑛𝑒−𝜆𝑛𝑡+ ∑ ( 𝑃𝑖,𝑛
𝜇𝑖𝜀+𝜆𝑛𝑒
−(𝜇𝑖𝑧). [1 − 𝑒−(𝜇𝑖𝜀+𝜆𝑛)𝑡])
𝑖 (1)
where i represents the different production pathways (neutron, muons), Pi,n is the
surface production rate at the sampling location for the radionuclide n via the production pathway i (in at.g-1.yr-1), λn is the decay constant for the radionuclide n (in yr-1) and μi the
absorption coefficient defined as the ratio of the density ρ (in g.cm-3) over the attenuation
length of the production pathway i Λi (in g.cm-2).
Samples were analyzed following the standard chemical processing from [Kohl and
Nishiizumi, 1992]. The CRN surface ages were calculated using the CRONUS-Earth
calculator v3, using the time constant scaling scheme “St” (Lal, 1991; Stone 2000) with a sea level high latitude production rate of 4.01±0.33 at/g/yr (Borchers et al., 2016; Balco et al., 2008](https://hess.ess.washington.edu/math/v3/v3_age_in.html) (Table 2). The CRN
sub-surface concentrations were modeled with relative contributions of 97.8%, 1.5% and 0.65% and attenuation lengths of 160 g.cm-2, 1500 g.cm-2, and 4320 g.cm-2 for neutron, negative
and fast muons, respectively [Braucher et al., 2003; Marrero et al., 2016; Balco, 2017] and a density of 2.2 for the lower conglomerate and a density of 1.4 for the loess top layer (Figure 10; Table 2)
Interpretation of surface and sub-surface sample concentrations and ages was done separately for both 10Be and 26Al nuclides. CRN concentrations were measured in surface and
sub-surface samples for 4 and 3 terraces, respectively (Figure 4, Table 2). Comparison between sub-surface model age and surface ages distribution helped assess the degree of post-depositional surface modification (e.g., [Ryerson et al., 2006; Saint-Carlier et al., 2016;
Delmas et al., 2018]). Indeed, classically, model exposure ages from surface samples are
interpreted as representing the abandonment age of an alluvial surface, meaning when the surface is no longer permanently flooded. Nevertheless, soon after abandonment, surfaces might still be occasionally over-flooded, leading either to redeposition of sediments or to partial erosion, which could alter the determination of the terrace age biasing it towards younger ages (erosion) or towards older ages (reworking of pre-exposed sediments).
4 Detailed morphotectonic analysis and offsets of inset terraces
4.1 Site S1 setting
Site S1 is located 36.96°N, 104.41°E, at an elevation of 1900 m, about 600 m above the Huang He riverbed (Figure 3). At site S1 a single 50 m-wide active streambed drains a 5 km2 catchment and has deposited a fan complex, which is about 400 m wide near its apex,
where it is cut by the fault (Figure 4). The most recent terrace (T1) is the only one that can be found both upstream and downstream from the river outlet, along the right (west) bank of the
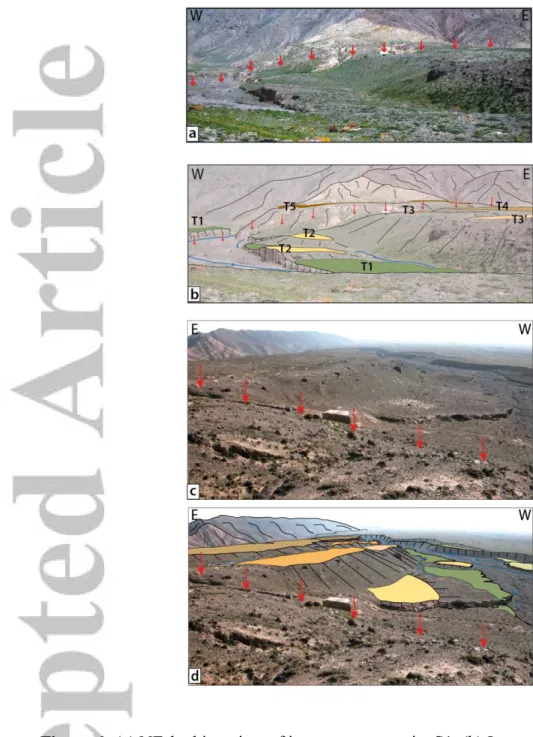
river. This terrace stretches for 7 km down to the Huang He (Figure 3b). The upstream left (east) bank of the stream is instead characterized by a steep bedrock riser. Downstream and on the left bank a swath of inset alluvial terraces covers an area about 1000 m long and 300 m wide (Figure 4). Hence, along the left bank we documented five main levels of terraces labeled T1 to T5, with T5 being the oldest. Several additional terrace sub-levels can also be recognized. T0 corresponds to the active streambed (Figure 4).
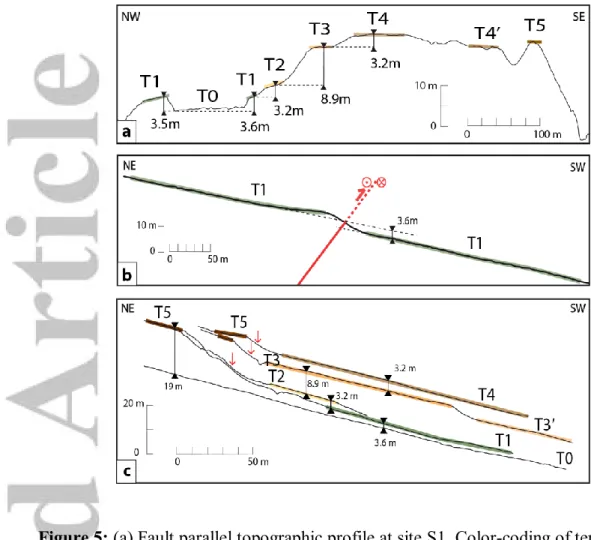
The terrace surfaces are narrow, ranging from 15 m to 120 m in width. The different terrace surfaces are separated by 3 to 9 m-high risers (Figure 5a). T1 is directly standing 3 to 4 m above the main streambed and the height of the riser T1/T0 is fairly constant downstream. T2 is preserved only in the form of two narrow patches, about 3 m above T1 (Figure 4c). Close to the river, one patch of T2 appears as a small remnant islet surrounded by T1 (Figure 6). Close to the fault trace, a piece of T2 is resting at the base of the riser T3/T2 (Figures 5 and 6). The riser T3/T2 is about 9 m high; it is the highest riser at site S1. Metric boulders are outcropping in the slope of the riser T3/T2 (Figure 6). T3 is sub-divided in 2 surfaces, separated by a sub-level T3' located 4 to 5 m below T3 (Figures 4 and 5). The best-preserved 120 m-wide terrace T4 on the left bank of the stream is separated from T3 by a 3 m-high gently sloping riser (Figure 5). East of T4 two additional terraces, T4’ and T5, are separated by risers of 3 and 5 m, respectively. Although these terraces are stratigraphically older than T4, they stand lower in elevation due to the convex shape of fan surfaces (Figure
5a). An even higher terrace level is also mapped as terrace T6, which remains only on narrow
crests. It is not preserved near the fault at site S1 but about 1 km downstream and stands about 80 m above T1 (Figure 3).
Upstream of the fault, along the left bank, we mapped a terrace remnant about 18 to 20 m above the active streambed (Figure 4). This surface corresponds to a strath terrace, which bedrock embankment can be seen in the riverbed. It is standing high above the active
stream, and higher than any downstream surface; we thus tentatively correlate it with T5, which is the oldest surface downstream (Figure 5c).
Along the right bank, the terrace T1 is the only terrace that is preserved, and it can be traced across the fault zone (Figure 4). Where the fault cuts through T1, a 4 m-high southwest facing scarp (Figure 5b) clearly indicates that this section of the fault has a vertical component, including during the 1920 earthquake, in addition to strike-slip.
At site S1, all terrace surfaces have similar compositions: they are paved with a mix of gravels, pebbles and cobbles embedded in a consolidated silty matrix, with very limited vegetation on top (Figures 4 and 6). No significant loess cover can be found on any of these terraces. Overall, the terraces are planar, sloping southwestward, and are only affected by regressive channel erosion. Recent anthropic modification of the surfaces is limited (Figure
4).
4.2 Offsets at site S1
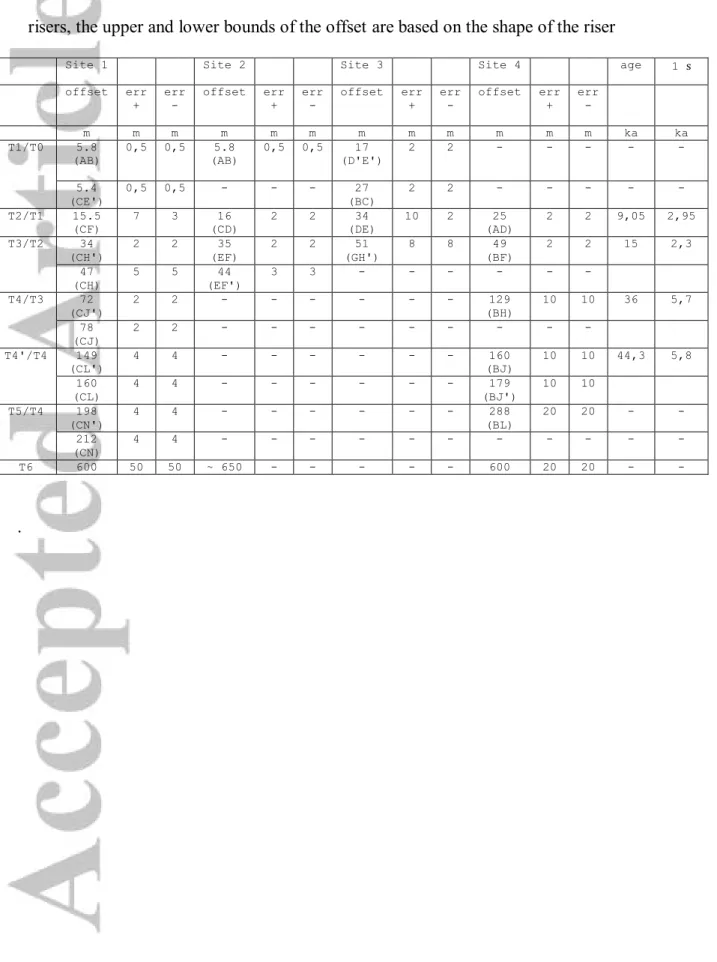
As described above, only terrace T1 on the right bank can be traced across the fault at site S1. Using satellite imagery and topographic data, we could measure an individual horizontal offset of 5.8 ± 0.5 m for the riser T1/T0 (Figure 4d). It is the smallest offset measured at this site and it must thus correspond to the co-seismic offset of the 1920 rupture (M~8.3). This offset measurement is in agreement with a co-seismic slip of 4 ± 2 m inferred for the 1920 earthquake rupture along the Hasi Shan segment by [Ren et al., 2016], using field measurements and LiDAR data, suggesting that no significant erosion occurred since 1920 at that site.
Along the left bank of the stream, no terrace deposits are preserved upstream of the fault, whereas all the offset risers are located along the downstream left bank of the stream.
Therefore, we used the eastern side of the upstream channel located at the base of the bedrock riser of T5 as the position of the various risers at time of formation. We assume that this rocky riser has not been significantly eroded during the time spanning the emplacement of the inset terraces. Indeed, we cannot exclude that at the time of their emplacement, each terrace would have had a matching part upstream that was later eroded. Hence, all cumulative offsets measured relative to this piercing point upstream have to be considered as minimum offsets (e.g., [Meriaux et al., 2012]). Downstream, all terrace risers have a curved shape. Terraces T2, T3 and T4 curve eastward towards the fault trace, whereas terraces T4’, and T5 curve westward. Although these different patterns might result from meandering, we cannot rule out that they might result instead from post-deposition modification, and it has to be considered during the offset measurements [Cowgill, 2007].
Similarly to T1/T0 along the right bank, the offset of T1/T0 along the left bank is 5.4 ± 0.5 m, pointing to an individual co-seismic event offset as well. This is the smallest offset measured at site S1. As the southern bench of T2 appears to be an isolated remnant of the surface, surrounded by T1, we used instead the northern strip of T2 located at the foot of T3/T2 riser nearby the fault trace to define the T2 piercing line. T2 is the smallest terrace remnant at site S1 and its lower riser T2/T1 presents a smooth and low-angle slope difficult to detect on satellite images. However, T2/T1 is well defined on the DEM (Figure 4d) and on topographic profiles (Figure 5a). The terrace seems to become narrower southward, suggesting that this riser might have been partly eroded away. This geometry of the riser induces uncertainties on the offset measurements. Our best reconstruction yields an offset of 15.5 +7/-3 m. Riser T3/T2 is fairly straight and parallel to the present streambed, except close to the fault where the riser veers to the east. If we assume local erosion or human activity to explain the riser veering towards east, projecting the well-defined straight riser onto the fault trace yields an offset of 34 ± 2 m. If the riser’s shape is depositional, then a larger offset
value of 47 ± 5 m for riser T3/T2 is estimated. Similarly, the riser T4/T3 curves eastward near the fault, inducing uncertainties on the offset measurements. Considering the projection of the straight part of the riser far from the fault towards the fault trace, it yields an offset of 72 ± 2 m. Considering the closest point of the curved riser near the fault trace as piercing point instead, it yields an offset of 78 ± 2 m. Riser T4’/T4 does not reach the fault trace and veers westwards. Our best reconstruction for T4’/T4 yields 153 ± 4 m. Similarly, riser T5/T4’ veers towards west, and yields and offset of 198 ± 4 m. Although T6 is not reaching the fault trace, the projection of its position yields a loosely constrained offset of 600 ± 50 m (Table
1).
4.3 Additional sites
In addition to site S1, we mapped in details three other sites along the southern Hasi Shan front. These three sites were correlated with site S1, our reference site, based on similarities in morphology. A reference marker is the 9 m-high riser T3/T2 at site S1, which is significantly higher than the other ones at the same site. We interpret the larger height of this riser as the indication that it formed in response to some noticeable climatic fluctuation. Similarly, the terrace T6, which stands much higher than all other terraces might also be used as a characteristic marker of a significant climatic imprint. Thus, because such climate fluctuation should affect all other catchments along the Hasi Shan as well, similarly larger risers should be found at the other sites with similarly sized catchments, which should be coeval with risers T3/T2 or T6/T5 at site S1. In the following we describe sites S2, S3 and S4 (Figure 3c) that present the clearest patterns of inset terraces similar to site S1. Table 1 summarizes the offset measurements at all sites.
Site S2 is the westernmost fan complex along the Hasi Shan section. It is located 5.5 km northwest of site S1, at an elevation of 1700 m. At site S2, the narrow alluvial terraces extend for 2 km with a maximum width of 350 m near the fault trace. Along the left bank, we mapped three levels of terraces T1, T2 and T3 (Figure 7). Unlike site S1, remnants of the terraces are preserved both upstream and downstream of the fault. The offset of T1 is 5.8 ± 0.5 m, consistent with a single co-seismic displacement [Ren et al., 2016]. The riser T2/T1 is reaching the fault trace on both sides of the fault and is offset 16 ± 2 m. However, a small rill is incised between T1 and T2, potentially eroding riser T2/T1 upstream, and therefore yielding only a minimum offset. The riser T3/T2 is quite linear, and the projection of the straightest part of the riser into the fault trace yields an offset of 44 ± 3 m. However, similarly to site S1, the riser T3/T2 curves westward close to the fault, hence yielding a smaller offset of 35 ± 2 m. The riser T3/T2 is the highest riser at that site, about 20 m, and is interpreted as corresponding to the similar high riser at site S1. The difference in absolute height between risers for the various fans and corresponding catchments may result from differences in the local characteristics of the drainage basins (e.g., [Van der Woerd et al., 2001]). Thus, only relative heights between risers at a same site are used to match the terrace pattern at each site with the terrace pattern at the reference site. Terrace T6, like at site S1 is visible further southwest, about 1km away from the fault trace on a narrow crest. Projecting its position on the fault trace yields a loosely constrained offset of 650 m (Figure 3).
Site S3 is located 4.5 km northwest of site S1, at an elevation of about 1850 m (Figure 3c). The 20 m-wide main active stream is narrow and incises 20-25 m in the piedmont (Figure 8). The strong incision of the active stream can be explained by the position of the catchment just east of a 180 m-deep incision, which has captured the main stream, strongly lowering the present catchment base level as compared to the average elevation of the abandoned terraces (e.g., [Van der Woerd et al., 2001]; Fig. 3). We mapped
three main levels corresponding to terraces T1, T2 and T3 similar to site S1. All three levels are preserved on both sides of the fault. The geometry of site S3, however, is more complex than the other sites because surfaces are more incised, with several streams separating remnants of terraces. The main active stream is 20 m below T1, therefore we can assume T1 has not been flooded since its deposition. T1 is offset by 17 to 27 m. Upstream of the fault, T1 is laying directly below T3. T2 seems to have been eroded, with only a small remnant surface preserved close to the fault trace. We assume T1 upstream to be laying on top of a bulge of bedrock because the stream between T1 and T3 is deviated westward close to the fault trace due to harder material difficult to erode (Figure 8b and c). Our reconstruction yields a riser T2/T1 offset of 34 +10/-2 m. Upstream of the fault, T3 is a narrow surface that does not reach the fault trace. T3 downstream of the fault veers westward close to the fault trace. Our best reconstruction for riser T3/T2 yields an offset of 51 ± 8 m.
Site S4 is located 3.2 km northwest of site 1 at an elevation of 1870 m (Figure 3c). The terraces reach the Huang He riverbed 5 km southwest of the apex of the fan. The characteristic riser T3/T2 is very clear at site S4, despite the fact that preserved remnants of T2 are scarce. Along the right bank, no terraces are preserved near the fault zone (Figure 9). A right step in the fault trace forms a local push up on the left bank, complicating the reconstruction of the different terraces across the fault. T1 is not preserved upstream of the fault. Therefore, we measured the offset between T2/T1 downstream of the fault and T2/T0’ upstream of the fault. It yields an offset of 25 ± 2 m. T2 and T3 are preserved both upstream and downstream of the fault, although T2 consists of two narrow stripes close to the fault. Our reconstruction yields an offset of 49 ± 2 m for riser T3/T2 offset. T4, T4’ and T5 are not preserved upstream of the fault. Similar to site S1, we matched the risers of T4, T4’ and T5 downstream of the fault with the main preserved riser upstream of the fault (T3/T2), therefore yielding minimum offsets. We measure minimum offsets of 129 ± 10 m for T4/T3, 160 to
179 m for T4’/T4, and 288 ± 20 m for T5’/T4’. Similar to sites S1 and S2, a large remnant of terrace T6 limits the terraces of site S4 to the east. Here, terrace T6 reaches the fault trace and defines a well constrained offset of 600 ± 20 m (Figure 3c).
5 CRN Exposure Dating at site S1
The well-preserved and planar inset terraces at site S1 were targeted for sampling. Overall, erosion of the terraces is limited to regressive channels (Figure 6) that leave large patches of terrace surfaces unaffected by post-deposition modification. Hence, we can assume that erosion has limited impact, if any, on the calculated exposure ages. Similarly, although the lower terrace T2 is partly covered by a thin veneer of loess (30-40 cm), most of the terraces have no significant loess cover that would affect the exposure age determination (Figure 6).
We collected a total of 28 quartz-rich well-rooted pebbles and cobbles ranging from 2 cm to 10 cm in diameter on the surfaces of T1, T3 and T4 (black dots on Figure 4) and we excavated three ~2 m-deep pits in T2, T3 and T4, to collect samples for depth-profiles (red squares in Figure 4). In each pit, we sampled 7 to 9 layers every 25 cm to 30 cm of amalgamated samples composed of 30 to 50 quartz-rich gravels (Figure 10).
We analyzed both 10Be and 26Al for all our samples (Table 2). Overall, there is a fair
agreement between 10Be and 26Al data, except for terrace T4 for which surface samples show
lower 26Al concentrations (about 20% on average) (Figures 10 and 11). Two samples in the
deepest part of the depth profile in T2 have significantly high 26Al/10Be ratios of 7.8 and 9.92
and were not considered for the age modeling. We observe an overall agreement in 10Be and
26Al concentrations between the surface and the sub-surface samples, which favors similar
cobble/amalgamated gravels) and size differences (5-10 cm/less than a few cm)(Figure 10). We analyze the overall agreement between 10Be and 26Al data as a validation of the dating
method.
We modeled the 10Be and 26Al concentrations in the 3 depth profiles assuming no
erosion as the terraces show post-depositional silty loess accumulation. As the loess is thin (<40 cm) we model the depth profiles as static 2 layers deposits of density 1.4 for loess and 2.2 for the underlying conglomerate (e.g., Perrineau et al., 2011; Yang et al., 2019). A global mean Sea Level at High Latitude (SLHL) spallogenic production rate of 4.01±0.33 at/g/yr for
10Be (Borchers et al., 2016) and a 26Al/10Be spallogenic production ratio of 6.61 (Braucher et
al., 2011) are used to scale the local production rates. The best fit to the samples is obtained by chi-square minimization following the method described in Yang et al. (2019) (see also,
Hidy et al., 2010; Borchers et al., 2016; Saint-Carlier et al., 2016; Delmas et al., 2018). The
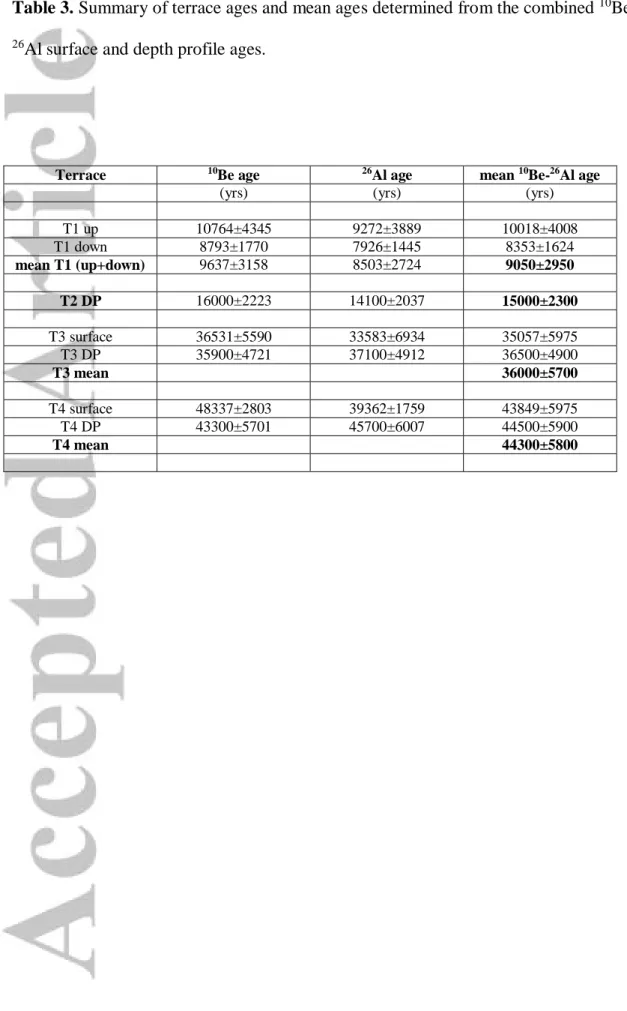
range of solutions obtained is a proxy for the 1-sigma confidence level based on analytical uncertainties, which represent internal uncertainties (Figure 10; Table 3). We propagated errors on these solutions corresponding to production rate (8.22%), radioactive constant (7%) and density (10%) errors to estimate external errors (Figure 10). The best models with no erosion yield ages for T2, T3 and T4 of 16 ± 2.2 kyr, 36 ± 5 kyr and 43 ± 6 kyr and 14 ± 2 kyr, 37 ± 5 kyr and 46 ± 6 kyr for 10Be and 26Al, respectively. Inheritance is relatively small
and represents less than 10% of the cosmogenic isotope concentration at the surface. Because the distributions of 10Be and 26Al concentrations from the surface samples for terraces T3
(n=6) and T4 (n=8) are in the same range of the best fitting model of the sub-surface concentrations for these terraces (Figure 11), we are confident that our assumption about minor surface modification is correct and that no major bias is expected from the ages of the surface samples. This observation also suggests that inheritance of the surface samples might be on the same order, also impossible to estimate quantitatively for each individual sample.
The CRN model ages of the surface samples (Figure 11, Table 2) are thus calculated assuming no erosion.
Among the 14 surface samples collected on T1, 6 samples were collected from the stretch of T1 located upstream of the fault, and 8 from downstream of the fault (Figure 4). The 10Be and 26Al model exposure ages range from 5.7 ± 0.6 kyr to 16.2 ± 1.6 kyr (Figure
11, Table 2). Although two samples YR05-05 and YK05-09 are much older than all the
others, with ages similar to the higher terrace T2 just above, we calculate the mean age of terrace T1 from the whole set of samples. Although the spread of ages is larger upstream than downstream, the upstream samples average age of 10.0±4.0 kyr is close to the downstream samples average of 8.4±1.6 kyr, confirming that they belong to the same terrace (Figure 11). Overall, on T1 the mean exposure age, estimated as the average of the bounds at the one-sigma level of the summed distribution (e.g., Daeron et al., 2004), is 9.1 ± 2.9 kyr.
We did not collect samples from the surface of T2, as surficial rocks seem to have been moved around by local shepherds. Instead, we excavated a 2 m deep pit (see position in
Figure 4) and collected 7 amalgamated samples from the surface (0 cm) down to a depth of
180 cm. Figure 10a shows the CRN concentrations with depth. 5 samples out of 7 fit a model assuming no erosion. The two deepest samples (HS14-8 and HS14-9) have higher CRN concentrations, with more discrepant 26Al and 10Be concentrations that may indicate a more
complex exposure history, they are thus not included in the model calculation. The depth-profile models yield exposure ages for T2 of 16.0 ± 2.2 kyr and 14.1±2.0 kyr for 10Be and
26Al respectively. The average of these two estimates, calculated similarly to T1, is 15.0±2.3
kyr (Figures 10 and 11).
We collected 6 samples on the surface of T3 on its highest part along the top of riser T3/T2 and excavated a 2.3 m deep pit in the center of surface T3 to retrieve 9 amalgamated
distributions of 10Be and 26Al concentrations of the surface samples are close to the best
model fitting the sub-surface samples indicating minor surface modification (Figure 10b). The 6 surface sample ages scatter from 24 to 44 kyr with a mean age of 35 ± 6 kyr (Figure
11). Two samples (YR05-38 and 39) have discrepant 26Al and 10Be concentrations (>30%),
leading us to exclude the 26Al data for these two samples (Figure 11). Overall the average of
the surface ages (35±6 kyr) are consistent with the average age of 36 ± 5 kyr modeled for the subsurface samples, leading to a terrace T3 mean age, calculated like for terrace T1,of 36±6 kyr (Table 3; Figures 10b and 11).
On surface T4 we collected 8 embedded cobbles and 8 gravel amalgams in a pit from the surface down to 230 cm deep (Figures 4 and 10c). The pattern of 10Be and 26Al
concentrations of the surface and sub-surface samples is similar to that of terrace T3 and thus indicates again minor surface modification (Figure 10c). The 8 surface sample ages range from 37 to 53 kyr with a mean exposure age of 44 ± 6 kyr, excluding 4 discrepant 26Al ages
(Figure 11). Overall the surface ages are consistent with the age of 44 ± 6 kyr modeled for the subsurface samples, leading to a mean age for terrace T4, calculated like for terrace T1, of 44 ± 7 kyr (Table 3; Figures 10c and 11).
In summary the 56 samples analyzed at site S1, 31 from the surface and 25 from the sub-subsurface constrain the ages of T1, T2, T3 and T4 to be 9 ± 3 kyr, 15 ± 2 kyr, 36 ± 6 kyr, and 44 ± 7 kyr, respectively. These ages are consistent with the emplacement scenario of the terraces: their ages increase both with their heights above the present stream and the closest terrace to the active stream is the youngest and the farthest to the east is the oldest, as expected for progressive left-lateral movement along the Haiyuan fault.
6 Interpretation
The terraces and fans along the southern front of the Hasi Shan are typical debris-flow deposits formed in response to changes in climate and particularly to the alternating phases of warm/wet and cold/dry periods characterizing semi-arid to arid areas of central Asia [Avouac
et al., 1993; Hetzel et al., 2002; Meyer et al., 1998; Peltzer and Tapponnier, 1988; Van Der Woerd et al., 2002]. In particular, the transitions from glacial to interglacial periods, like the
last one from LGM (20 ka) to Holocene (10 ka), or the penultimate one from the penultimate glacial stage MIS-6 (150 ka) to the interglacial stage MIS-5e (125 ka), are widely recognized as major periods of sediment mobilization from the catchments (glaciated or unglaciated) to the piedmont, strongly impacting the landscape with wide and thick alluvial fan deposits [Chevalier et al., 2005; Peltzer and Tapponnier, 1988; Poisson and Avouac, 2004]. In general, the climate changes following deglaciation are less important and spatially restricted with the formation of successive inset terraces [Bull, 1991; Meriaux et al., 2005; Van der
Woerd et al., 2001; Van Der Woerd et al., 2002]. Interestingly, at site S1, the ages of the
terraces follow the global climate changes as recorded in Oxygen isotopes variations (e.g. [Lisiecki and Raymo, 2005]). The ages of T4, T3, and T2, correspond almost exactly to the MIS stages 3c, 3a and the transition from MIS-2 to 1, with T1 corresponding to the first half of the Holocene, including the Holocene optimum [Rosenthal et al., 2013]. The highest terraces T5 and T6, recognized all along the piedmont, may thus correspond to the various phases of the last major interglacial, namely MIS-5e (125ka) and following (MIS-5a and 5c). As discussed above, along the Hasi Shan, one preeminent geomorphic feature in each catchment is the riser T3/T2, which is systematically higher than any other risers in that same catchment. The formation of this riser is bounded by the ages of terraces T2 and T3, which are respectively 15 ± 2 kyr and 36 ± 6 kyr. The latter age corresponds to MIS-3a, the last warm/wet period before the last Glacial Maximum (LGM, 20ka), and the former age
corresponds to the end of the dry/cold LGM and the return to the warm/wet period of the Holocene. Hence, we may assume that terrace T3 has been abandoned and incised during the climate shift to the glacial period leading to the LGM. Then, during the transition from the dry glacial period to the wet and warm interglacial period, marked by increased runoff and erosion, the riser T3/T2 was reshaped together with T2 emplacement. Less dramatic climat ic changes during the Holocene may have only partially modified the risers with the lower terrace emplacements.
The morphology of alluvial deposits studied along the Hasi Shan fault section shows clear evidence of late Pleistocene and Holocene fault activity. However, deriving slip rates using offset alluvial terraces and associated ages requires carefulness (e.g., Sieh and Jahns, 1984; Weldon et al., 1985; Peltzer et al., 1988b; Van der Woerd et al., 2006; Behr et al., 2010). The main assumption relates to the association of in most cases a terrace deposit age with an offset that accumulated during and/or after the terrace formation. More commonly, the dated feature is the alluvial terrace, whereas the measured offset feature is an adjacent lower or upper terrace riser. Direct dating of a terrace riser would be very challenging, as risers are non-flat transient morphological features with different evolutions regarding to their location - upstream or downstream of the fault – right or left bank of the active stream [e.g.,
Meriaux et al., 2012; Cowgill, 2007; Gold et al., 2009]. If the active stream is powerful
enough, the active riser (i.e. the riser just above the active stream-bed) is continuously refreshed and laterally eroded, preventing any offset record. Therefore, a terrace riser becomes a passive marker and records cumulative offset only when the terrace at its base is abandoned, during a subsequent incision episode. In this case, the age of a terrace riser is defined by the surface exposure age of the lower terrace, hence yielding a minimum age for the riser and a maximum slip rate (e.g., [Van Der Woerd et al., 1998, 2002]).
These considerations naturally only apply on the long-term in case of intermittent stream in arid areas. Strong floods in the active river bed occurring only from time to time, co-seismic offset might be preserved over a certain period of time. This is probably the case at our sites. Indeed, the lower riser (T1/T0) still preserves an offset of about 6 m (5.8 ± 0.5 m) that we link to the last large earthquake occurring along this segment of the Haiyuan fault, namely, the 1920 magnitude M8 earthquake [Ren et al., 2016]. This observation is consistent with the average recurrence time for such large earthquake that has been estimated to reach several centuries (600-650 years, Liu-Zeng et al., 2007). If T0 remains the active river-bed for the next half millennia it is highly likely that the 6 m offset will be eroded away until the next large event.
Using the “lower terrace” assumption and only considering the offset measurements and CRN dating at site S1, we used either the smaller or the larger offsets and related uncertainties to determine respectively the lower and upper bounds of the slip rate. In the case of the riser T2/T1 the same value was used in both calculations. In each case, the slip rate was determined following a Bayesian approach following Styron [2015] with 5000 iterations. Uncertainties for offset were defined as a preferred value associated to a minimum and maximum possible offset. The probability of occurrence of offset value during the Bayesian process decreases linearly from the preferred value to zero at the extrema. For the ages, uncertainties are considered as following a normal distribution with a standard deviation derived from the age calculation. Hence, the minimum and maximum slip rates along the Hasi Shan fault strand, based on our measurement at site S1, are respectively 2.7 mm/yr and 3.0 mm/yr (Table 1 for summary of offsets and associated terrace ages. See also Figure S2). However, as mentioned previously, offset measurements at site S1 yield only minimum offset values, as part of the cumulative displacement is probably missing upstream of the fault.
Hence, the rates derived only from offset measurements at site S1 yield minimum values of slip rates.
We measured offsets at three other sites (sites S2, S3 and S4) where we identified patterns of inset terraces similar to site S1, using riser T3/T2 as a stratigraphic and chronological reference (Table 1). We found good consistency of offsets between sites S1 and S2. At site S3, the T3/T2 offset is consistent with the upper bound of T3/T2 offset at site S1. In addition, the T1/T0 and T2/T1 offsets at site S3 are larger than T1/T0 and T2/T1 at site S1. As mentioned above, the main stream at site S3 is deeply incised. Therefore, we can assume that the active river does not reach the terrace or the riser anymore, hence protecting the terraces from erosion and preserving them. At site S4, T2/T1, T3/T2, and T4’/T4 offsets are consistent with the upper bounds of the offsets at site S1. The offset T4/T3 at site S4, although consistent with all other offsets measured at the different sites, is larger than similar offset at site S1, however, emphasizing that site S1 might yield only minimum offsets. Thus, using terrace matching from site to site, we associated the ages of terraces at site S1 with the matching terraces of the other sites, and derived slip rates including all the offsets measurements. Because for the different offset risers at each site the determination of offset is not necessarily unique, in our determination of slip rate we have considered two end-member models: In one case we have systematically chosen the smallest offset determinations, and in the other case we chose the largest offsets. In both cases we also have considered uncertainties attached to each offset and age in our estimate of the slip rate. Hence, as for site S1, we followed a Bayesian approach and used the slip-rate calculator by [Styron, 2015] with 5000 iterations. Uncertainties were processed as described for site S1 alone. It yields maximum and minimum slip rates for the main strand of the Haiyuan fault, south of the Hasi Shan, which are respectively 3.32 ± 0.21 mm/yr and 3.1 ± 0.2 mm/yr over 50 kyr (Figure
12). It is worth noting that these two slip rates are actually undistinguishable, emphasizing the
need to correctly incorporate uncertainties in such calculation.
Our average slip rate of 3.2 ± 0.2 mm/yr compares well with the lower bound of slip rates obtained by other groups along adjacent fault sections, although these rates are mostly determined over the Holocene, and the quality of rate determination is variable depending on each study (Table S1). Immediately east of the Hasi Shan, Li et al., [2009] derived a Late Quaternary slip rate of 5.0 ± 2.5 mm/yr from offset stream valleys and 14C dating (Figure 1).
Further east along the Haiyuan fault, the same authors derived Late Quaternary slip rates from offset terraces and stream valleys, and 14C dating (Figure 1) of 4.2 ± 0.8 mm/yr and 4.5
± 0.7 mm/yr. Along the same segments east of the Hasi Shan, Zhang et al. [1988] derived an average Holocene slip rate of 8 ± 2 mm/yr from offset streams and 14C dating, with lower
bounds between 3.4 ± 0.7 mm/yr and 4.1 ± 0.4 mm/yr.
Short-term slip rates derived from geodesy also show consistent values in the vicinity of the Hasi Shan: GPS data yield slip rates of 2.0 to 3.2 mm/yr [Gan et al., 2007] and 3.6 ± 1.4 mm/yr to 4.2 ± 1.5 mm/yr [Zheng et al., 2013]. Similarly, InSAR studies yield slip rates of 4.3 ± 1.0 mm/yr [Daout et al., 2016], 5.0 ± 1.0 mm/yr [Jolivet et al., 2012] and 6±2 mm/yr [Cavalié et al., 2008] just west of the Hasi Shan.
In addition to the horizontal slip rate, evidence for vertical motion along the Hasi Shan section of the Haiyuan fault is also visible. At site S1, the upstream and downstream parts of terrace T1 on the west bank of the active stream are separated by a southwest facing fault scarp about 3.6 ± 0.3 m high (Figure 5). Just above the fault trace, T1 is sub-horizontal (slope ~2°) for a few tens of meters, whereas the average slope of the terrace is 5-6°. This bulge is likely to be a local effect related to the geometry of the shallow fault that might become steeper when it comes close to the surface. As presented earlier, we constrained an
This uplift rate is consistent with the fact that the fault strike veers southward in the vicinity of the Hasi Shan, from 104°N west of the range to 120°N east of the range. This drastic shift of 16° over a distance of 35 km leads to oblique slip mixing parallel shearing and fault-normal shortening, resulting in a transpressional structure with basement thrusting over Quaternary deposits (Figure 13). This uplift of the Hasi Shan would be consistent with the shortening observed by geodetic studies across the Haiyuan fault system [Daout et al., 2016;
Gan et al., 2007]. This combination of strike-slip and thrust motion defines the Hasi Shan as
a significant restraining bend along the Haiyuan fault, similar to the Mont Lebanon along the Levant left-lateral strike-slip fault [Daëron et al., 2007; Goren et al., 2015], and to the “Big Bend” of the San Andreas right-lateral strike-slip fault [Eberhart-Phillips et al., 1990], although at a smaller scale.
7 Discussion
Complex fault systems with splays or intersecting faults have been documented to show potential slip variations with time, as slip might switch from one fault to the other (e.g., [Bennett et al., 2004; Dolan et al., 2016; Friedrich et al., 2003; Gold et al., 2017]). The central Haiyuan fault, with its two sub-parallel fault strands, the main central Haiyuan fault and the Zhongwei fault, may display such behavior. However, the geological slip-rate along the Haiyuan fault determined in this study for an unusually long time period, from Holocene (9 kyr) to mid- Pleistocene (50 kyr), indicates a fairly constant slip-rate with time. At our reference site, these rates are respectively 1.9 ± 0.6, 2.7 ± 0.5, 2.0 ± 0.25 and 3.5 ± 0.4 mm/yr over time periods of 9.1 ± 2.9, 15 ± 2, 36 ± 6 and 44 ± 6 kyr. In addition, although without direct dating in this study and based on similar reasoning as we used for other markers about
the correlation between large risers and change in climatic condition, we could infer that T6, the highest terrace remnant in each catchment, which is offset about 500-600 m, formed during the penultimate glacial-interglacial transition (MIS-6 to 5e at 150-125 ka). Such assumption yields a slip rate of 4 ± 0.7 mm/yr in keeping with the other rates.
Hence, our results suggest that the slip rate does not vary significantly over long periods of time that can extend at least over few tens of 1000s of years. Consistency of the geological slip rates with slip rates derived from short-term spatial geodesy also suggests that even at the time scale of the earthquake cycle, the slip rate is likely to not show large variations [Meade et al., 2013; Hetzel et al., 2019].
Overall, despite some inconsistencies between different rates published by different groups (see summary in previous sections and Table S1), a coherent picture emerges from the various slip-rate determinations, including the one proposed in this work: The horizontal slip rate along the Haiyuan fault is faster along the western section of the fault than along the central section. Even along the central section, the eastern part of the fault, along the Hasi Shan seems to be slower than the western part. Such apparent fading of the horizontal slip rate along the main strand of the Haiyuan fault has been used as an argument to suggest that localized deformation progressively disappears, when moving eastwards along the Haiyuan fault, to the benefit of distributed deformation [Duvall and Clark, 2010]. Alternatively, we suggest that this apparent decrease of localized deformation results from the spread of the finite deformation associated to the Haiyuan fault over multiple fault strands in the area of the Hasi Shan. Such distribution of deformation over several faults makes it more difficult to constrain individual rate with GPS due to superimposition of the elastic contribution of each fault over large distances (see for instance, similar discussion about rate distribution along the southern San Andreas fault system and Eastern California Shear Zone [e.g., Bennet et al., 2004 ; van der Woerd et al., 2006]).
As described earlier in this work, the main Hasi Shan fault strand is moving horizontally at 3.2 ± 0.2 mm/yr. At least one secondary strike-slip fault strand cuts across the southern Hasi Shan bajada (Figures 2 and 3). This fault, that separates lower, to the north, from upper, to the south, Pliocene conglomerates [Pan et al., 2004], is clearly active as it cuts and offset a surface that can be traced upstream to be T1 at site S1 (Figure 3b). Two additional secondary strands are also visible to the north. One strikes across the middle of the Hasi Shan range, underlined by a gouge zone separating Silurian metasediments to the south from Devonian conglomerates to the north at the base of steep facets. The other one follows the northern rim of the northern Hasi Shan range, as a steep thrust between the deformed Devonian conglomerate overthrusting steeply south dipping Miocene conglomerates, itself overthrusting Pliocene sediments (Figure 2). Although the quantification of slip rate for these secondary structures goes beyond this work, their clear traces in the morphology and across Quaternary deposits, indicate that they are active faults. Indeed, they are indicated as such on the regional geological map [Pan et al., 2004]. Based on comparison between the slip rate we obtain along the Hasi Shan and the slip rates available both west and east of the Hasi Shan (Figure 1, Table S1), together these secondary faults might accommodate up to 1mm/yr. Thus, put together, the different fault strands of the Haiyuan fault at the Hasi Shan yield a minimum total slip rate of 4 to 5 mm/yr, not even accounting for the vertical deformation. This rate should then be added up with the horizontal slip rate estimated for the Zhongwei fault strand, ranging between 1 mm/yr and 2 mm/yr, which is accommodating another part of the total budget of deformation across the Haiyuan fault system (Figures 1 and 14), yielding to a total slip rate across the Haiyuan fault, at the longitude of the Hasi Shan, of 5 to 7 mm/yr. This is consistent with the total slip rate of 8.0 ± 1.3 mm/yr estimated from geodesy across the entire Haiyuan fault system [Daout et al., 2016] and it demonstrates that the amount of
slip accommodated by localized faults along the Haiyuan fault system does not significantly decrease eastward when the fault system is fully considered.
Our result shows the importance of encompassing the full geometry of the fault system when considering the rate of deformation, as ignoring slip distributed on additional fault strands to the main strand might lead to erroneous conclusion of major slip-rate variation along strike for a single fault, which is indeed hardly sustainable when considering realistic physical deformation processes.
Acknowledgements:
We thank the associate editor and an anonymous reviewer for their insightful comments that greatly improve this manuscript. We are grateful to René Boutin at Laboratoire d’Hydrologie et Géochimie de la Surface and ASTER Team (G. Aumaître, D. Bourlès, and K. Keddadouche) at ASTER-CEREGE for ICP-AES and AMS measurements, respectively. Part of this work was supported by INSU-CNRS, France and the University of Strasbourg, J. Van der Woerd for the Al and Be concentration analyses at LHyGeS and IPGS, and for 10Be/9Be and 26Al/27Al ratios measurements on the Aster AMS facility (GEREGE,
Aix-en-Provence, France) supported by INSU-CNRS and IRD. We thank Yang Ye for his help with the chi-square modeling of the depth profile data and A.S. Mériaux for her help with error propagation and mean age calculations. Part of this work has been supported by the CNRS PICS program France – Chine.
All slip-rate data discussed in the paper, but the ones derived in this study, are extracted from the published literature listed in the reference list. Pleiades imagery is available for purchase from Airbus industry (https://www.intelligence-airbusds.com/en/8692-pleiades).
This is IPGP contribution ###
References
Anderson, R., J. Repka, and G. Dick (1996), Dating depositional surfaces using in situ produced cosmogenic radionuclides, Geology, 24, 47-51.
Avouac, J. P., P. Tapponnier, M. Bai, H. You, and G. Wang (1993), Active thrusting and folding along the northern Tien Shan and late Cenozoic rotation of the Tarim relative to Dzungaria and Kazakhstan, J. Geophys. Res., 98(B4), 6755-6804.
Balco, G., J. O. Stone, N. A. Lifton, and T. J. Dunai (2008), A complete and easily accessible means of calculating surface exposure ages or erosion rates from 10Be and 26Al measurements, Quaternary geochronology, 3(3), 174-195.
Balco, G. (2017). Production rate calculations for cosmic-ray-muon-produced 10Be and 26Al
benchmarked against geological calibration data. Quaternary Geochronology, 39, 150-173, doi: 10.1016/j.quageo.2017.02.001.
Behr W.M., D.H. Rood, K. Fletcher, N. Guzman, R. Finkel, T. Hanks, K. Hudnut, K. Kendrick, J.P. Platt, W.D. Sharp, R.J. Weldon, J.D. Yule (2010). Uncertainties in slip-rate estimates for the Mission Creek strand of the southern San Andreas fault at Biskra Palms Oasis, southern California. GSA Bulletin ; 122(9-10): 1360–1377. doi: 10.1130/B30020.1.
Bennett, R. A., A. M. Friedrich, and K. P. Furlong (2004). Codependent histories of the San Andreas and San Jacinto fault zones from inversion of fault displacement rates, Geology,
32(11), 961-964.
Borchers, B., Marrero, S., Balco, G., Caffee, M., Goehring, B., Lifton, N., Nishiizumi, K., Phillips, F., Schaefer, J., Stone, J. (2016). Geological calibration of spallation production
rates in the CRONUS-Earth project. Quaternary Geochronology, 31, 188-198, doi: 10.1016/j.quageo.2015.01.009.
Braucher, R., E. Brown, D. Bourlès, and F. Colin (2003). In situ produced 10Be measurements at great depths: implications for production rates by fast muons. Earth and
Planetary Science Letters, 211(3-4), 251-258.
Braucher, R., Merchel, S., Borgomano, J., Bourlès, D.L., 2011. Production of cosmogenic radionuclides at great depth: A multi element approach. Earth Planet. Sci. Lett. 309, 1-9. Brown, E. T., D. L. Bourlès, G. M. Raisbeck, F. Yiou, B. Clark Burchfiel, P. Molnar, D.
Qidong, and L. Jun (1998). Estimation of slip rates in the southern Tien Shan using cosmic ray exposure dates of abandoned alluvial fans. Geological Society of America Bulletin,
110(3), 377-386.
Bull, W. B. (1991). Geomorphic Responses to Climatic Change. Oxford University Press, New York.
Burchfiel, B. C., Z. Peizhen, W. Yipeng, Z. Weiqi, S. Fangmin, D. Qidong, P. Molnar, and L. Royden (1991). Geology of the Haiyuan Zone, Ningxia-Hui Autonomous Region, China, and its Relation to the Evolution of the Northeastern Margin of the Tibetan Plateau.
Tectonics, 10(6), 1091-1110.
Cavalié, O., C. Lasserre, M.-P. Doin, G. Peltzer, J. Sun, X. Xu, and Z.-K. Shen (2008). Measurement of interseismic strain across the Haiyuan fault (Gansu, China), by InSAR.
Earth and Planetary Science Letters, 275(3), 246-257.
Chevalier, M.-L., P. Tapponnier, J. Van der Woerd, F. J. Ryerson, R. C. Finkel, and H. Li (2012). Spatially constant slip rate along the southern segment of the Karakorum fault since 200 ka. Tectonophysics, 530, 152-179.