HAL Id: hal-00316230
https://hal.archives-ouvertes.fr/hal-00316230
Submitted on 1 Jan 1996
HAL is a multi-disciplinary open access
archive for the deposit and dissemination of sci-entific research documents, whether they are pub-lished or not. The documents may come from teaching and research institutions in France or abroad, or from public or private research centers.
L’archive ouverte pluridisciplinaire HAL, est destinée au dépôt et à la diffusion de documents scientifiques de niveau recherche, publiés ou non, émanant des établissements d’enseignement et de recherche français ou étrangers, des laboratoires publics ou privés.
Imaging and EISCAT radar measurements of an auroral
prebreakup event
V. Safargaleev, T. Turunen, W. Lyatsky, J. Manninen, A. Kozlovsky
To cite this version:
V. Safargaleev, T. Turunen, W. Lyatsky, J. Manninen, A. Kozlovsky. Imaging and EISCAT radar measurements of an auroral prebreakup event. Annales Geophysicae, European Geosciences Union, 1996, 14 (11), pp.1170-1176. �hal-00316230�
Received: 31 May 1995/Revised: 9 February 1996/Accepted: 27 February 1996
Abstract. The results of coordinated EISCAT and TV-camera observations of a prebreakup event on 15 Novem-ber 1993 have been considered. The variations of the luminosity of two parallel auroral arcs, plasma depletion on the poleward edge of one of these arcs as well as electron and ion temperatures in front of a westward travelling surge were studied. It was found that a short-lived brightening of a weak zenith arc before an auroral breakup was accompanied by fading of an equatorial arc and, vice versa. A plasma depletion in the E region was detected by the EISCAT radar on the poleward edge of the zenith arc just before the auroral breakup. The plasma depletion was associated with an enhancement of ion (at the altitudes of 150—200 km) and electron (in E region) temperatures. During its occurrence, the electric field in the E-region was extremely large (\150 mV/m). A signifi-cant increase in ion temperature was also observed 1 min before the arrival of a westward travelling surge (WTS) at the radar zenith. This was interpreted as the existence of an extended area of enhanced electric field ahead of the WTS.
1 Introduction
The auroral activity before substorm onset has been studied by many authors (Akasofu, 1964; Morse and Romick, 1982; Sergeev et al., 1986; Koskinen et al., 1993 and others). In particular, two interesting features of pre-breakup activity have been pointed out: sporadic intensifi-cation of the auroral luminosity (pseudobreakup) and the fading of the auroras just before the substorm onset.
The term ‘‘pseudobreakup’’ was introduced by Akasofu (1964) for the description of breakup-like events in the aurora activity that is not accompanied by the auroral substorm development. Sometimes this term is used for
Correspondence to: V. Safargaleev
events that demonstrate only some features of a breakup (Koskinen et al., 1993). Sergeev et al. (1986) observed a similar phenomenon during rather quiet geomagnetic conditions and often without other substorm signatures. They noticed that it may occur in growth and recovery phases as well as during quiet periods and that distin-guishing features of pseudobreakup are the short lifetime of active auroral forms and their spatial localisation. Koskinen et al. (1993) noticed that although pseudo-breakup as a rule does not lead to the development of an expanding current wedge, it may not differ fundamentally from an ordinary breakup. Koskinen et al. (1993) believe that the main differences between these two phenomenon seem to be their strength and consequences, and pseudo-breakup should be understood as a limited temporal event in the substorm development, the consequences of which are different from a regular substorm.
Another interesting prebreakup event is a fading of auroral arc brightness just before the breakup. Pellinen and Heikkila (1978) have studied this phenomenon in detail. They showed that the fading is usually preceded by moderate brightening lasting 1—2 min. Pellinen et al. (1994) connect the aurora fading with the decrease of the E-region ionisation observed by EISCAT radar.
In this paper we have analysed simultaneous EISCAT and TV-camera data for a few minutes prior to a substorm onset on 15 November 1993. Three interesting geophysi-cal events were studied during this interval: pseudo-breakup, plasma depletion on the poleward edge of the southward drifting auroral arc and a westward travelling surge.
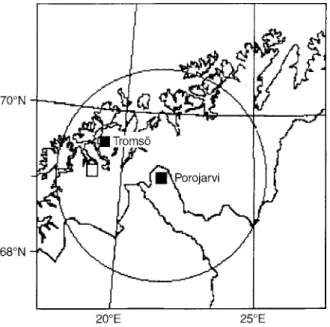
2 Description of event and method of investigation The results of simultaneous EISCAT UHF radar (Tromso; 69.4°N, 19.1°E) and TV-camera (Porojarvi; 69.2°N, 21.5°E) observations have been considered. The EISCAT operated in the CP-1 mode (for more detail, see EISCAT annual report, 1993, s-981 28 Kiruna, Sweden). The radar beam was directed along the magnetic field line
Fig. 1. The location of the TV-camera and EISCAT radar on 15 November 1993. An open square shows the EISCAT zenith at an altitude of 100 km, the border of the TV-camera field of view is shown as a circle
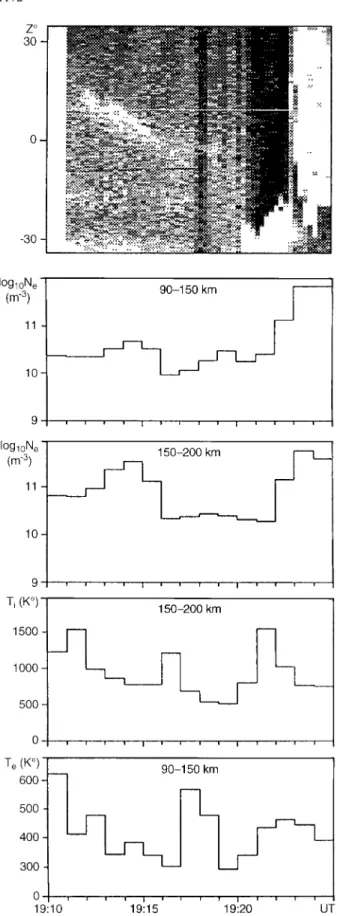
Fig. 2. Grey-scale representation of electron concentration (1-min averages) measured by the EISCAT radar on 15 November 1993
at an azimuth of 182.6° and elevation angle of 77.5°. The measurements were made in the altitude range of 89.2—319.6 km with an altitude resolution of 4.8 km. The TV-camera was pointed toward zenith. The fish-eye lens gave a field of view of \140°]140°. The locations of TV-camera and EISCAT transmitter are shown in Fig. 1. The solid squares show the radar and TV-camera posi-tions, the EISCAT zenith at the altitude of 100 km is shown as an open square, the TV-camera field of view is marked by circle.
The interval between 1910—1925 UT on 15 November 1993 just before a substorm onset, when EISCAT radar registered a significant depletion of ionospheric plasma over a wide altitude range, has been chosen for analysis (Fig. 2). The auroral activity for this interval is shown in
Fig. 3. Image of prebreakup events obtained from TV-camera data (Porojarvi) on 15 November 1993. The EISCAT zenith at the alti-tude of 100 km is shown as an open square
Fig. 3. There were two auroral arcs in the TV-camera field of view, a weak zenith arc and an intense arc located equatorward from the TV-camera. During the intensifica-tion of the zenith arc (pseudobreakup event) the west edge of the arc crossed the radar zenith (open square in Fig. 3). Some minutes later, a westward travelling surge, origi-nating from the equatorward arc, reached the radar zenith which allowed analysis of the ionospheric parameters in front of the WTS.
All the data used for this analysis were available in digital form. The EISCAT radar data had a form of 1-min-averaged altitude profiles of electron density, elec-tron and ion temperatures as well as 5-min averages for the horizontal component of the electric field in the E-region ionosphere. Data from the TV-camera were digitised at 15-s intervals and samples along the geo-graphic meridian were used to construct a keogram. Such a keogram indicates the temporal behaviour of auroral luminosity as a function of latitude. Unfortunately the V. Safargaleev et al.: Imaging and EISCAT radar measurements 1171
Fig. 4. Plot of simultaneous TV and EISCAT observations of a zen-ith auroral arc on 15 November 1993. ºpper panel: a keogram along the geographic meridian of EISCAT. Positive value of the zenith angle Z corresponds to the poleward direction. The narrow white
line shows the position of the EISCAT zenith at altitude of 100 km;
¸ower panels: temporal variation of ionospheric parameters meas-ured by the EISCAT radar and averaged over altitude range of 90—150 km and 150—200 km. Ne is the electron concentration; ¹i is the ion temperature, ¹e is the electron temperature
background correspond to the periods of low TV receiver sensitivity. It is seen, that: (1) the short-lived (4 min dura-tion) luminosity enhancement of the rather weak zenith arc was accompanied by its equatorward movement at a velocity of about 0.3 km · s~1, (2) the end of the arc movement coincides with the beginning of the arc fading and (3) the breakup originates on the equatorial arc. A few minutes before the breakup, the fading arc disap-pears almost completely.
A similar behaviour of arcs was pointed out by many authors (Koskinen et al., 1993 and references therein) and seems to be a common feature of the pseudobreakup phenomenon. However, in this case the brightening arc crosses the EISCAT zenith which allows a study of the behaviour of ionospheric parameters during pseudo-breakup.
Figure 2 demonstrates the plasma density variations in the ionosphere measured with EISCAT radar. It can be seen that the arc under consideration was associated with a plasma density enhancement at altitudes of 130—200 km at 1915 UT. This shows that the precipitating particle energy was relatively low. Figure 4 (top panel) shows the temporal variation of the luminosity along the geographic meridian of the EISCAT viewpoint. The white line indi-cates the trace of radar zenith at altitude of 100 km. The plasma density, electron and ion temperature variations are also shown averaged over the altitude range from 90 to 150 km (E region of ionosphere) and from 150 to 200 km. Figure 4 shows that inside the auroral arc region, the ion temperature drops above 150 km and the electron temperature decreases in the E-region. Both temperatures increase significantly on the poleward and equatorward edges of the arc. By assuming that these temperature changes are associated with the electric field value (Williams et al., 1990), a conclusion that the electric field was large on the arc edges and small inside the arc can be made.
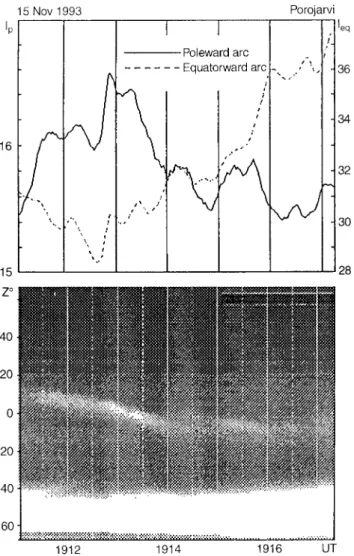
»ariations of luminosity in the parallel auroral arcs. The behaviour of two parallel auroral arcs before the breakup is presented in Fig. 5. The keogram along the TV-camera geographic meridian (lower panel) as well as the vari-ations of mean values of the arc luminosity (upper panel) are obtained from the digitised TV-data (at a frequency of one frame per 2 s).
Fig. 5. Luminosity variations of the equatorial and zenith arcs before the breakup on 15 November 1993. I — intensity of the luminosity (arbitrary units)
An interesting feature of Fig. 5 is the anticorrelation of luminosity in these two parallel auroral arcs during the whole interval. It can be seen that the disappearance of the poleward arc is accompanied by the intensification of the equatorward arc (1915:30—1917:00 UT) whereas its activ-isation from 1911:30 to 1914:00 UT is accompanied by the equatorward arc fading.
This result prompted us to look at another interval of prebreakup activity at 2050 UT on 15 November 1993. This interval was digitised at the same frequency and the keogram along the TV-camera geographic meridian is presented in Fig. 6. The interval is more complex because there were more than two auroral arcs on the sky. At least three pseudobreakup events can be seen on Fig. 6 (\2046:30, \2047:30 and \2049:00 UT). An active arc moves equatorward, then stops and disappears. The arc’s fading and disappearance is accompanied by the activisa-tion of the next arc every time. Breakup begins at 2049:15 UT equatorward from TV-camera zenith and is accompanied by the fading of the last zenith arc.
As we have noted before, the short-lived auroral arc intensifications before substorm onset are well known as
Fig. 6. A keogram along the geographic meridian of TV-camera for prebreakup events between 2046:30 and 2049:15 UT on 15 Novem-ber 1993
‘‘pseudobreakup’’ events (Akasofu, 1964; Koskinen et al., 1993). The decrease of the poleward auroral arc intensity before substorm onset has been pointed out earlier by Zaytseva et al. (1976) and described as ‘‘fading’’ by Pel-linen and Heikkila (1978). Morse and Romick (1982) studied the fluctuation of auroral arcs before substorm onset, too. In particular, they have found that when more than one arc is present the sky frequently does not fade as a whole, but some arcs will dim while others brighten. The observed anticorrelation in the luminosity of the two parallel arcs has not been mentioned before and seems to be a new result.
3.2 A plasma depletion at the poleward boundary of an auroral arc
The plasma cavity in the ionosphere is the region of low plasma density corresponding to one of the edges of an auroral arc. The plasma cavity was first seen with the Sondrestrom and EISCAT incoherent scatter radars. It is detected both in the F-region (Doe et al., 1993; Doe et al., 1994), and in the E region (Opgenoorth et al., 1990; Lewis
et al., 1994) of the ionosphere and is associated with
a region of enhanced electric field or downward field aligned current observed at one side of auroral arc.
In our case a cavity-like event was detected by EISCAT on the poleward edge of the zenith arc after it had passed through the radar zenith. In Fig. 4 the plasma cavity in the E-region is seen near 1916 UT as a sharp depletion in the electron concentration. The plasma depletion was also seen at altitudes of 150—200 km but it lasted longer, until the arrival of the WTS at the radar zenith.
The plasma depletion at 1916—1917 UT was accom-panied by an ion temperature enhancement in the altitude range of 150—200 km. This suggests an increase of the electric field inside the region of depleted plasma (Rees
et al., 1984, Haggstrom and Collis, 1990). It is also
inter-esting to note the significant rise of the electron temper-V. Safargaleev et al.: Imaging and EISCAT radar measurements 1173
velocity of about 0.3 km/s gives a width of the depleted plasma region of about 40 km. As the time of depleted plasma region observation is of order of the time resolu-tion of the data (the higher resoluresolu-tion was suitable only for power profiles), its estimated width of about 40 km has a large error bar.
Although the ion and electron temperatures increased on both the edges of the arc, the cavity was detected on the poleward edge only.
3.3 Electric field and plasma parameters in front of a WTS
As mentioned in Sect. 3.1 the breakup begins as a brightening of the equatorial arc. The auroral surge forms to the east of the TV-camera zenith (Fig. 2), moves westward and reaches the radar zenith at 1923 UT.
Figure 7 (top) shows the temporal dependence of the luminosity at the radar viewpoint. It also shows the plasma density, electron and ion temperatures variations averaged through the altitude range from 90 to 150 km (E-region) and from 150 to 200 km. As seen from Fig. 7, the approach of the westward-travelling surge (WTS) is characterised in EISCAT data by a plasma density in-crease in both the E and F regions as well as by an increase of electron temperature in the F region.
The most interesting feature of Fig. 7 is the clear rise in the ion temperature (up to 1500 K) in the F region of the ionosphere 1 min before the WTS arrived and the density was enhanced. As noted, the ion temperature increase is associated usually with an increase in the electric field, and the observed temperature increase may be interpreted as the existence of an extended area of enhanced electric field in front of a WTS.
4 Discussion
We have described a case of simultaneous EISCAT-radar and TV-camera measurements that were made on 15 November 1993 just before a substorm onset. An observed pseudobreakup event and the WTS were the main objects of our study.
Fig. 7. Plot of simultaneous TV and EISCAT observations of breakup activity on 15 November 1993. ºpper panel: variations of the luminosity in the vicinity of the EISCAT radar viewpoint.
I — intensity of the luminosity (arbitrary units). ¸ower panels:
tem-poral variation of ionospheric parameters measured by the EISCAT radar and averaged over the altitude range of 90—150 km and 150—200 km. Ne is the electron concentration; ¹i is the ion temper-ature, ¹e is the electron temperature
During the pseudobreakup, the brightening arc moved equatorward and crossed the EISCAT beam. Poleward of this arc, the EISCAT radar detected a plasma depletion
both in the E and F regions that was seen until the WTS arrived. We think that the ‘‘plasma cavity’’ originated in the region of downward field-aligned current correspond-ing to this arc. (The possible role of the field aligned current in a cavity formation was discussed by Doe et al., 1993). Pellinen et al. (1994) suggest that the ionospheric plasma depletion before the breakup is a signature of aurora fading.
One minute before the WTS arrival, the EISCAT de-tected a significant increase of ion temperature in the F-region of the ionosphere that was interpreted as an enhancement of the electric field before the surge front. A similar observation was reported earlier by Opgenoorth
et al. (1983). In that paper, a strong enhancement of
eastward electric field before the surge front had been deduced from the STARE data. To explain the E-field enhancement described by Opgenoorth et al. (1983), Kozelova and Lyatsky (1984) have suggested a region of field-aligned current to the west of the WTS. Until now, that case seems to be the only case of direct measurements in front of the westward edge of the WTS (see Yamamoto
et al., 1993). Recently Wiemer et al. (1994) have described
a case of DE 1 satellite passage through a surge and a distribution of the electric field poleward and equator-ward of the WTS. The increase of the ion temperature before the substorm onset was reported also by Forme
et al. (1995).
An interesting phenomenon in the behaviour of two parallel arcs before the breakup has been found from the analysis of digitised optical data. A short-lived activisa-tion of one arc (pseudobreakup event) is accompanied by fading of the other arc. We have no additional data for this interval to map the position of the polar cap bound-ary. Nevertheless, it may be assumed that both arcs are projected inside the plasma sheet. In the previous section we noted a possible association of the ionospheric plasma cavity with the region of downward field-aligned currents. In accordance with Burke et al. (1994), these currents may be a signature of the plasma sheet boundary layer. Both arcs are situated equatorward of these currents. Assuming the reconnection of the magnetic field lines in the mag-netotail to be a reason for the pseudobreakup event and auroral arc brightening, it may be concluded from the anticorrelation found in the luminosity of two arcs that the beginning of reconnection at one place of the plasma sheet reduces the probability of reconnection at another place.
5 Summary
On the poleward edge of the weak poleward arc, EISCAT detected a plasma depletion in both E and F regions of the ionosphere. The plasma depletion was associated with the enhancement of ion temperature (at the altitudes of 150—200 km) and electron temperature (in E region). Al-though the temperature enhancements take place on both edges of the arc, the plasma depletion is observed only on the poleward edge. The width of the region of plasma depletion is estimated to be about 40 km. During the interval of its observation, the electric field in the E region
was extremely large (approximately 150 mV/m). The plasma depletion may be the same phenomenon as the plasma cavity reported by Doe et al. (1993). The decrease of the E-region ionization before auroral breakup has been described earlier as a signature of aurora fading (Pellinen et al., 1994).
The increase of ion temperatures from 800 to 1500 K in the F region of the ionosphere has been found 1 min before the arrival of a WTS at the radar zenith. This may be interpreted as the existence of extended area of en-hanced eastward electric field ahead of the WTS in ac-cordance with earlier reports of Kozelova and Lyatsky (1984).
The behaviour of the luminosity of two parallel arcs before auroral breakup has been studied. It has been found that the luminosity of the arcs changes in opposite phases. Namely, a brightening of one arc (pseudobreakup event) is accompanied by fading of the other arc and vice versa. This may show that the reconnection onset at one point hinders the reconnection development in another part of the magnetotail.
Acknowledgements. This material was based upon research
sup-ported by the Russian Foundation for Fundamental Researches (grant No 05-95-14496). The authors thank V. N. Kriviliov (Polar Geophysical Institute) for his help in data development.
Topical Editor D. Alcayde´ thanks R. Doe and another referee for their help in evaluating this paper.
References
Akasofu, S.-I., The development of the auroral substorm, Planet.
Space Sci., 12, 273, 1964.
Burke, W. J., J. S. Machuzak, N. C. Maynard et al., Auroral ionospheric signatures of the plasma sheet boundary layer in the evening sector, J. Geophys. Res., 99, 2489, 1994.
Doe, R. A., M. Mendillo, J. F. Vickerey et al., Observations of nightside auroral cavities, J. Geophys. Res., 98, 293, 1993. Doe, R. A., M. Mendillo, J. F. Vickerey et al., Coordinated
convec-tion measurements in the vicinity of auroral cavities, Radio Sci., 29, 293, 1994.
Forme, F., D. Fontain, and M. A. L. Persson, EISCAT observations of ion temperature enhancement near sustorm onset, 7th EISCAT
scientific workshop. October 2nd—6th, 1995, Cargese, Corsica,
Cephag, 1995.
Haggstrom, I., and P. N. Collis, Ion composition changes during F-region density depletion in the presence of electric fields at auroral latitudes, J. Atmos. ¹err. Phys., 52, 519, 1990.
Koskinen, H. E. J., R. E. Lopez, R. J. Pellinen et al., Pseudobreakup and substorms growth phase in the ionosphere and magneto-sphere, J. Geophys. Res., 98, 5801, 1993.
Kozelova, T. V., and W. B. Lyatsky, Field-aligned current before a westward-travelling surge, Geomagn. Aeron. (in Russian), 24, 301, 1984.
Lewis, R. V., P. J. S. Williams, G. O. L. Jones et al., The elec-trodynamics of a drifting aurora arc, Ann. Geophysicae, 12, 478, 1994.
Morse, T. H., and G. J. Romick, The fluctuation and fading of auroral arcs preceding auroral substorm onset, Geophys. Res. ¸ett., 1982, 9, 1065.
Opgenoorth, H. J., I. Haggsrom, P. J. S. Williams, and G. O. L. Jones, Regions of strongly enhanced perpendicular electric fields adjacent to auroral arcs, J. Atmos. ¹err. Phys., 52, 449, 1990. Opgenoorth, H. J., R. J. Pellinen, W. Baumjohann, E. Nielsen,
G. Marklund, and L. Eliasson, Three-dimensional current flow and particle precipitation in a westward-travelling surge V. Safargaleev et al.: Imaging and EISCAT radar measurements 1175