HAL Id: hal-00295318
https://hal.archives-ouvertes.fr/hal-00295318
Submitted on 27 Aug 2003
HAL is a multi-disciplinary open access
archive for the deposit and dissemination of
sci-entific research documents, whether they are
pub-lished or not. The documents may come from
teaching and research institutions in France or
abroad, or from public or private research centers.
L’archive ouverte pluridisciplinaire HAL, est
destinée au dépôt et à la diffusion de documents
scientifiques de niveau recherche, publiés ou non,
émanant des établissements d’enseignement et de
recherche français ou étrangers, des laboratoires
publics ou privés.
measured in the summertime european outflow (on
Crete in 2001)
Valérie Gros, J. Williams, J. A. van Aardenne, G. Salisbury, R. Hofmann, M.
G. Lawrence, R. von Kuhlmann, J. Lelieveld, M. Krol, H. Berresheim, et al.
To cite this version:
Valérie Gros, J. Williams, J. A. van Aardenne, G. Salisbury, R. Hofmann, et al.. Origin of
anthro-pogenic hydrocarbons and halocarbons measured in the summertime european outflow (on Crete in
2001). Atmospheric Chemistry and Physics, European Geosciences Union, 2003, 3 (4), pp.1223-1235.
�hal-00295318�
Chemistry
and Physics
Origin of anthropogenic hydrocarbons and halocarbons measured
in the summertime european outflow (on Crete in 2001)
V. Gros1, J. Williams1, J. A. van Aardenne1, G. Salisbury1, R. Hofmann1, M. G. Lawrence1, R. von Kuhlmann1, J. Lelieveld1, M. Krol2, H. Berresheim3, J. M. Lobert4, and E. Atlas5
1Max Planck Institut for Chemistry, Air Chemistry Department, P.O. Box 3060, 55020 Mainz, Germany 2Institute for Marine and Atmospheric Research Utrecht (IMAU), Utrecht University, the Netherlands 3Deutscher Wetterdienst, Hohenpeissenberg, Germany
4Teledyne-API, 6565 Nancy Ridge Drive, San Diego, CA 92121, USA 5National Center for Atmospheric Research, Boulder, Colorado, USA
Received: 31 January 2003 – Published in Atmos. Chem. Phys. Discuss.: 14 April 2003 Revised: 30 July 2003 – Accepted: 8 August 2003 – Published: 27 August 2003
Abstract. During the Mediterranean Intensive Oxidant Study MINOS in August 2001, 87 air samples were collected at the ground-based station Finokalia (35◦19’N, 25◦40’E) on the north coast of Crete and subsequently analysed by GC-MS. The analysis includes various hydrocarbons, organo-halogens, HCFCs and CFCs. These compounds have a wide variety of sources and sinks and a large range of atmospheric lifetimes. We evaluated the characteristics of the sampling site in terms of proximity to individual sources by plotting the measured variability of these species against lifetime. The resulting linear relationship suggests that the sampling site is representative of intermediate conditions between a remote site and one that is in the vicinity of a wide variety of sources. Our analysis of air mass origin and chemical ra-tios also shows that several distinct anthropogenic sources influenced the atmospheric composition over Crete. Propane observations are compared to a global model to assess the fossil fuel related emission inventory. Although the model reproduces the general pattern of the propane variations, the model mixing ratios are systematically too low by a fac-tor of 1.5 to 3, probably due to an underestimation of the propane emissions from east European countries in the un-derlying global database EDGAR. Another important find-ing was that methyl chloroform, a compound banned un-der the Montreal protocol, showed significant enhancements from background, which were well correlated with CFC-113. This suggests continued use and emission of methyl chloro-form by one or more European countries. We also discuss the observed variations of methyl bromide and suggest that the significant peak observed on 12 August 2001 reflects heavy agricultural use as a soil fumigant in Italy.
Correspondence to: V. Gros (vgros@mpch-mainz.mpg.de)
1 Introduction
Volatile organic compounds (VOC) comprise a large num-ber of chemical families, including alkanes, alkenes, car-bonyls, alcohols, organo-halogens and CFCs. These com-pounds have a large range of lifetimes from a few hours for pentane to several hundred years for CFC-114.
The most reactive gases (non-methane hydrocarbons NMHCs- and partly oxygenated NMHCs) play an important role in the oxidising capacity of the atmosphere. Their atmo-spheric breakdown, in the presence of nitrogen oxides, leads to the photochemical build-up of ozone. Therefore, it is es-sential to determine accurately the budget and distribution of these compounds. While their sinks (mostly through reac-tion with OH, although the reacreac-tions with O3and NO3 can
also be significant for unsaturated NMHCs) are quite well quantified by laboratory studies, large uncertainties remain with respect to their sources. These compounds have a wide variety of biogenic sources (vegetation, ocean, etc) and an-thropogenic sources (fossil fuel use and combustion, biomass burning, etc.), for which emissions still need to be confirmed, determined or quantified.
The fact that long-lived species (organo-halogens and CFCs) are radiatively active and that their potential to re-lease chlorine or bromine in the stratosphere leads to ozone destruction, make them important species to study. Follow-ing the Montreal Protocol (1987) and subsequent amend-ments, the consumption of several halocarbons has now been phased out in developed countries. Several background stud-ies have already reported the expected decrease of some of these compounds in the atmosphere and have also provided information about their regional sources. For instance, mea-surements of diverse halocarbons performed at Mace Head, Ireland, were used to estimate the intensity and distribution of their western European emissions (Ryall et al., 2001 and
references therein). To our knowledge, no measurements have been performed directly in the outflow from eastern Eu-rope in order to determine the eastern EuEu-ropean contribution to their global budgets.
The MINOS campaign on Crete was dedicated to the ob-servation of long-range transport of pollution and presented an ideal opportunity to perform measurements of VOCs in the outflow of eastern Europe and to study their origin. This paper focuses on observations of alkanes (propane, butanes, pentanes) and halocarbons (particularly methyl chloroform, CFC-113 and methyl bromide) and discusses their various anthropogenic emissions. A detailed analysis of the oxy-genated compounds acetone and methanol is given elsewhere (Salisbury et al., 2003).
2 Experimental
2.1 Site and sampling
Air samples were collected at the atmospheric measurement station Finokalia 35◦19’N, 25◦40’E, 150 m above sea level, a remote site on the northern coast of Crete. Air samples were pressurised in 2.4 L electropolished stainless steel canisters previously flushed with synthetic air and then pressurised to about 4 bar. Canisters were made at the workshop of the Max Planck Institute and were equipped with stainless steel valves (Nupro SS4H). The canisters were not humidi-fied but the quite high relative humidity observed during the MINOS campaign (63% on average) was considered to be sufficient to prevent losses associated with dry air. Using a Teflon membrane pump (KNF, Neuberger, Germany), canis-ters were flushed at least 5 times with ambient air and then pressurised to approximately 4 bar. Analysis of the samples was carried out in the laboratory in Mainz between 3 and 6 months after sampling. Stability of the measured com-pounds over this long period of time has been checked by filling two cylinders with the high-pressure working stan-dard and by measuring them after 1, 3, and 5 months against the working standard. The working standard was also air collected from Finokalia (see Sect. 2.3). For all the com-pounds presented here but one, no drift in the concentrations was observed and the concentrations remained within the un-certainty range. The only exception was chloroform, which showed values lower than expected (up to 30%).
In August 2001, the site was influenced by on-shore north-north westerly winds with an average speed of 8 m s−1. This wind advected pollutants from eastern Europe across the Aegean Sea to Crete (see Salisbury et al., 2003, for a map of the region and a complete description of air mass origin). Between 1 and 16 August 2001, 87 air samples were col-lected at six-hour intervals and at much shorter intervals on selected days.
2.2 Instrumentation
The analytical instrumentation consisted of a gas chromatograph-mass spectrometer system (GC-MS 6890/5973, Agilent Technology, Palo Alto, CA, USA) which has been modified from the commercial version for analysis of low-level ambient air samples. A sample preparation/cryoconcentrator unit was built (as detailed below) and the valves/heating system was automated using a custom built electronic programmable controller. To avoid water related problems (shifting of retention times or ice blocking the trap), water was removed by a mag-nesium perchlorate trap (replaced approximately every 100 measurements), commonly used for VOC analysis (Namiesnik and Wardencki, 1999 and references therein). Where possible, the lines and the switching valves were incorporated in a heated box (∼50◦C). The dryer, which was outside the box, was separately heated to above 75◦C to improve drying efficiency and prevent condensation. A known volume of sample (about 1 liter) was cryogenically concentrated at −72◦C using a Neslab cc-100 circulation cooler (Portsmouth, USA) at a flowrate of 30–40 ml min−1 in a stainless steel microtrap (length: 30 cm, ID: 0.076 cm), packed with porous silica beads (Unibeads 1S, 80/100 mesh, Alltech) over a length of about 10 cm. The exact volume sampled was determined by the pressure difference in a known volume downstream of the trap, held at 50◦C. For GC injection, the cold trap is heated to 200◦C in less than 20 s. The carrier gas was Helium (99.9999, with a Supelco® catalytic purifier in-line) at an initial flow rate of 3.7 ml min−1. A 60 m×0.248 mm DB-5 capillary column
(J & W Scientific) was held at −65◦C for one minute and then heated to 120◦C at a rate of 8◦C min−1, followed by ramping to 175◦C at a rate of 70◦C min−1 and remained at this temperature for 5 min before finally being heated at the same rate to 250◦C and then maintained at this temperature for 6 min. A complete run lasts about 35 min and allows a good separation of more than 60 identified compounds. The mass spectrometer is operated in single ion mode (SIM) for maximum sensitivity of the measurements. More than half of the samples were measured twice and, on average, the two measurements agreed within 3.5% (standard deviation over mean).
2.3 Calibration and characteristics of the analysis system Calibrations were performed against a working standard, a 10-L aluminium cylinder (Scott Marin, Riverside, Califor-nia) filled at the Finokalia station two months before the cam-paign by using a three stage RIX oil-free piston compressor (Mak and Brenninkmeijer, 1994). This cylinder, along with a second, filled a couple of hours later,was then calibrated at the National Center for Atmospheric Research (NCAR, Boulder, Colorado) relative to a gravimetrically prepared standard referenced to standards by the National Institute of
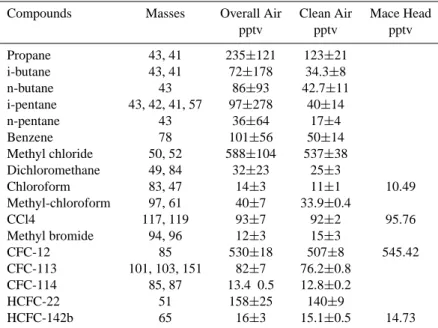
Table 1. Average mixing ratios of selected VOCs measured during MINOS. The second column gives the corresponding monitored ions (the
first ion was used for quantification). The clean air concentrations are an average of 4 samples collected on 7 August (see text). Mace Head data (August 2001 mean) are from the ALE/GAGE/ALGAGE network (http://cdiac.ornl.gov/ndps/alegage.html)
Compounds Masses Overall Air Clean Air Mace Head pptv pptv pptv Propane 43, 41 235±121 123±21 i-butane 43, 41 72±178 34.3±8 n-butane 43 86±93 42.7±11 i-pentane 43, 42, 41, 57 97±278 40±14 n-pentane 43 36±64 17±4 Benzene 78 101±56 50±14 Methyl chloride 50, 52 588±104 537±38 Dichloromethane 49, 84 32±23 25±3 Chloroform 83, 47 14±3 11±1 10.49 Methyl-chloroform 97, 61 40±7 33.9±0.4 CCl4 117, 119 93±7 92±2 95.76 Methyl bromide 94, 96 12±3 15±3 CFC-12 85 530±18 507±8 545.42 CFC-113 101, 103, 151 82±7 76.2±0.8 CFC-114 85, 87 13.4 0.5 12.8±0.2 HCFC-22 51 158±25 140±9 HCFC-142b 65 16±3 15.1±0.5 14.73
Values are reported as geometric means (to minimize skew errors of a non-normal distribution) with one standard deviation.
Standards and Technology (NIST) (estimated accuracy of 2– 3%). Therefore, all the VOC measurements presented in this paper are calibrated on the NCAR calibration scale. Details of the NCAR calibration procedure are given in Schauffler et al. (2003) and references therein. About one year af-ter the collection of these two cylinders, we measured our working standard against the other calibrated cylinder and we found the expected concentration (3.5% difference on av-erage). Assuming the two cylinders (which were taken at different times of day) did not drift in exactly the same way, we may conclude that the concentrations in our working stan-dard did not drift over the period of MINOS measurements. Two different calibration procedures were used. At first, the mass spectrometer was tuned every week and a calibration was performed several times at the beginning and at the end of a week. A calibration was once performed in the middle of the week and it was found that the decrease of MS sensi-tivity over the week was almost linear and therefore the re-sponse factors for every day were linearly interpolated over the week. However, as the decrease of the sensitivity was significant from week to week, it could not be extrapolated between weeks. Therefore, for the last 37 samples a second method was applied in which the working standard was anal-ysed at the beginning and at the end of the day (the MS still being tuned each week). The average response factor of these two analyses was used to calibrate the samples measured on the same day. There was never a trend in the daily calibration greater than the mean precision which was 15% (see below).
At least two blanks (using the same analytical procedure but without collecting sample) were performed at the start of each measurement sequence and showed a generally clean baseline with only minor impurities of benzene, which were well within its measurement uncertainty.
Several tests were performed in the laboratory to evaluate the characteristics of the analytical system. Detection lim-its were in the range of 1–10 parts per trillion (10−12mol per mol by volume, pptv) for the compounds reported here. Linearity of the analytical system was better than 3% for all the compounds presented. The linearity was determined by injecting different amounts (from 0.03 L to 1 L) of the same sample and by monitoring the corresponding peak area. The obtained linear fits were used to calculate the residuals. The residuals were calculated as the difference between the actual value and the linear fit (for each point between 0.03 and 1 l injections), these differences being then divided by the actual volume that was injected and finally multiplied by 100. The average of these residual values gave the linearity in percent-age terms of individual data points for each specific com-pound. Analytical precision of 10 consecutive analyses of the same standard was better than 5% for all compounds ex-cept for methyl bromide (7%) and methyl chloroform (7%). We note that these relatively high values for methyl bromide and methyl chloroform were due to outliers. When omitting the extreme values (the lowest one and the highest one), then the precision is also better than 5% for these two compounds. We estimate the overall uncertainty of the measurements to be better than 15% for all compounds.
3 Results and discussion
Table 1 presents the results obtained for the VOC measure-ments during the MINOS campaign. The third column gives the overall geometric mean and the corresponding standard deviation. The high standard deviations for the alkanes are due to the large variability of their mixing ratios between clean and polluted events (see Sect. 3.2.1). In contrast, the CFCs which have longer lifetimes show less variability and hence lower standard deviations. For comparison with other studies, the average value observed on 7 August is included and indicated as “clean air” (Table 1). This day was the least influenced by recent pollution as indicated by the relatively low values of all measured hydrocarbons (e.g. alkanes and benzene). For the most reactive compounds, i.e. the hydro-carbons, a comparison with other measurements in the north-ern hemisphere is not straightforward as their concentrations are very variable depending on the proximity to, and inten-sity of their sources. Their variability in terms of sources and photochemical processing during MINOS are described in detail in Sect. 3.2.
For the long-lived compounds, the most extensive set of measurements is from the ALE/GAGE/AGAGE network (Prinn et al., 2000), which consists of 5 measurement sta-tions in the northern hemisphere and 2 stasta-tions in the south-ern hemisphere. We compare our data to the measurements performed at Mace Head, the only ALE/GAGE/AGAGE sta-tion located in Europe. Five long-lived compounds (CFC-12, CFC-113, HCFC-142b, CHCl3and CCl4) were measured
both at Mace Head and at Finokalia during August 2001. The corresponding monthly means are reported in Table 1 for Mace Head and show a good agreement with the MINOS data. The highest difference is observed for CFC-12 between the MINOS selected clean air data and the Mace Head data. However, the campaign average agrees with the Mace Head August average within the uncertainty range.
3.1 Relationship of variability and lifetime of compounds The lifetimes of the VOCs measured during MINOS vary be-tween about 0.6 days (pentane) and 300 years (CFC-114). It has been shown previously that the variability of a compound and the measurement site are related to the sources and sinks of the compounds (Jobson et al., 1999; Jobson et al., 1998; Junge, 1974; Williams and al., 2000). Jobson et al. (1998) showed empirically that the variability and lifetimes of hy-drocarbons can be linked through the equation SlnX=Aτ−b. SlnX represents the standard deviation of the logarithm of the mixing ratio of hydrocarbon X, τ is the chemical lifetime of the hydrocarbon and A and b are empirical fitting parameters. Jobson et al. (1999) extended this study by examining the variability/lifetime relationship for a larger number of VOCs (hydrocarbons and halocarbons). From these studies, it was proposed that the coefficient b, the dependence of variability on lifetime, reflects the importance of the source/sink budget
in the regional variability of the studied species and varies from b=0 being close to the sources to b=0.5 in remote lo-cations. Since these first studies, the variability concept has been applied to a number of datasets and has proved useful in ascertaining the consistency and quality of measurements and for the estimation of OH concentrations (Williams et al., 2000; Williams et al., 2001, Karl et al., 2001).
The variability concept is based on the assumption that the chosen compounds have, more or less, the same source distribution. To a first approximation this is the case for the compounds reported in this paper, which are mostly of anthropogenic origin. Methyl chloride (chloromethane) and methyl bromide (bromomethane) are exceptions, as they have a globally important oceanic source (Brasseur et al., 1999). However, we note that no clear evidence for an ocean source or sink for either gas could be derived from the vari-ability analysis of samples collected in the southern Pacific marine boundary layer (Colman et al., 1998).
The relationship between the variability and the lifetime of the VOCs measured during the MINOS campaign is shown in Fig. 1. The lifetimes of the reactive compounds were estimated by using the average measured OH value of 4.7×10⁶molecules cm−3 (Berresheim et al., 2003) and by assuming that OH is the only significant sink of these com-pounds. For the long-lived compounds, we used the global mean lifetimes as given by Jobson et al. (1999). A linear relationship of the form SlnX=0.85τ−0.23(R=0.96) was ob-served (Fig. 1). Note that the derived b coefficient is not sensitive to OH within the measurement uncertainty of OH (±30%). The fact that methyl bromide and chloride lie al-most on the line may indicate that their anthropogenic emis-sions govern their variability in this region. However, this cannot be determined unequivocally from the variability plot. The coefficient A, which relates to the range of air mass ages, is low (0.85), suggesting a narrow distribution of air mass ages. This is consistent with the range of the air mass ages estimated with toluene/benzene ratios (15–35 h, Salis-bury et al., 2003) and ethylbenzene/acetophenone ratios (15– 59 h, Xu et al., 2003). The coefficient b of this study has an absolute value of 0.23 and is significantly lower than the value of ∼0.5 found during PEM-West B and at Amsterdam Island in the Indian Ocean (Jobson et al., 1999; Williams et al., 2001) but higher than the value of 0.18 found for the Harvard Forest site (Jobson et al., 1999). This suggests that Finokalia represents intermediate conditions between remote sites (where the variability is strongly dependent on the life-time) and sites in the vicinity of sources (where sources dic-tate the variability, not the chemistry). In addition, the rela-tively quite high scatter observed on the plot suggests a wide variety of sources which are discussed further below. This is consistent with the back-trajectory analysis, which showed that several regions in Europe, and particularly in eastern Europe, influenced the air composition of Crete during the MINOS experiment (Salisbury et al., 2003).
0.1 1 10 100 1000 10000 100000 0.01 0.1 1 CFC-113 OH = 4.7 106 m olecules cm-3 CCl4 HCFC-142b HCFC-22 CH3CCl3 n-butane n-pentane i-pentane
Variability versus lifetim e
CFC-114 CFC-12 CHCl3 CH2Cl2 CH3Cl CH3Br benzene propane i-butane
Sln(X) = 0.85
τ -0.23R=0.96
Sl
n
(X)
lifetim e (days)
Fig. 1. Variability (standard deviation of ln[mixing ratio]) against lifetime for the VOCs measured during the MINOS campaign.
In order to characterize the anthropogenic sources influ-encing the observations during MINOS better, the next sec-tions will be dedicated to more detailed analyses of some specific compounds.
3.2 Fossil fuel and biomass combustion 3.2.1 Temporal variations of propane
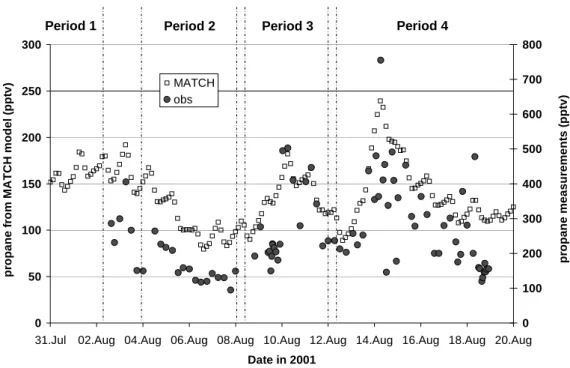
Figure 2 presents the propane volume mixing ratios observed during the MINOS campaign (the propane values calculated with the global model MATCH are also presented on this graph and will be discussed in the next section). The classifi-cation of time periods is based on the variations of CO, black carbon (BC) and other compounds, and on back-trajectory calculations. More details about the definition of these pe-riods can be found in Salisbury et al. (2003) and only a brief summary is given here. During period 1 (no VOC mea-surements during this period), air originating in Eastern Eu-rope was observed. During period 2, the air originated above the boundary layer in Western Europe and was advected ap-proximately east-south-east before descending and turning south-west over the Black Sea and north-western Turkey. Pe-riod 3 corresponds to a highly polluted event, mainly due to biomass burning emissions, originating from eastern Europe. Finally, period 4 corresponds to mixed trajectory origins, as-sociated with some regional influence.
Although some scatter is associated with the data, the ob-served propane variations reflect clearly the air mass changes between periods. In period 2, the lowest values of propane
(∼120 pptv) were observed. This is consistent with photo-chemically aged air descending from the free troposphere without recent contact with pollution sources. During pe-riod 3, significantly enhanced propane mixing ratios (up to 500 pptv) were observed, consistent with the corresponding high levels of CO and BC which have been attributed to the influence of biomass burning by reference to acetonitrile. We note that methyl chloride and benzene, two compounds emit-ted by biomass burning, presenemit-ted large enhancements (up to 40% for methyl chloride and to a factor of 6 for benzene) during this period. The transition between period 3 and 4 was characterized by average levels of propane (∼200 pptv) which reached high concentrations (up to 750 pptv) during period 4, consistent with some regional influence which was also evident from other compounds. Propane showed a large degree of scattering during period 4, reflecting the mixed ori-gin of the air during that time.
3.2.2 Comparison with the global model MATCH
Figure 2 also shows the propane mixing ratios calculated by the MATCH-MPIC chemistry-transport model (Model of At-mospheric Transport and CHemistry – Max Planck Institute for Chemistry version). MATCH is a global atmospheric of-fline model, which can be driven by different meteorological datasets. Here the National Center for Environmental Pre-diction (NCEP) meteorological data at a horizontal resolu-tion of about 2.8◦×2.8◦with 42 levels are used. MATCH is driven by meteorological parameters from the air mass tra-jectory re-analysis (Lawrence et al., 2003). The chemical
0 50 100 150 200 250 300
31.Jul 02.Aug 04.Aug 06.Aug 08.Aug 10.Aug 12.Aug 14.Aug 16.Aug 18.Aug 20.Aug Date in 2001 p ropane fr om MATCH m odel ( pp tv ) 0 100 200 300 400 500 600 700 800 p ropane m easu re m e n ts (pp tv ) MATCH obs
Period 1 Period 2 Period 3 Period 4
Fig. 2. Propane measurements during MINOS (closed circles, right-hand axis) and propane calculations from MATCH (open squares,
left-hand axis). See text for the definition of periods.
scheme includes CH4-CO-HOx-NOx “background”
chem-istry, a simplified representation of isoprene chemchem-istry, ex-plicit ethane (C2H6) chemistry along with simpler
repre-sentations of propane (C3H8), ethylene (C2H4), propylene
(C3H6)and n-butane (C4H10)chemistry. The latter species
is used as a surrogate for all higher alkanes. A complete description of the model can be found in Lawrence et al. (1999), von Kuhlmann (2001), von Kuhlmann et al. (2003a) and references therein and comparisons with the MINOS flight data are given in Lawrence et al. (2003). As propane is treated specifically, it is therefore the measured organic species most appropriate to directly compare with the model. The model reproduces the main features observed during the campaign quite well, especially showing higher levels of propane during periods 3 and 4 and lower levels during period 2 and during the transition between period 3 and 4. However, the simulated mixing ratios of propane are lower than the observed data by a factor of 1.5 (background condi-tions) to 3 (polluted event observed in period 4).
The deviation between the modelled concentrations and our observations might have various causes, ranging from measurement errors, local influences in our measurements, erroneous modelling of eastern Mediterranean meteorology or inaccuracies in the emission data. We can rule out the first hypothesis, as the uncertainty in the measurements, es-timated to be lower than 15% (Sect. 2.3), cannot account for the observed discrepancy between model and measure-ment. Local source influences did not cause the difference either; based on our interpretation of Fig. 1 (Sect. 3.1), the Finokalia site is hardly affected by local sources. Finally,
Table 2. Total NMVOC emissions in kt NMVOC in EDGAR database, except for biofuel and biomass burning emissions (source: v2.0, Olivier et al., 1996; v3.2, Olivier et Berdowski, 2001)
V2.0 (1990) V3.2 (1990) V3.2 (1995) Greece 244 291 312 Turkey 983 559 643 Ukraine 1980 7548 6736
errors in the model calculation are most likely not responsi-ble for the discrepancy between model and measurement re-sults: the model captures well the main variations of propane observed during MINOS, which indicates that the meteorol-ogy and the chemistry used in the model are realistic. Also, the modelled CO is very well correlated (r=0.73) with the flight data (Lelieveld et al., 2002). Therefore, an underes-timation of the propane emissions used in the model is the most likely reason for the discrepancy. We note that propane concentrations simulated with the MATCH model were al-ready compared to propane observations at several locations and that a reasonable agreement was found for northern Eu-rope while an underestimation by a factor of 2 was found over North America (von Kuhlmann et al., 2003b). The dis-crepancy between measurements and model is therefore re-gionally dependent, which is consistent with the hypothesis that the problem comes from the emissions database. We will now dedicate the next section to discuss the propane emis-sions used for the MINOS comparison.
3.2.3 Emissions of propane
The propane emissions used in the model calculations were compiled by von Kuhlmann et al. (2003a). Emissions from energy and industrial activities (except for biofuel emissions) were taken from the Emission Database for Global Atmo-spheric Research (EDGAR v2.0, Olivier et al., 1996; Olivier et al., 1999a). Biomass burning emissions (including biofuel) were included by von Kuhlmann et al. (2003a) based on emission factors presented by Andreae and Merlet (2001). These emission factors were used to calculate a propane/CO emission ratio (biomass burning) for each type of biomass which was used to scale the CO emission distribution of Galanther et al. (2000). Together with emissions from the energy/industry system (5.4 Tg), biomass burning emissions (1.7 Tg) account for 95% of the global budget of 7.4 Tg.
The discrepancy between model and observations is ob-served for the whole campaign, including the beginning of the campaign where biomass burning influence was very low (Salisbury et al., 2003). Therefore, we will focus on possible errors in the energy/industry emission estimates and we will discuss successively four points: i) total VOC estimates, ii) speciation of the VOCs, iii) seasonal variation and iv) impor-tance of the year of the simulation.
i) In EDGAR, the total NMVOC (non-methane volatile organic compound) emissions were calculated using an emission factor approach. This emission might be inac-curate due to poorly known emission factors or activity data. In Olivier et al. (1999b) the uncertainty of the NMVOC emissions is estimated to be “medium” (50%) for fossil fuel related emissions and “large” (>100%) for non fossil fuel emissions.
ii) The calculation of propane emissions in EDGAR are based on the application of sector-fuel specific NMVOC profiles which assign the fraction of each of 25 dif-ferent NMVOC compounds from the total NMVOC emission. An inaccurate speciation of the compounds could also lead to a wrong estimation of propane emis-sion. However, a calculation performed on the ra-tios of butanes/propane and pentanes/propane observed during MINOS suggests that the speciation provided by EDGAR is consistent with our measurements (see Sect. 3.2.4). This would further suggest that butane and pentane emissions are also similarly underestimated in the EDGAR database.
iii) A third possible source of inaccuracy in the emission figures is that the energy/industry emissions are pro-vided as total annual emissions. This means that the total propane emission was distributed uniformly over the year so that temporal variations such as seasonal changes or particular emission events are not taken into account.
iv) Finally, the MATCH model simulation was performed with EDGAR v2.0 emission values that are represen-tative for the year 1990. A detailed propane emis-sion inventory for more recent years is not available at the moment. The question arises if and to what extent emissions of propane within the study domain have increased over the period 1990–2001. An indica-tion of a possible increase in propane emissions can be found when looking at the recently constructed EDGAR v3.2 emission inventory. This inventory presents for to-tal NMVOCs (not speciated) an update of 1990 emis-sions and an estimate of 1995 emisemis-sions. For countries that have a large influence on the MINOS observations (Greece, Turkey and Ukraine) the NMVOC emissions according to EDGAR v2.0 and EDGAR 3.2 are pre-sented in Table 2. The results for total NMVOCs show both a systematic error in the calculation of Ukrainian emissions in version 2.0 and that emissions for more recent years (1995) are a factor 3.5 higher than the Ukrainian emissions used in the model calculations. For Greece and Turkey some small difference can be found. If this difference in total NMVOC emissions is also found in the propane emissions, then the discrep-ancy between model and observation can probably be explained by an underestimation of propane emissions in the Ukraine and maybe in other countries from the former Soviet Union. This could not be verified, since EDGAR v3.2 propane emissions are not yet available. The discrepancy between v3.2 and v2.0 for the year 1990 can largely be explained by the fact that in v2.0 Ukrainian emissions were calculated based on statistics from the total former Soviet Union, which were scaled to sub-regions based on e.g. population distributions. However, statistics have been revised in the past few years, new sources have been added and emission fac-tors have been revised for some sources. During the construction of v3.2, country specific energy and in-dustry statistics were available for the Ukraine (J. G. J. Olivier, personal communication).
3.2.4 Photochemical processing of the alkanes observed during MINOS
Assuming Lagrangian transport and that the only process affecting the ratio butane/propane (pentane/propane) since emission is the reaction with OH, one can easily derive the evolution of these ratios with time, as follows:
[A]F/[B]F = [A]S/[B]S×exp((kB−kA) × [OH] × 1t) (1) with
[A]mixing ratio of the compound A, the subscripts F and S stand for Finokalia and emission source region, respectively. kA: reaction rate of the compound A with OH
[OH]: OH concentration 1t: transport time
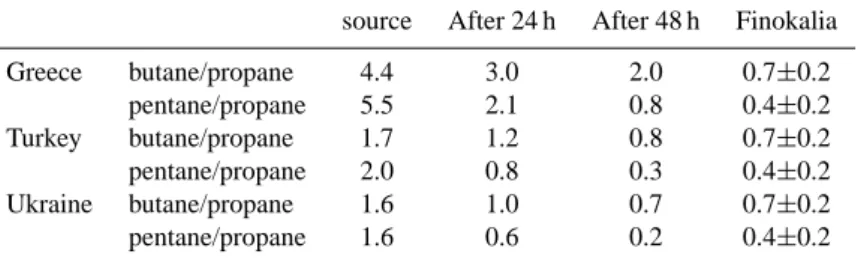
Table 3. Butanea/propaneband pentanec/propanebratios at the emission point (EDGAR database v2.0, Olivier et al., 1996), after chemical processing (see text) and observed at Finokalia.
source After 24 h After 48 h Finokalia Greece butane/propane 4.4 3.0 2.0 0.7±0.2 pentane/propane 5.5 2.1 0.8 0.4±0.2 Turkey butane/propane 1.7 1.2 0.8 0.7±0.2 pentane/propane 2.0 0.8 0.3 0.4±0.2 Ukraine butane/propane 1.6 1.0 0.7 0.7±0.2 pentane/propane 1.6 0.6 0.2 0.4±0.2 ak
OH=2.26 10−12cm3molecule−1s−1, Donahue et al. (1998)
bk
OH=1.09 10−12cm3molecule−1s−1, Donahue et al. (1998)
ck
OH=3.92 10−12cm3molecule−1s−1, Donahue et al. (1998), Baulch et al. (1986)
Ratios of butanes/propane and pentanes/propane were con-sidered for this calculation. For comparison with the cat-egories defined in the EDGAR database, iso and n-butane were aggregated in butanes and iso- and n-pentane in pen-tanes and the average reaction rate was considered (Baulch, 1986; Donahue et al., 1998). Emissions of the alkanes were extracted from the EDGAR database v2.0 (Olivier et al., 1996) for Greece, Turkey and Ukraine, three countries which likely had the most influence on the observations performed during MINOS. The values reported for Finokalia represent the average of the ratio (and its standard deviation) for the first part of the campaign (until end of period 2). Only the first part of the campaign has been considered in order to ex-clude periods which were affected by different emissions (na-ture of the emission and/or geographical origin of the emis-sion). The concentration of OH was taken as the mean value measured during periods 1 and 2 (4.0×10⁶molecules cm−3,
Berresheim et al., 2003). Finally, transport times of 24 h and 48 h were considered to cover the range estimated by using toluene/benzene (Salisbury et al., 2003) and ethylben-zene/acetophenone ratios (Xu et al., 2003) for the corre-sponding periods.
Butane/propane and pentane/propane ratios at the emis-sion point, after chemical processing (24 h and 48 h) and observed at Finokalia are shown in Table 3. Keeping in mind the limitations of this rough calculation, one can note that emissions from Turkey and Ukraine probably influenced the observations made during the first part of MINOS most strongly. Indeed, both observed ratios (butane/propane and pentane/propane) are consistent with emissions from these countries and transport times ranging from 24 h to 48 h.
Comparing our observations with the few other measure-ments of hydrocarbons performed in non-urban areas of Greece shows that the mixing ratios were in the same abso-lute concentration range for the C3–C5 hydrocarbons (Bon-sang et al., 1999, Moschonas, 2000). However, we note that the VOC ratios were different in all three campaigns, reflect-ing different emission sources (the other studies were
per-formed over continental Greece, and were certainly more af-fected by Greek emissions) and different extents of photo-chemical processing.
3.3 Anthropogenic solvent emission
3.3.1 Temporal variation of methyl chloroform
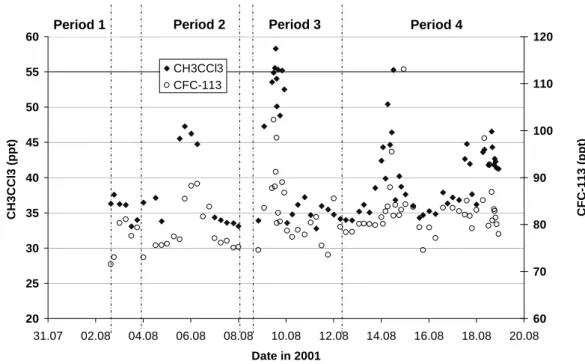
Methyl chloroform (1.1.1. trichloroethane) has been widely used over the last 40 years as a solvent. However, its capac-ity to release chlorine in the stratosphere (leading to ozone destruction) has led to the phasing out of its production. This phasing out, initially planned for 2005 (Montreal pro-tocol and London amendment), has been brought forward to 1996 for developed countries (Copenhagen amendment; McCulloch and Midgley, 2001). Therefore, methyl chloro-form (MCF) emissions are now considered to be almost zero for mid-latitude countries in the northern hemisphere. The measured methyl chloroform mixing ratios during MINOS are shown in Fig. 3 and show large peaks on 5, 9 and 14 August. Since biomass burning is a small source of MCF (Rudolph et al., 2000), the observed simultaneous enhance-ments of CFC-113 indicate that other anthropogenic sources caused the MCF peaks observed during MINOS (Fig. 3). The good correlation (R2=0.5 for the whole campaign) observed between MCF and CFC-113 (CCl2FCClF2), whose
applica-tions are similar to those of methyl chloroform, clearly indi-cate that significant emissions of these compounds still occur in Europe.
These peaks cause the relatively high variability of MCF, which pulls its value above the linear fit line in Fig. 1. If emissions had ceased, MCF should be below the line de-fined by species that still have source-generated variability, as was observed in data collected in the remote southern In-dian Ocean (Warneke and de Gouw, 2001).
Finally, one should note that the increase of methyl chloro-form and CFC-113 observed during period 3 clearly indicates that the large pollution event attributed to biomass burning emissions (Salisbury et al., 2003) also included some other
20 25 30 35 40 45 50 55 60 31.07 02.08 04.08 06.08 08.08 10.08 12.08 14.08 16.08 18.08 20.08 Date in 2001 CH3CCl 3 ( ppt ) 60 70 80 90 100 110 120 CFC-113 ( ppt ) CH3CCl3 CFC-113
Period 1 Period 2 Period 3 Period 4
Fig. 3. Methyl chloroform and CFC-113 mixing ratios during MINOS.
anthropogenic emissions, at least on 9 August. In addition, a peak in propane was observed on 14 August which was not the case on 9 August. This likely indicates that the two events did not have the same source origin, which suggests that the significant methyl chloroform enhancements on 9 and 14 Au-gust may have originated in different countries.
3.3.2 Emissions strength of methyl chloroform
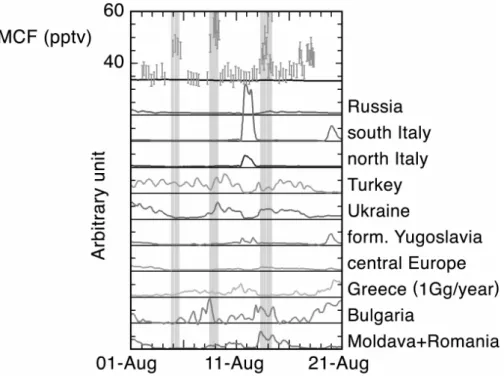
To evaluate the origin of the methyl chloroform emis-sions, we used an atmospheric-tracer transport model (Tracer Model, version 5: TM5) which allows studying the European region with a horizontal resolution of 1◦ by 1◦. Vertically, 25 layers are used, which are mostly located in the bound-ary layer and in the free troposphere. The reference simu-lation of the model considers a total emission of 1 Tg/year methyl chloroform for Europe. Sensitivity simulations were performed by considering an additional methyl chloroform source (equivalent to 10 Tg/year) for the different European countries whose emissions may have influenced observations in Crete (Krol et al., 2003). The only exception to this proce-dure was for continental Greece, where the enhancement was only of 1 Gg/year (otherwise its proximity to Finokalia would lead to an unrealistically large impact). The results shown in Fig. 4 demonstrate that the main source of MCF observed at Finokalia on the 5 August could have been from Turkey, with possible contributions from Bulgaria and Greece, while the 9 August event corresponds to possible impacts from both Turkey and Ukraine (this last country signed the Copenhagen amendment in April 2002). The increase in methyl chloro-form observed on 14 August could be attributed to Ukraine,
but also to Bulgaria or Romania. It should be noted that con-tributions from the Caucasus region (not included in this sim-ulation), where high levels of MCF have been reported pre-viously (Folberth et al., 2000, 2003), cannot be excluded.
3.3.3 Implication for OH calculation
Methyl chloroform has received much attention recently be-cause its known anthropogenic emissions could help to in-directly determine the global mean OH concentration and trend (Spivakovsky et al., 2000; Prinn et al., 2001; Krol and Lelieveld, 2003 and references therein). Recently, Prinn et al. (2001) derived a strong negative trend of OH over the last decade, based on the assumption that emissions of MCF have ceased. However, during MINOS and other experiments per-formed in Europe (Krol et al., 2003), it has been shown that significant methyl chloroform emissions still take place in some parts of Europe. Therefore, the uncertainty associated with the current MCF emissions makes any conclusion on OH distribution and trend difficult. In particular, the previ-ously derived trend is probably exaggerated and tropospheric OH may have been relatively constant over the last decade (Krol et al., 2003).
It is nevertheless important to note that these emissions (MCF and CFC-113) are still relatively small and that they will not have a significant adverse effect on the predicted re-covery of stratospheric ozone.
Fig. 4. Top panel: Methyl chloroform observations during MINOS and reference simulation of the model (black line going through the
lowermost observations). Lower panels: sensitivity simulations for methyl chloroform emissions for different European regions (see text for details).
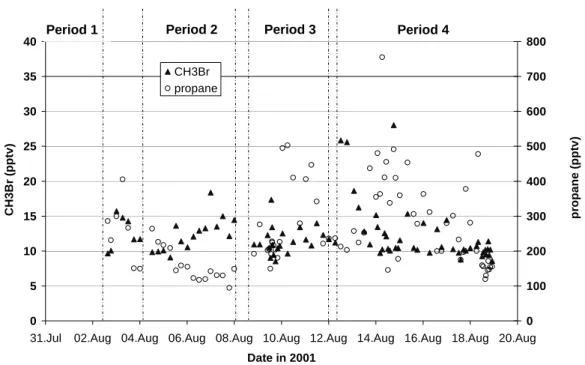
3.4 Anthropogenic agricultural emissions (methyl bro-mide)
The methyl bromide (CH3Br) measurements are shown in
Fig. 5 together with the previously discussed propane results. Along with its natural source from the ocean, methyl bro-mide is emitted by biomass burning, produced industrially and used for agricultural purposes (Schauffler et al., 1999 and references therein). Fumigation of soils before plant-ing is the largest splant-ingle use of CH3Br worldwide (over 80%,
(Lee-Taylor et al., 1998)).
The first point to note from Fig. 5 is that the methyl bromide mixing ratios observed on 7 August (defined as a “clean” day) were slightly higher than the overall mean (see Table 1). This is due to the definition of the “clean” period, which was chosen as the day the least influenced by recent pollution based on the low values of fossil fuel derived hy-drocarbons measured that day. Due to the longer lifetime of methyl bromide, some older polluted air masses could still contain elevated concentrations of CH3Br. Alternatively, the
fact that CH3Br has specific anthropogenic sources resulting
from agricultural activity could also explain this feature. Second, although biomass burning is estimated to con-tribute about 15% to the global budget of CH3Br (Lee-Taylor
et al., 1998), no significant enhancement of this compound was observed during the polluted event of period 3 where biomass burning influences predominated (Sect. 3.2). We note that considerable variability in the emission ratios of
CH3Br emitted by biomass burning processes has been
re-ported in the literature, depending strongly on the bromine content of the fuel and on the proportion of flaming to smol-dering combustion (Andreae and Merlet, 2001). However, even if we consider the upper limit of published CH3Br
emission factors versus CO (Blake et al., 1996 and refer-ences therein), the 100 ppbv CO enhancement observed dur-ing this episode (Salisbury et al., 2003) would lead to a CH3Br enhancement of about 1 pptv. This value, which
rep-resents the maximum expected impact, is only slightly higher than our analytical precision, which would explain why there is no significant enhancement of methyl bromide during the biomass burning episode.
Finally, although most of the measurements lie between 10 and 15 pptv, Fig. 5 shows that one noticeable peak of CH3Br was observed on 12 August, with two values higher
than 25 pptv, which then progressively decreased to 13 pptv (16 hours after the maximum). This peak is significant with respect to instrumental uncertainty and indicates that this compound was being emitted at this time. As no other measured VOC showed a concomitant increase, this peak of methyl bromide likely reflects the influence of a specific source of this compound. According to Fig. 4, which shows the sensitivity of the measurements to the emission regions, a large contribution from south/north Italy was observed on 12 August. As Italy is the largest consumer of CH3Br as soil
fumigant in Europe and the third most important worldwide (ICF, 1997 and references therein), it is plausible that this
0 5 10 15 20 25 30 35 40
31.Jul 02.Aug 04.Aug 06.Aug 08.Aug 10.Aug 12.Aug 14.Aug 16.Aug 18.Aug 20.Aug Date in 2001 CH3Br ( pp tv ) 0 100 200 300 400 500 600 700 800 p ropane (pp tv ) CH3Br propane
Period 1 Period 2 Period 3 Period 4
Fig. 5. Methyl bromide and propane mixing ratios during MINOS.
specific source of methyl bromide was responsible for the higher levels observed on the 12 August. While we cannot completely rule out the contribution of other specific sources of methyl bromide (such as salt marshes), we conclude that fumigant emissions from Italy are the most probable.
4 Summary and conclusions
The MINOS campaign provided a good opportunity to in-vestigate the anthropogenic origin of several VOCs from ropean sources, in particular from southern and eastern Eu-rope. By studying the variations observed during the cam-paign, we have derived information about the anthropogenic emissions of propane, methyl chloroform and methyl bro-mide. Propane, mainly emitted by fossil fuel and industrial processes, was compared with the simulated propane from the global model MATCH-MPIC. While the model repro-duces the general features of propane variations quite well, it underestimates significantly its mixing ratios, which is at-tributed to an underestimation of the emissions (provided by the global database EDGAR). Initial investigations suggest that the total amount of VOCs accounted for in the database in some countries is too low, but further research is needed to address this issue. Emission inventories urgently need up-dating if models are to be usefully compared with measure-ments.
Special attention has also been dedicated to the interpreta-tion of the methyl chloroform measurements, as some unex-pected deviations from the background were observed during MINOS. This observation, complementing other
measure-ments in Europe, shows that methyl chloroform emissions still occur in Europe. These emissions need to be precisely quantified if the method of OH estimation (distribution and trend) based on methyl chloroform is to be further applied.
The methyl bromide measurements indicated that no sig-nificant regional biomass burning sources were detected. Variations of CH3Br were not associated with fossil fuel
us-age but with a specific source region (Italy) and most proba-bly associated with agricultural fumigant usage.
Acknowledgements. We would like to thank all the participants to
the MINOS campaign. Special thanks to L. Lange, A. Roemp and X. Xu for collecting samples and N. Mihalopoulos (ECPL, Greece) for fruitful discussions. We are also grateful to J. Olivier and J. Peters (RIVM, The Netherlands) for providing additional informa-tion on the EDGAR emission database. V. Gros acknowledges the joint support from the Max Planck Society and the CNRS. The Na-tional Center for Atmospheric Research is operated by the Univer-sity Corporation for Atmospheric Research under the sponsorship of the National Science Foundation.
References
Andreae, M. O. and Merlet, P.: Emission of trace gases and aerosols from biomass burning, Global Biogeochemical Cycles, 15 (4), 955–966, 2001.
Baulch, D. L. B., Malcolm, D. G., and Tuckersman, R. T.: Evalu-ated kinetic data for high-temperature reactions, Volume 5. Part 1.: Homogeneous gas phase reactions of the hydroxyl radical with alkanes, Journal of Physical and Chemical Reference Data, 15 (465), 1986.
Blake, N. J., Blake, D. R., Sive, B. C., Chen, T. Y., Rowland, F. S., Collins, J. E., Sachse, G. W., and Anderson, B. E.: Biomass burn-ing emissions and vertical distribution of atmospheric methyl halides and other reduced carbon gases in the South Atlantic re-gion, Journal of Geophysical Research-Atmospheres, 101 (D19), 24 151–24 164, 1996.
Berresheim, H., Plass-D¨ulmer, C., Elste, T., Mihalopoulos, N., and Rohrer, F.: OH in the coastal boundary layer of Crete during MINOS: Measurements and relationship with ozone photolysis, Atmos. Chem. Phys., 3, 639–649, 2003.
Bonsang, B., Stephanou, E., Pio, C., and Seakins, P.: Aerosols For-mation from Biogenic Organic Carbon (AEROBIC), Eur. Comm. – DG XII, Brussels, 1999.
Brasseur, G. P., Orlando, J. J., and Tyndall, G. S. (Ed.): Atmo-spheric Chemistry and Global Change, Oxford University Press, pp. 291–321, 1999.
Colman, J. J., Blake, D. R., and Rowland, F. S.: Atmospheric resi-dence time of CH3Br estimated from the Junge spatial variability relation, Science, 281 (5375), 392–396, 1998.
Donahue, N. M., Anderson, J. G., and Demerjian, K. L.: New rate constants for ten OH alkane reactions from 300 to 400 K: an as-sessment of accuracy, J. Phys. Chem. A, 102, 3121–3126, 1998. Folberth, G., Pfister, G., Baumgartner, D., Putz, E., Weissflog, L., and Elansky, N. P.: ECCA – Ecotoxicological Risk in the Caspian Catchment Area, Techn. Report for EU No. 1/2000, 156p., Inst. for Geophys.,Astrophys., and Meteorol., Univ. of Graz, Austria, 2000.
Folberth, G., Pfister, G., Putz, E., Weissflog, L., and Elansky, N. P.: The annual course of TCA formation in the lower troposphere: a modeling study, Environmental Pollution, 124, 389–405, 2003. Galanter, M., Levy, H., and Carmichael, G. R.: Impacts of biomass
burning on tropospheric CO, NOx, and O3, Journal of
Geophys-ical Research, 105, 6633–6653, 2000.
ICF: Methyl bromide use background document, Memorandum prepared for the U.S. Environmental Protection Agency, Strato-spheric Protection Division, ICF Incorporated, Washington D.C., 2 April 1996, 1997.
Jobson, B. T., McKeen, S. A., Parrish, D. D., Fehsenfeld, F., Blake, D. R., Goldstein, A. H., Schauffler, S. M., and Elkins, J. W.: Trace gas mixing ratio variability versus lifetime in the tropo-sphere and stratotropo-sphere: Observations, Journal of Geophysical Research, 104, 16 091–16 113, 1999.
Jobson, B. T., Parrish, D. D., Goldan, P., Kuster, W., Fehsenfeld, F. C., Blake, D. R., Blake, N. J., and Niki, H.: Spatial and tem-poral variability of nonmethane hydrocarbon mixing ratios and their relation to photochemical lifetime, Journal of Geophysical Research-Atmospheres, 103 (D11), 13 557–13 567, 1998. Junge, C. E.: Residence time and variability of tropospeheric trace
gases, Tellus, 26, 477–488, 1974.
Karl, T., Crutzen, P. J., Mandl, M., Staudinger, M., Guenther, A., Jordan, A., Fall, R., and Lindinger, W.: Variability-lifetime rela-tionship of VOCs observed at the Sonnblick Observatory 1999-estimation of HO-densities, Atmospheric Environment, 35 (31), 5287–5300, 2001.
Krol, M. and Lelieveld, J.: Can the variability in tropospheric OH be deduced from measurements of 1,1,1-trichloroethane (methyl chloroform)? J. Geophys. Res., 108 (D3): art. no. 4125 FEB 12 2003.
Krol, M. C., Lelieveld, J., Oram, D. E., Sturrock, G. A., Penkett,
S. A., Brenninkmeijer, C. A. M., Gros, V., Williams, J., and Scheeren, H. A.: Continuing emissions of methyl chloroform from Europe, Nature, 421, 131–135, 2003.
Lawrence, M. G., Crutzen, P. J., Rasch, P. J., Eaton, B. E., and Ma-howald, N. M.: A model for studies of tropospheric photochem-istry: Description, global distributions, and evaluation., Journal of Geophysical Research, 104, 26 245–26 277, 1999.
Lawrence, M. G., Rasch, P. J., von Kuhlmann, R., Williams, J., Fischer, H., Reus, M. D., Lelieveld, J., Crutzen, P. J., Schultz, M., Stier, P., et al.: Global chemical weather forecasts for field campaign planning: Predictions and observations of large-scale features during MINOS, CONTRACE and INDOEX, Atmos. Chem. Phys., 3, 267–289, 2003.
Lee-Taylor, J. M., Doney, S. C., Brasseur, G. P., and Muller, J. F.: A global three-dimensional atmosphere-ocean model of methyl bromide distributions, Journal of Geophysical Research-Atmospheres, 103 (D13), 16 039–16 057, 1998.
Lelieveld, J., Berresheim, H., Borrmann, S., Crutzen, P. J., Den-tener, F. J., Fischer, H., Feichter, J., Flatau, P. J., Heland, J., Holzinger, R., et al.: Global air pollution crossroads over the Mediterranean, Science, 298 (5594), 794–799, 2002.
Mak, J. E. and Brenninkmeijer, C. A. M.: Compressed air sample technology for isotopic analysis of atmospheric carbon monox-ide, J. Atmos. Ocean Tech., 11, 425–431, 1994.
McCulloch, A. and Midgley, P. M.: The history of methyl chloro-form emissions: 1951–2000, Atmospheric Environment, 35 (31), 5311–5319, 2001.
Moschonas, N. and Glavas, S.: Non-methane hydrocarbons at a high-altitude rural site in the Mediterranean (Greece), Atmo-spheric Environment, 34 (6), 973–984, 2000.
Namiesnik, J. and Wardencki, W.: Water vapour removal from gaseous samples used for analytical purposes: A review, Intern. J. Environ. Anal. Chem., 73, 269–280, 1999.
Olivier, J. G. J., Bouwman, A. F., van de Maas, C. W. M., Berdowski, J. J. M., Veldt, C., Bloos, J. P. J., Visschedijk, A. J. H., Zandveld, P. Y. J., and Haverlag, J. L.: Description of EDGAR Version 2.0: A set of emission inventories of green-house gases and ozone depleting substances for all anthropogenic and most natural sources on a per country basis and on 1◦×1◦ grid., National Institute of Public Health and the Environment, Bilthoven, 1996.
Olivier, J. G. J., Bouwman, A. F., Berdowski, J. J. M., Veldt, C., Bloos, J. P. J., Visschedijk, A. J. H., van de Maas, C. W. M., and Zandveld, P. Y. J.: Sectoral emission inventories of greenhouse gases for 1990 on a per country basis as well as on 10×10, Envi-ronmental. Science and Policy, 2, 241–264, 1999a.
Olivier, J. G. J., Bloos, J. P. J., Berdowski, J. J. M., Visschedijk, A. J. H., and Bouwman, A. F.: A 1990 global emission inventory of anthropogenic sources of carbon monoxide on 1◦×1◦ devel-oped in the framework of EDGAR/GEIA, Chemosphere – Global Change Science, 1 (1-3), 1–17, 1999b.
Olivier, J. G. J. and Berdowski, J. J. M.: Global emissions sources and sinks. In: Berdowski, J., Guicherit, R. and Heij, B. J. (Eds.), “The Climate System”, pp. 33–78. A.A. Balkema Pub-lishers/Swets & Zeitlinger Publishers, Lisse, The Netherlands. ISBN 90 5809 255 0, 2001.
Prinn, R. G., Weiss, R. F., Fraser, P. J., Simmonds, P. G., Cunnold, D. M., Alyea, F. N., O’Doherty, S., Salameh, P., Miller, B. R., Huang, J., et al.: A history of chemically and radiatively
impor-tant gases in air deduced from ALE/GAGE/AGAGE, Journal of Geophysical Research-Atmospheres, 105 (D14), 17 751–17 792, 2000.
Prinn, R. G., Huang, J., Weiss, R. F., Cunnold, D. M., Fraser, P. J., Simmonds, P. G., McCulloch, A., Harth, C., Salameh, P., O’Doherty, S., et al.: Evidence for substantial variations of at-mospheric hydroxyl radicals in the past two decades, Science, 292 (5523), 1882–1888, 2001.
Rudolph, J., von Czapiewski, K., and Koppmann, R.: Emissions of methyl chloroform (CH3CCl3)from biomass burning and the tropospheric methyl chloroform budget, Geophysical Research Letters, 27 (13), 1887–1890, 2000.
Ryall, D. B., Derwent, R. G., Manning, A. J., Simmonds, P. G., and O’Doherty, S.: Estimating source regions of European emissions of trace gases from observations at Mace Head, Atmospheric En-vironment, 35 (14), 2507–2523, 2001.
Salisbury, G., Williams, J., Holzinger, R., Gros, V., Mihalopou-los, N., Vrekoussis, M., Sarda-Esteve R., Berresheim, H., von Kuhlmann, R., Lawrence, M., and Lelieveld, J.: Ground-based PTR-MS measurements of reactive organic compounds dur-ing the MINOS campaign in Crete, July–August 2001, Atmos. Chem. Phys., 3, 925–940, 2003.
Schauffler, S. M., Atlas, E. L., Blake, D. R., Flocke, F., Lueb, R. A., Lee-Taylor, J. M., Stroud, V., and Travnicek, W.: Distributions of brominated organic compounds in the troposphere and lower stratosphere, Journal of Geophysical Research-Atmospheres, 104 (D17), 21 513–21 535, 1999.
Schauffler, S. M., Atlas, E. L., Donnelly, S. G., Andrews, A., Montzka, S. A., Elkins, J. W., Hurst, D. F., Romashkin, P. A., Dutton, G. S., and Stroud, V.: Chlorine budget and partitioning during the Stratospheric Aerosol and Gas Experiment (SAGE) III Ozone Loss and Validation Experiment (SOLVE), Journal of Geophysical Research-Atmospheres, 108 (D5), art. no.-4173, 2003.
Spivakovsky, C. M., Logan, J. A., Montzka, S. A., Balkanski, Y. J., Foreman-Fowler, M., Jones, D. B. A., Horowitz, L. W., Fusco, A. C., Brenninkmeijer, C. A. M., Prather, M. J., et al.: Three-dimensional climatological distribution of tropospheric OH: update and evaluation, Journal of Geophysical Research, 105, 8931–8980, 2000.
von Kuhlmann, R.: Tropospheric Photochemistry of Ozone, its Precursors and the Hydroxyl Radical: A 3D-Modeling Study Considering Non-Methane Hydrocarbons, University of Mainz, Mainz, available at http://www.mpch-mainz.mpg.de/
∼kuhlmann, 2001.
von Kuhlmann, R., Lawrence, M. G., Crutzen, P. J., and Rasch, P. J.: A Model for Studies of Tropospheric Ozone and Non-Methane Hydrocarbons: Model Description and Ozone Results, J. Geo-phys. Res., 108 (D9): art. no. 4294 MAY 13 2003.
von Kuhlmann, R., Lawrence, M. G., Crutzen, P. J., and Rasch, P. J.: A Model for Studies of Tropospheric Ozone and Non-Methane Hydrocarbons: Model Evaluation of Ozone Related Species, J. Geophys.Res., doi: 10.1019/2002JD003348, in press, 2003b. Warneke, C. and de Gouw, J. A.: Organic trace gas composition
of the marine boundary layer over the northwest Indian Ocean in April 2000, Atmospheric Environment, 35 (34), 5923–5933, 2001.
Williams, J., Fischer, H., Harris, G. W., Crutzen, P. J., Hoor, P., Hansel, A., Holzinger, R., Warneke, C., Lindinger, W., Scheeren, B. and Lelieveld J.: Variability-lifetime relationship for organic trace gases: A novel aid to compound identification and estima-tion of HO concentraestima-tions, Journal of Geophysical Research, 105 (D16), 20 473–20 486, 2000.
Williams, J., Gros, V., Bonsang, B., and Kazan, V.: The HO cy-cle in 1997 and 1998 over the southern Indian Ocean derived from CO, Radon and hydrocarbon measurements made at Am-sterdam Island, Journal of Geophysical Research, 106, 12 719– 12 726, 2001.
Xu, X., Williams, J., Plass-Duelmer, C., Berresheim, H., Salisbury, G., Lange, L., and Lelieveld, J.: GC×GC measurements of C7– C11 aromatic and n-alkane hydrocarbons on Crete, in air from Eastern Europe during the MINOS Campaign, Atmos. Chem. Phys. Discuss., 3, 1477–1513, 2003.
![Fig. 1. Variability (standard deviation of ln[mixing ratio]) against lifetime for the VOCs measured during the MINOS campaign.](https://thumb-eu.123doks.com/thumbv2/123doknet/14798807.605123/6.892.175.722.121.477/variability-standard-deviation-mixing-lifetime-measured-minos-campaign.webp)