HAL Id: hal-00305018
https://hal.archives-ouvertes.fr/hal-00305018
Submitted on 27 Sep 2006
HAL is a multi-disciplinary open access
archive for the deposit and dissemination of
sci-entific research documents, whether they are
pub-lished or not. The documents may come from
teaching and research institutions in France or
abroad, or from public or private research centers.
L’archive ouverte pluridisciplinaire HAL, est
destinée au dépôt et à la diffusion de documents
scientifiques de niveau recherche, publiés ou non,
émanant des établissements d’enseignement et de
recherche français ou étrangers, des laboratoires
publics ou privés.
J. Parajka, G. Blöschl
To cite this version:
J. Parajka, G. Blöschl. Validation of MODIS snow cover images over Austria. Hydrology and Earth
System Sciences Discussions, European Geosciences Union, 2006, 10 (5), pp.679-689. �hal-00305018�
Hydrol. Earth Syst. Sci., 10, 679–689, 2006 www.hydrol-earth-syst-sci.net/10/679/2006/ © Author(s) 2006. This work is licensed under a Creative Commons License.
Hydrology and
Earth System
Sciences
Validation of MODIS snow cover images over Austria
J. Parajka1,*and G. Bl¨oschl11Institute for Hydraulic and Water Resources Engineering, Vienna University of Technology, Austria *Institute of Hydrology, Slovak Academy of Sciences, Bratislava, Slovakia
Received: 6 June 2006 – Published in Hydrol. Earth Syst. Sci. Discuss.: 13 June 2006
Revised: 12 September 2006 – Accepted: 20 September 2006 – Published: 27 September 2006
Abstract. This study evaluates the Moderate Resolution Imaging Spectroradiometer (MODIS) snow cover product over the territory of Austria. The aims are (a) to analyse the spatial and temporal variability of the MODIS snow prod-uct classes, (b) to examine the accuracy of the MODIS snow product against in situ snow depth data, and (c) to identify the main factors that may influence the MODIS classifica-tion accuracy. We use daily MODIS grid maps (version 4) and daily snow depth measurements at 754 climate stations in the period from February 2000 to December 2005. The re-sults indicate that, on average, clouds obscured 63% of Aus-tria, which may significantly restrict the applicability of the MODIS snow cover images to hydrological modelling. On cloud-free days, however, the classification accuracy is very good with an average of 95%. There is no consistent rela-tionship between the classification errors and dominant land cover type and local topographical variability but there are clear seasonal patterns to the errors. In December and Jan-uary the errors are around 15% while in summer they are less than 1%. This seasonal pattern is related to the over-all percentage of snow cover in Austria, although in spring, when there is a well developed snow pack, errors tend to be smaller than they are in early winter for the same overall per-cent snow cover. Overestimation and underestimation errors balance during most of the year which indicates little bias. In November and December, however, there appears to ex-ist a tendency for overestimation. Part of the errors may be related to the temporal shift between the in situ snow depth measurements (07:00 a.m.) and the MODIS acquisition time (early afternoon). The comparison of daily air temperature maps with MODIS snow cover images indicates that almost all MODIS overestimation errors are caused by the misclas-sification of cirrus clouds as snow.
Correspondence to: J. Parajka (parajka@hydro.tuwien.ac.at)
1 Introduction
Hydrological modelling in alpine regions is very difficult due to sparse observational networks and the enormous spa-tial variability of runoff formation factors such as snow pro-cesses. The value of snow cover data in hydrologic mod-elling has been demonstrated by many authors in the past (e.g. Bl¨oschl et al., 1991, among others). Grayson and Bl¨oschl (2000) and Grayson et al. (2002) summarise numer-ous examples of using snow cover data in addition to runoff and suggest that these response data are particularly useful if available as spatial patterns.
Currently, a suite of satellite snow cover products is available through the National Snow and Ice Data Center (NSIDC) Distributed Active Archive Center. These include global daily and 8-day composite products at a spatial reso-lution of 500 m derived from the Moderate Resoreso-lution Imag-ing Spectroradiometer (MODIS) instrument imagery. The MODIS snow-mapping algorithms are automated, which means that a consistent data set may be generated for long term climate studies that require snow-cover information (Hall et al., 2002). Both for climate and hydrological stud-ies the accuracy to which these products represent the actual snow cover is critically important as it is the main determi-nant of their usefulness. Several studies have been conducted to evaluate the accuracy of MODIS snow products, either based on comparisons with other satellite-derived products or based on comparisons with point ground based (in situ) snow depth measurements. Bitner et al. (2002) quantified the differences between the snow products of the National Oper-ational Hydrologic Remote Sensing Center (NOHRSC), the National Environmental Satellite Data and Information Ser-vice (NESDIS) and MODIS for a few days in 2001. They concluded that, in mid-winter, when there tends to be a con-tinuous snow pack, the agreement between the NOHRSC, NESDIS and MODIS snow cover products was good. How-ever, when large areas of discontinuous snow cover occurred
in the forested areas of the mountains the MODIS prod-uct tended to map more discontinuous snow cover under the forest canopy than the NOHRSC product. Klein and Barnett (2003) compared the MODIS product with opera-tional NOHRSC snow cover maps and against in situ Snow-pack Telemetry (SNOTEL) measurements for the 2000–2001 snow season. They demonstrated that, over the snow sea-son, the agreement between the MODIS and NOHRSC snow maps was high with an overall accuracy of 86%. How-ever, the MODIS snow maps typically indicated a higher proportion of the basin as being snow-covered than did the NOHRSC snow maps. A comparison of MODIS maps and in situ SNOTEL measurements indicated good overall agree-ment over the snow season with an overall accuracy of 94%. Maurer et al. (2003) compared the MODIS maps with the NOHRSC snow cover maps for 46 selected days over the Columbia River basin and 32 days over the Missouri River basin during the 2000–2001 snow season. For inferring the presence or absence of snow, they used ground observa-tions of snow depth at 1330 staobserva-tions in the Missouri River basin and 762 stations in the Columbia River basin and con-cluded that, on average, the MODIS images classified fewer pixels as cloud and misclassified fewer pixels than did the NOHRSC product. The performance of MODIS, GOES + SSM/I and SPOT-4 VEGETATION daily snow cover prod-ucts over Canada in a period of one year was evaluated by Simic et al. (2004). They compared the snow cover prod-ucts with daily surface snow depth observations at almost 2000 meteorological stations across Canada and found that the MODIS and NOAA products have similar levels of agree-ment with ground data, ranging from accuracies of 80% to al-most 100% on a monthly basis. The lowest accuracies were found for the snowmelt periods in forested areas. Tekeli et al. (2005) validated the MODIS snow cover maps against ground-based snow courses in and around the upper Eu-phrates River in Turkey, using data from the 2002/03 and 2003/04 winter seasons. The accuracy obtained by compar-ing synchronous MODIS and ground data was 62% and in-creased to 82% when allowing for a 2 day time shift. Cloud cover was considered to be the main reason for the relatively low classification accuracies. Recently, the study of Zhou et al. (2005) statistically evaluated two MODIS snow prod-ucts, the daily and 8-day composite images, for a period from February 2000 to June 2004, using streamflow and SNOTEL measurements as constraints. The intercomparison of these two products over the Upper Rio Grande River Basin indi-cated that the MODIS 8-day product has higher classification accuracies for both snow and land, but slightly higher errors of misclassifying land as snow than the MODIS daily prod-uct. They concluded that, for clear days, the MODIS daily algorithm works as well or better than the MODIS 8-day al-gorithm.
As indicated in this review, most of the validation studies used short periods of MODIS data and were carried out in North America. In this paper we focus on the validation of
MODIS snow cover images over Central Europe, specifically over the territory of Austria. The main goals of this paper are (a) to analyse the spatial and temporal variability of the MODIS snow product classes, (b) to examine the accuracy of the MODIS snow product against in situ snow depth data at climate stations, and (c) to identify the main factors that may influence the MODIS classification accuracy. The analysis of the variability of the snow product classes provides an as-sessment of the role of snow and clouds in the study area; the accuracy analysis is a important background information for the use of MODIS data in hydrological modelling and data assimilation; and an understanding of possible error sources may help improve the MODIS snow classification in the fu-ture. We use the dataset of MODIS daily grid maps together with daily snow depth measurements at 754 climate stations in the period from February 2000 to December 2005 which will likely allow us to draw more generic inferences than has been possible in previous studies.
2 Moderate Resolution Imaging Spectroradiometer (MODIS)
The snow cover images used in this study have been acquired by the MODIS instrument mounted on the Terra and Aqua satellites of the NASA Earth Observation System. MODIS is an imaging spectroradiometer that employs a cross-track scan mirror, collecting optics, and a set of individual detector elements to provide imagery of the Earth’s surface and clouds in 36 discrete, narrow spectral bands from approximately 0.4 to 14.4 µm (Barnes et al., 1998). From a variety of geophys-ical products derived from MODIS observation, the global daily snow cover product is available through the Distributed Active Archive Center located at the National Snow and Ice Data Center (NSIDC, http://www.nsidc.org).
The detailed description of the MODIS snow algorithm is presented in the Algorithm Theoretical Basis Document (Hall et al., 2001). The techniques used in the snow map-ping procedure include indices based on normalised differ-ences between bands, threshold-based criteria tests, and cision rules. The basic principle of the MODIS snow de-tection algorithm uses the difference between the infrared reflectance of snow in visible and short-wave wavelengths. The main distinctive feature of snow properties is a strong re-flectance in the visible and strong absorption capacity in the short-wave part of the spectrum. The measure of snow re-flectance difference in the MODIS snow mapping procedure is the Normalised Difference Snow Index (NDSI). The NDSI allows to distinguish snow from many other surface features and is adaptable for a number of illumination conditions. The discrimination between snow and clouds is based on differ-ences between cloud and snow/ice reflectance and emittance properties. Clouds, typically, have high reflectance in visible and near-infrared wavelengths, while the reflectance of snow decreases towards the short-wave infrared wavelengths (Hall
J. Parajka and G. Bl¨oschl: Validation of MODIS snow cover images over Austria 681
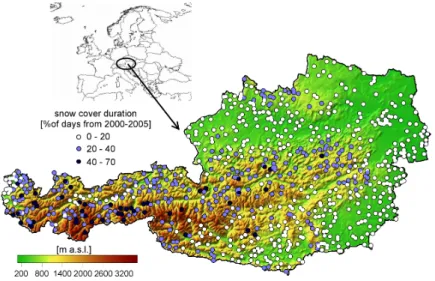
Fig. 1. Topography of Austria and spatial distribution of the 754 climate stations with snow depth measurements used in this paper. The
colour symbols of the climate stations represent the snow cover duration in % of days in the period 2000–2005.
et al. 1998). The MODIS snow cover determination is based on a liberal cloud mask. This means that, when in doubt, the image is not masked. Riggs et al. (2003) suggested that a lib-eral cloud mask allows snow analysis on more pixels than a more conservative mask and often results in an increased ac-curacy of snow mapping in regions where there is snow and a mix of snow and clouds. On the other hand, a liberal cloud mask tends to erroneously identify some types of ice clouds as snow.
The mapping of snow cover is limited in areas where snow cover is obscured by dense forest canopies (Hall et al., 2001). In the MODIS product, mapping snow in forested locations is based upon a combination of the normalised difference veg-etation index (NDVI) and the NDSI (Hall et al., 1998). Ap-plication of the NDVI index allows for the use of different NDSI thresholds for forested and non-forested pixels with-out compromising the algorithm performance for other land cover types. The MODIS snow cover data used in this study are daily snow cover maps from 25 February 2000 to 31 De-cember 2005. We used Version 4 data (Hall et al., 2000 and 2003), where each daily map consists of a composite image of a number of overpasses in the afternoon. This means that there is not a single time of day that can be attributed to any one image. The combination procedure uses a scoring algo-rithm that is based on pixel location, area of coverage in a grid cell and solar elevation. The purpose of scoring is to select the observation nearest to nadir with greatest coverage at the highest solar elevation that was mapped into the grid cell (Hall et al., 2000). The territory of Austria is covered by the h18v04 and h19v04 tiles with 500 m spatial resolu-tion. We combined data from both tiles and reprojected them into Lambert conformal conic projection using MODIS
Re-projection Tool (MRT, 2004). After the transformation, we reclassified the MODIS snow cover maps from originally 16 pixel classes to four classes: snow, no snow (land), clouds and others (mostly representing missing or erroneous data). These snow cover maps were subsequently used in the quan-titative validation.
3 Study area and snow depth measurements
Austria is flat or undulating in the East and North, and Alpine in the West and South. It covers an area of about 84 000 km2. The elevations range from 115 m a.s.l. to 3797 m a.s.l. (Fig. 1). Austria is located in a temper-ate climtemper-ate zone. Mean annual precipitation is less than 400 mm/year in the East and almost 3000 mm/year in the West. Land use is mainly agricultural in the lowlands and forest in the medium elevation ranges. Alpine vegetation and rocks prevail in the highest mountain regions.
The data used in this study consist of measurements of daily snow depths at 754 climate stations from February 2000 to December 2005, a digital elevation model (DEM) of Aus-tria with 250 m spatial resolution, a 10 m DEM in the vicin-ity of the climate stations and a vector land cover map (EEA, CORINE Land Cover 2000). The location of the climate sta-tions with daily in situ snow depth measurements is presented in Fig. 1. The colours of the station symbols represent the average duration of the snow cover during 2000–2005. The mountainous parts of Austria are covered by snow for several months in a year which highlights the importance of snow for the water balance. The snow depth readings are taken from permanent staff gauges and are hence point measurements. They are performed daily at 07:00 AM and snow depths are
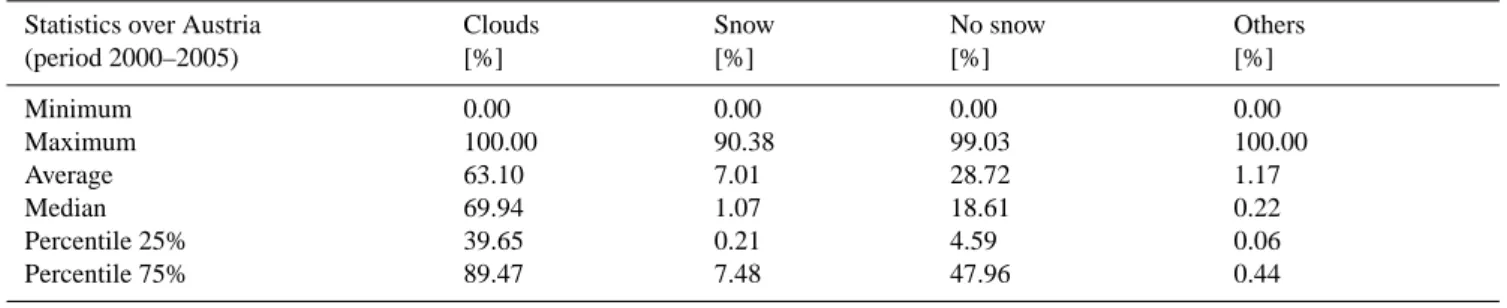
Table 1. Statistical evaluation of the spatial extent and temporal variability of four MODIS classes: snow, no snow, clouds and others over
the territory of Austria in the period February 2000 to December 2005. Statistics over Austria
(period 2000–2005) Clouds [%] Snow [%] No snow [%] Others [%] Minimum 0.00 0.00 0.00 0.00 Maximum 100.00 90.38 99.03 100.00 Average 63.10 7.01 28.72 1.17 Median 69.94 1.07 18.61 0.22 Percentile 25% 39.65 0.21 4.59 0.06 Percentile 75% 89.47 7.48 47.96 0.44
Fig. 2. Relative frequencies of different elevation zones (left) and land cover classes (right) for the dataset of 754 climate stations (red bars
from top to bottom) and maps covering all of Austria (blue bars from bottom to top).
reported as centimetre integer values (HZB, 1992). To assist in assessing the representativeness of the spatial arrangement of the climate stations Fig. 2 shows the relative frequencies of elevation (left panel) and selected land cover classes (right panel) for the locations of the climate stations as compared to those of the entire country (DEM map). The figure indi-cates that the snow depth measurements cover a wide range of elevation zones of the country, but in the mountain regions the stations tend to be located at lower elevations, typically in the valleys. This suggests a slight bias of the validation statis-tics towards lower elevations. The highest climate station is located at 2290 m a.s.l. which suggests that 6% of Austria (regions above that elevation) are not represented by any cli-mate station.
The evaluation of the station arrangement with respect to different land cover classes (Fig. 2, right) is difficult, because the snow depth measurements are only located at open grassy sites. This is consistent with WMO standards. To examine potential larger scale effects of vegetation, we assigned to each station the dominant land cover class of a circle around the station with 1 km radius. For the land cover classifica-tion we applied the nomenclature level 2 of the CORINE Land Cover 2000 (EEA, http://www.eea.eu.int), which con-sists of 14 categories, and reclassified these categories into four classes: pasture, shrubs, forest and others. Not sur-prisingly, the main differences in the spatial distribution of land cover were found for forest and pasture. Forests cover more than 40% of Austria while only 20% of the climate
sta-tions are located near forests. This suggests that the climate stations are not fully representative in terms of land cover categories which adds a caveat to the quantitative validation of the MODIS snow cover product for different land cover classes. Land cover information was hence used in this study only as an indicator of possible tendencies in MODIS errors.
4 Methodology of MODIS evaluation over Austria
The analysis of the MODIS snow cover maps over Austria was performed in three steps:
(a) The frequencies of four MODIS classes (snow, no snow, clouds and others) were evaluated over the entire re-gion of Austria. Map algebra operations were used to cal-culate the relative frequency of different pixel classes over Austria on a daily basis and the spatial variability of the fre-quency of these classes on a monthly basis. This test al-lows us to assess the duration and spatial extent of clouds and snow cover, which sheds light on the usefulness of the MODIS snow cover product for regional water balance mod-elling.
(b) The in situ measurements of snow depth were used to statistically evaluate the accuracy of the MODIS snow im-ages. Snow depth observations at the climate stations were considered as ground truth for the pixel that was closest to each station. These pixels were regarded as snow covered when the measured snow depth exceeded or equaled 1 cm,
J. Parajka and G. Bl¨oschl: Validation of MODIS snow cover images over Austria 683
Fig. 3. Daily frequencies (% of pixels) of MODIS classes (snow, no snow and clouds) in Austria in the period 2000–2005.
and snow free otherwise. In the MODIS validation, two types of errors were evaluated: the MODIS misclassification of snow as land termed here the MODIS underestimation er-ror (MU)and the misclassification of land as snow, termed
the MODIS overestimation error (MO). Both types of error
are represented by the relative frequency of station-days that were misclassified. The station-days are the number of days of misclassification or correct classification summed over all stations. These frequencies were then statistically evaluated on a monthly basis. The validation is performed separately for (i) all MODIS images available in the study period and (ii) only those days when the pixels at the station locations were not obscured by clouds. The overall degree of agree-ment between MODIS and snow depth measureagree-ments in the study period was represented by an index of overall agree-ment Ka. The Ka index is defined as the sum of correctly
classified station-days (snow – snow and no snow – no snow) divided by the total number of cloud-free station-days in per-cent.
(c) As a final step we analysed the potential error sources in terms of land cover of the station surroundings, climate characteristics, patchiness of the snow cover and snow depths on the days of misclassification.
5 Spatial and temporal variability of MODIS data over Austria
The temporal variability of the MODIS classes is presented in Fig. 3. Specifically, Fig. 3 shows the spatial extent of the snow, no snow and cloud classes on each day of the period from February 2000 to December, 2005 over the territory of Austria. The spatial extent and frequency of the clouds (grey colour in Fig. 3) clearly demonstrate the limitations of snow products derived from optical sensors. The statistical anal-ysis presented in Table 1 demonstrates that, on average, the clouds obscured about 63% of the area of Austria in the study period. The average spatial extent of the snow cover was 7% and that of no snow (land) was 29%. Interestingly, in the pe-riod 2000–2005 we did not find a single day with 100% snow coverage even though there are days with no snow-free land apparent. This is because of the persistent cloud cover.
The spatial variability of the MODIS classes was evalu-ated on a pixel basis for each month of the study period. A typical example for the snowmelt season 2003 is presented in Fig. 4. The spatial patterns of the clouds, no snow and snow classes are closely related to the topography of the study re-gion. An exception is the period of early snow accumula-tion. In November, December and January clouds, typically, obscure most of Austria on more than 25 days in a month. The spatial patterns of the no snow (land) class indicate that, in the eastern lowland region, snowmelt started in February. The frequency and spatial extent of the no snow class con-tinue to increase in March and April. In April, snow covers only the high mountain regions. The flatlands and the valleys are already snow free.
Table 2. Confusion matrix for MODIS and in situ snow depth measurements at 754 stations for cloud-free days of the period February 2000
to December 2005. The total number of station-days represents the sum of all cloud-free days for all climate stations of the study period. Ka is the sum of correctly classified station-days (snow – snow and no snow – no snow) divided by the total number of cloud-free station-days in percent.
MODIS MODIS
Snow [%] No snow [%] Total
In situ Snow [%] 84.2 15.8 77168
In situ No snow [%] 3.5 96.5 447 888 Total 80 478 444 578 52 5056
Overall accuracy Ka 94.7%
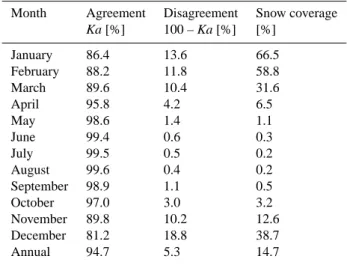
Table 3. Mean monthly frequencies of the agreement/disagreement
between snow depth measurements at 754 climate stations and MODIS snow images in the period February 2000 to December 2005 on all cloud-free days. Ka is the sum of correctly classified station-days (snow – snow and no snow – no snow) divided by the total number of cloud-free station-days in percent. For compari-son, the average percent snow coverage from the snow depth data is shown.
Month Agreement Disagreement Snow coverage
Ka [%] 100 – Ka [%] [%] January 86.4 13.6 66.5 February 88.2 11.8 58.8 March 89.6 10.4 31.6 April 95.8 4.2 6.5 May 98.6 1.4 1.1 June 99.4 0.6 0.3 July 99.5 0.5 0.2 August 99.6 0.4 0.2 September 98.9 1.1 0.5 October 97.0 3.0 3.2 November 89.8 10.2 12.6 December 81.2 18.8 38.7 Annual 94.7 5.3 14.7
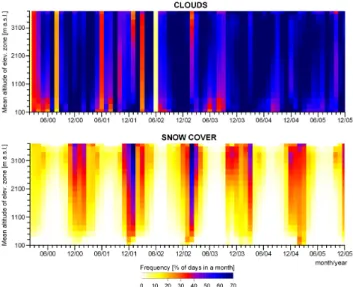
Figure 5 more closely examines the relationship between the MODIS classes and topographic elevation. Specifically, Fig. 5 shows the monthly frequencies of the MODIS cloud and snow cover classes stratified by 200 m elevation zones in Austria. In summer (May to July), typically, cloud cover increases with elevation while in winter cloud cover tends to decrease with elevation due to winter inversions (e.g. De-cember 2000 and 2001, or February 2003). As would be ex-pected, snow cover frequency increases with elevation but during the snow accumulation period this trend is partly masked by the extensive cloud cover. Similarly, the clouds may hide changes in the spatial extent of snow cover caused by rain-induced snowmelt events.
6 Validation of MODIS images against in situ snow depth data
The confusion matrix of Table 2 presents the overall agree-ment of remotely sensed snow images with the in situ snow depth measurements at the climate stations. The overall ac-curacy Ka of about 95% indicates very good agreement of the MODIS snow cover product with ground snow observa-tions. Out of a total of 77 168 cloud-free station-days for which snow was measured at the climate stations, 84% were correctly classified as snow by MODIS and 16% were incor-rectly classified as no snow. On the other hand, out of a total of 447 888 cloud-free station-days for which no snow was measured at the climate stations, 97% were correctly classi-fied as no snow by MODIS and only 3% were misclassiclassi-fied as snow.
Table 3 summarises the seasonal variability of the MODIS snow product performance. From November to March the misclassification errors are largest (up to 19%) while they are much smaller during the rest of the year. Clearly, this seasonal pattern of the MODIS performance is related to the overall snow coverage of Austria. Months with above aver-age snow coveraver-age exhibit above averaver-age errors. It is inter-esting that the largest errors occur in December while this is not the month with the largest percent snow cover. In other words, in spring when there is a well developed snow pack, errors are smaller than they are in early winter.
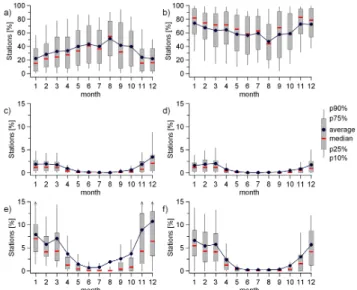
Additional information on the seasonal variation of the MODIS snow mapping performance is presented in Fig. 6. Each of the six panels evaluates the monthly statistics of the relative frequencies of climate stations, for which selected performance measures were assessed on a particular day. The statistical evaluation includes the mean and selected quan-tiles (10%, 25%, 50%, 75% and 90%) of the climate station frequencies. Panel a) shows the overall agreement between MODIS and ground observations where the percentage re-lates to all days (both cloud-free and cloud-covered). The number of climate stations that are in agreement with the MODIS images on a particular day was statistically evalu-ated on a monthly basis. For example, in January, there was
J. Parajka and G. Bl¨oschl: Validation of MODIS snow cover images over Austria 685
Fig. 4. Monthly frequencies (number of days) of MODIS classes (snow, no snow and clouds) in Austria in the snowmelt season 2003.
agreement between MODIS and the in situ data at 20% of the climate stations on average over all January days of the study period. For 10% of the January days (90% quantile) there was agreement at 55% of the climate stations. The lowest agreement between the MODIS and ground measurements occurs in the winter months but in summer the agreement is still relatively low (55%, on average, in August). These low percentages are because of the prevailing cloud cover (Fig. 6, Panel b). On average, between 47% (August) and 74% (January) of the stations were obscured by clouds. The frequencies of climate stations where the MODIS product misclassified the snow presence or absence are shown in Fig. 6 (Panels c to f). Panels c and d express the percentages in terms of all days, panels e) and f) in terms of cloud-free days only. Panels c and e give the overestimation errors MO,
pan-els d and f the underestimation errors MU. The two types
of misclassification errors (MO and MU)show similar
sea-sonal distributions with summer lows and winter highs. The most noticeable difference between MOand MUerrors occur
in November and December, with the overestimation errors being significantly large than the underestimation errors. In November, for example, average MOand MU are 8.5% and
3%, respectively, when expressed as percent of the cloud-free days. This means that, in these months, the MODIS product is biased with a tendency for classifying pixels as snow that were in fact snow free.
Fig. 5. Monthly frequencies (% of pixel-days) of MODIS cloud and
snow cover classes in Austria in the period 2000–2005 as a function of elevation.
7 Potential sources of misclassification
It is now interesting to analyse what are the potential sources of the disagreement of MODIS and the in situ snow cover data. Romanov et al. (2002) and Klein and Barnett (2003) suggested that some of the MODIS errors are caused by the
Fig. 6. Statistical evaluation of the MODIS snow data against in
situ snow depth data at 754 stations in Austria in the period 2000– 2005. (a) Frequencies of the overall agreement between MODIS and ground snow observations; (b) Frequencies of the MODIS clouds class; (c) Frequencies of the MODIS overestimation (MO) errors; (d) Frequencies of MODIS underestimation (MU)errors e) Frequencies of the MOerrors evaluated for cloud-free days (p90% of January is 15.4%, November 24.9%, December 29.1%); (f) Fre-quencies of the MU errors evaluated for cloud-free days. The fre-quencies have been calculated as follows: For each day of the data set the percentage of stations of a certain class or agreement class was estimated. With about 6 years and 30 days per month this gave a total of about 180 frequency values for each month. From these val-ues the cumulative distribution with percentiles p10%, p25%, me-dian, p75%, p90% and the average were estimated. This means that the error bars relate to the temporal variability (within month and between years) while the averages relate to the averages of the spatial frequencies.
Fig. 7. MODIS misclassification errors (sum of over- and
underesti-mation in % of cloud-free days) plotted vs. elevation and topograph-ical variability in the surroundings of the climate stations. Each point represents a station. Colours show the dominant land cover type within 1 km radius around the climate station. Topographical variability is expressed by the standard deviation of elevation within a 500 m square around the station.
inconsistency of the satellite reference elevation and eleva-tion of the particular climate staeleva-tion. An alternative sugges-tion was provided by Hall et al. (2001) who noted that the MODIS snow mapping performance differed by land cover with 15% errors for forests, 10% for mixed agriculture and forest, and 5% for other land-covers. Similarly, Simic et al. (2004) reported that MODIS mapping accuracies were the lowest in the evergreen forests, with an error rate of 20% during snowmelt. In order to link these two indicators to the MODIS misclassification errors over Austria, we com-pared the errors with the dominant land cover type, eleva-tion and topographical variability in the surroundings of the 754 climate stations (Fig. 7). The dominant land cover type was derived for a circle with 1 km radius around each cli-mate station. Topographical variability was represented by the standard deviation of elevation within a 500 m grid cell using a DEM with 10 m spatial resolution. Figure 7 indi-cates that there is no consistent relationship between site el-evation, dominant land cover type, topographical variability and the MODIS mapping accuracies. The stations with the highest misclassification error rates are located in a wide el-evation range, from 750 to 1900 m a.s.l. There is a tendency for the errors to increase with elevation but this is related to an increase of percent snow cover with elevation (Fig. 5). In contrast to the studies of Hall et al. (2001) and Simic et al. (2004), in this study the largest errors occur on pastures and shrubs. The mean misclassification error for the shrub class is around 10%, for pastures and forest it is around 6%. The remaining land cover types (grouped into the “other” class) had a mean misclassification error of only 3%. This class consisted of urban fabric, industrial units, open spaces, permanent crops and heterogeneous agricultural areas and in-land wetin-lands. However, it should be noted that the evalua-tion of such types of errors in Austria is not straightforward, as the snow depth measurements at the climate stations are carried out at grassy sites only. A more detailed analysis of the physiographic and climatic conditions in the local neigh-bourhood of climate stations would be needed to fully ex-plain the differences between MODIS and ground snow ob-servations.
Another source of MODIS misclassification may be the liberal cloud mask used in the snow mapping algorithm. As found in Riggs et al. (2003), the liberal cloud mask is prone to incorrectly label ice clouds as snow. In this study, we compared grid maps of daily air temperatures with MODIS snow cover images. This comparison indicated that almost all MODIS overestimation errors in the summer months were caused by the misclassification of cirrus clouds as snow. A typical example is shown in Fig. 8, where daily maps of the MODIS snow product and air temperatures for 20 June 2003 are presented. The summer 2003 was in fact one of the hottest summers on record in Austria,
so there was clearly no snow present. Although this type of overestimation error is relatively easily detectable for warm days in summer, during snow accumulation and melt it is
J. Parajka and G. Bl¨oschl: Validation of MODIS snow cover images over Austria 687
Fig. 8. Example of erroneous snow classification. The left panel shows the MODIS snow cover map on 20 June, 2003. The right panel shows
the mean daily air temperature on the same day interpolated from measurements at 212 climate stations.
Fig. 9. Photos of the Edelbodenalm in the Hochschwab region taken
by an automatic still camera on 9 May 2005 to illustrate possible reasons for underestimation of the MODIS data: Patchy snow cover and time shifts. In situ snow depth data are collected at 07:00 a.m. while the MODIS data are typically captured in the afternoon. In this example, the in situ data indicated snow cover and the MODIS data indicated no snow.
much more difficult to identify. The increase of cloud cov-erage with elevation, as found in this study, may thus reduce the MODIS classification accuracy in the alpine regions of Austria.
Evaluation of the MODIS mapping accuracy is difficult when the snow cover becomes patchy. To illustrate the case, Fig. 9 shows hourly photographs taken at the Edelbodenalm (1344 m a.s.l.) in the Hochschwab region of Austria on 9 May 2005. The width of the photo is about 100 m and 1.5 km at the far end of the meadow and in the background, respec-tively. The MODIS pixel size is 500 m. The photos clearly illustrate that, if the snow is patchy, it would be difficult to ascertain whether a pixel is snow covered or not. The photos illustrate an additional factor the may influence the misclassification rate. The in situ snow depth data are col-lected at 07:00 a.m. while the MODIS data are typically cap-tured in the afternoon. This time shift may lead the MODIS data to underestimate snow cover relative to the in situ snow depth data when snow melt occurs during the day as indi-cated in Fig. 9. Alternatively, snowfall may occur during the day which may cause the MODIS data to overestimate snow cover relative to the in situ snow depth data. This time shift
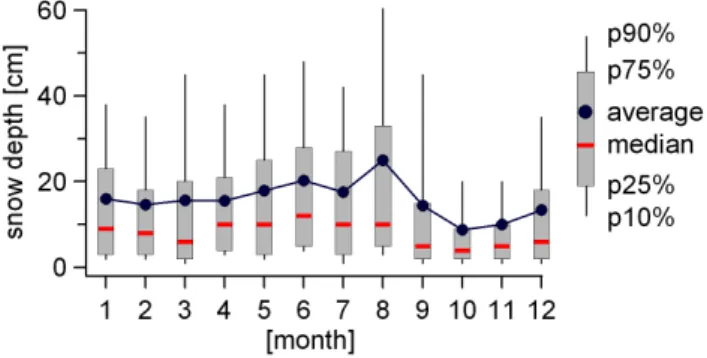
Fig. 10. Statistical evaluation of in situ snow depths measured at
the climate stations for those days when MODIS underestimated the presence of snow cover. Definition of frequencies as in Fig. 6.
may, at least partly, explain the overestimation (bias) of the MODIS data in November in December shown in Figs. 7e and f as one would expect more frequent snowfalls on bare ground during these months than during the rest of the year. This potential error source is also consistent with the findings of Klein and Barnett (2003) who found that most of the dis-crepancies between MODIS and ground measurements at the SNOTEL sites occurred at the beginning and the end of the snow season. These are the situations when one would ex-pect the thinnest and patchiest snow cover, so snowfall and snow melt will have the largest impact on the spatial extent of the snow cover.
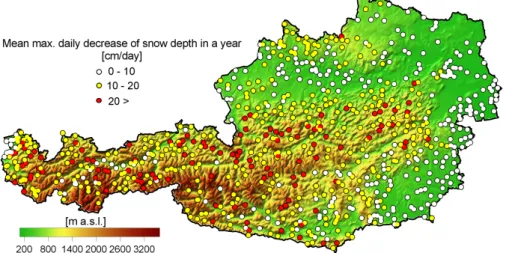
To shed more light on this issue, the snow depths of those days and stations when MODIS misclassified snow as land were analysed in Fig. 10. The medians of the snow depths range between 5 and 10 cm. These are somewhat larger val-ues than those of Klein and Barnett (2003) who reported that snow depths were less than 4 cm on most of the days when MODIS failed to map snow. To identify the potential mag-nitudes of daily decreases of snow depths in Austria we esti-mated the maximum daily decrease of snow depth in any one year from the snow depth data. The averages of these values over the six years of the study period are shown in Fig. 11 for each climate station. There is an interesting spatial pat-tern. In the lowlands as well as in the mountain valleys the
Fig. 11. Mean maximum daily decrease in snow depth (cm/day) at 754 climate stations. The mean is calculated over the maximum daily
decreases in each year of the period 2000–2005.
decreases tend to be less than 10 cm/day. However, most of the mountain stations exhibit maximum daily decreases in either the 10–20 or >20 cm/day range. These findings sug-gest that the temporal shift between the two types of snow observations (MODIS and climate stations) may indeed ex-plain some of the inconsistencies. The actual mapping error of MODIS is hence likely somewhat smaller than what is shown in the analyses of Tables 2 and 3 and Fig. 6.
8 Discussion and conclusions
Even though the MODIS snow product analysed here is based on a liberal cloud mask and an improved cloud de-tection algorithm (Riggs and Hall, 2002), the average cloud cover is 63%. This is very likely due to the climate condi-tions over Austria rather than an artefact of the algorithm. There are spatial and temporal patterns to the cloud cover but it is always large. This large cloud cover percentage has significant implication for the application of the MODIS snow product in snowmelt runoff modelling as it may hide important hydrological processes, such as the onset of snow accumulation and snowmelt. MODIS cloud cover in North America may be somewhat lower (45% as found in Zhou et al., 2005) but cloud is clearly a general limitation of visible and near infrared remote sensing products.
While cloud cover appears to be a problem, the accuracy of the MODIS snow cover product for cloud-free days is very good. The overall accuracy of 95% found here is consistent with monthly errors ranging from 5 to 9% in North America and from 5 to 10% in Eurasia (Hall et al., 2001).
There is a clear seasonal patterns to the errors found here with smaller errors occurring in summer and larger errors in winter. Clearly, this pattern is related to the overall per-cent snow coverage of Austria. As most of Austria becomes
snow free in summer, errors are much less likely to occur than they are in winter and spring. For a given percent snow cover, spring and autumn errors, however, tend to differ. In spring when there is a well developed snow pack, errors tend to be smaller than they are in early winter. While Simic et al. (2004) and Vikhamar and Solberg (2002) found a sim-ilar seasonal pattern of MODIS snow product errors, they attributed the larger winter errors to the detection algorithm and stressed the need to correct for tree and surface shading effects in winter when solar zenith angles are large.
The seasonal patterns of the overestimation errors and un-derestimation errors found in this study are similar. This means that, overall, there is little bias in the MODIS snow product. This is in agreement with results from North Amer-ica with MODIS missing snow in approximately 12% of the cases and mapping too much snow in 15% of the cases (Klein and Barnett, 2003). In November and December, however the overestimation errors of this study tend to be larger than the underestimation errors. Average MO are about 10% as
opposed to MU of about 5% of the cloud-free days in these
two months. It is likely that these biases are related to a ten-dency for shallower snow packs in November and December as compared to the mid winter and early spring months that exhibit a similar percent snow cover in Austria. The shal-lower snow packs may cause the time shift errors to become more important. Time shift errors may occur as the snow depth data are collected at 07:00 a.m. while the MODIS over-passes, typically, are in the afternoon, and snowfall may have occurred in the mean time. Similarly, some of the errors dur-ing the snow melt period may be due to the time shift as some of the snow may have melted in the mean time. The analy-sis of the maximum decreases of snow depth during the year confirms that time shifts likely contribute to the discrepancies between in situ and MODIS data. Because of this, the classi-fication accuracy of the MODIS snow product on cloud-free
J. Parajka and G. Bl¨oschl: Validation of MODIS snow cover images over Austria 689
days is likely better than 95%. Clearly, there is significant potential of the MODIS snow product for hydrological mod-elling in a country such as Austria with the caveat of cloud cover issues.
Ongoing work on hydrological applications of the MODIS snow product will be geared towards combining MODIS snow images with in situ snow depth data to capitalise on the respective advantages of the two data sources, spatial detail in the case of MODIS and local accuracy in the case of the in situ data. The quantitative estimates of the MODIS mapping errors found in this paper will enable us to merge MODIS snow cover information with hydrological models based on data assimilation techniques such as Ensemble Kalman Fil-tering (e.g. Rodell and Houser, 2004, Slater and Clark, 2006). We believe that the assimilation of satellite snow cover data into hydrologic models will allow us to estimate snow cover and snow melt more accurately than is possible with tradi-tional ground based data sources alone.
Acknowledgements. The authors would like to thank the European
Commission (AWARE project, contract No. SST4-CT-2004-012257) for financial support, the Austrian Hydrographic Service (HZB) for providing the snow depth data and R. Kirnbauer and P. Haas (Kater II project) for providing the photos of Fig. 9. Edited by: W. Wagner
References
Barnes, W. L., Pagano, T. S., and Salomonson, V. V.: Prelaunch characteristics of the Moderate Resolution Imaging Spectrora-diometer (MODIS) on EOS-AM1, IEEE Transactions on Geo-science and Remote Sensing, 36(4), 1088–1100, 1998.
Bitner, D., Carroll, T., Cline, D., and Romanov, P.: An assessment of the differences between three satellite snow cover mapping techniques, Hydrol. Processes, 16, 3723–3733, 2002.
Bl¨oschl, G., Kirnbauer, R, and Gutknecht, D.: Distributed snowmelt simulations in an Alpine catchment. 1. Model evaluation on the basis of snow cover patterns, Water Resour. Res., 27(12), 3171– 3179, 1991.
European Environmental Agency (EEA): CORINE Land Cover 2000, http://www.eea.eu.int, 2000.
Grayson, R. B. and Bl¨oschl, G.: Spatial Patterns in Catchment Hydrology: Observations and Modelling. Cambridge University Press, Cambridge, UK, 404 pp, 2000.
Grayson, R. B., Bl¨oschl, G., Western, A., and McMahon, T.: Ad-vances in the use of observed spatial patterns of catchment hy-drological response, Adv. Water Resour., 25, 1313–1334, 2002. Hall, D. K., Riggs, G. A., Salomonson, V. V., Barton, J. S., Casey,
K., Chien, J. Y. L., DiGirolamo, N. E., Klein, A. G., Powell, H. W., and Tait, A. B.: Algorithm theoretical basis document (ATBD) for the MODIS snow and sea ice-mapping algorithms, available at: http://modis-snow-ice.gsfc.nasa.gov/atbd01.html, 2001.
Hall, D. K., Riggs, G. A., Salomonson, V. V., DiGirolamo, N. E., and Bayr, K. J.: MODIS snow-cover products, Remote Sens. En-viron., 83, 181–194, 2002.
Hall, D. K., Foster, J. L., Verbyla, D. L., Klein, A. G., and Benson, C. S.: Assessment of snow-cover mapping accuracy in a vari-ety of vegetation-cover densities in central Alaska, Remote Sens. Environ., 66(2), 129–137, 1998.
Hall, D. K., Riggs, G. A., and Salomonson, V. V.: MODIS/Aqua Snow Cover Daily L3 Global 500 m Grid V004, January to March 2003. Boulder, CO, USA: National Snow and Ice Data Center, Digital media, 2003, updated daily.
Hall, D. K., Riggs, G. A., and Salomonson, V. V.: MODIS/Terra Snow Cover Daily L3 Global 500 m Grid V004, February 2000 to December 2005. Boulder, CO, USA: National Snow and Ice Data Center, Digital media, 2000, updated daily.
HZB (1992): Anleitung zur Beobachtung und Messung von meteo-rologischen Parametern zur Erfassung des Wasserkreislaufes im Rahmen des Hydrographischen Dienstes in ¨Osterreich. (Guide-lines of the Hydrographic Service in Austria for observing and measuring meteorological parameters for assessing the water cy-cle), Federal Ministry of Agriculture and Forestry, Vienna, 1992. Klein, A. G. and Barnett, A. C.: Validation of daily MODIS snow cover maps if the Upper Rio Grande River Basin for the 2000-2001 snow year, Remote Sens. Environ., 86, 162–176, 2003. Maurer, E. P., Rhoads, J. D., Dubayah, R. O., and Lettenmaier, D. P.:
Evaluation of the snow-covered area data product from MODIS, Hydrol. Processes, 17, 59–71, 2003.
MODIS Reprojection Tool (MRT), Users guide. Release 3.2a. De-partment of Mathematics and Computer Science, South Dakota School of Mines and Technology, USGS EROS Data Center, 58pp, 2004.
Riggs, G. and Hall, D.: Reduction of cloud obscuration in the MODIS snow data product. Presented at the 59th East-ern Snow Conference, Stowe, Vermount, USA, June 2002, http://modis-snow-ice.gsfc.nasa.gov/pap cloud obs02.pdf, 8 pp., 2002.
Riggs, G. A., Hall, D. K., and Salomonson, V. V.: MODIS snow products user guide for collection 4 data products, http: //modis-snow-ice.gsfc.nasa.gov/sug main.html, January 2003. Rodell, M. and Houser, P. R.: Updating a land surface model with
MODIS-derived snow cover, J. Hydrometeorol., 5, 1064–1075, 2004.
Romanov, P., Gutman, G., and Csiszar, I.: Satellite-derived snow cover maps for North America: accuracy assessment, Adv. Space Res., 30(11), 2455–2460, 2002.
Simic, A., Fernandes, R., Brown, R., Romanov, P., and Park, W.: Validation of VEGETATION, MODIS, and GOES+SSM/I snow cover products over Canada based on surface snow depth obser-vations, Hydrol. Processes, 18, 1089–1104, 2004.
Slater, A. G. and Clark, M. P.: Snow data assimilation via an en-semble Kalman filter, J. Hydrometeorol., 7, 478–493, 2006. Tekeli, A. E., Aky¨urek, Z., S¸orman, A. A., S¸ensoy, A., and S¸orman,
A. ¨U.: Using MODIS snow cover maps in modeling snowmelt runoff process in the eastern part of Turkey, Remote Sens. Envi-ron., 97, 216–230, 2005.
Vikhamar, D. and Solberg, R.: Subpixel mapping of snow cover in forest by optical remote sensing, Remote Sens. Environ., 84, 69–82, 2002.
Zhou, X., Xie, H., and Hendrickx, J. M. H.: Statistical evaluation of remotely sensed snow cover products with constraints from streamflow and SNOTEL measurements, Remote Sens. Environ., 94, 214–231, 2005.