HAL Id: hal-00304740
https://hal.archives-ouvertes.fr/hal-00304740
Submitted on 1 Jan 2002HAL is a multi-disciplinary open access archive for the deposit and dissemination of sci-entific research documents, whether they are pub-lished or not. The documents may come from teaching and research institutions in France or abroad, or from public or private research centers.
L’archive ouverte pluridisciplinaire HAL, est destinée au dépôt et à la diffusion de documents scientifiques de niveau recherche, publiés ou non, émanant des établissements d’enseignement et de recherche français ou étrangers, des laboratoires publics ou privés.
Technical Note:Practical considerations on the use of
down-sized time-domain reflectometry (TDR) probes
M. A. Mojid
To cite this version:
M. A. Mojid. Technical Note:Practical considerations on the use of down-sized time-domain reflec-tometry (TDR) probes. Hydrology and Earth System Sciences Discussions, European Geosciences Union, 2002, 6 (5), pp.949-955. �hal-00304740�
Technical Note:
Practical considerations on the use of down-sized time-domain reflectometry
(TDR) probes
M.A. Mojid
Department of Irrigation and Water Management, Bangladesh Agricultural University, Mymensingh – 2202, Bangladesh. E-mail: [email protected]
Abstract
Nine time-domain reflectometry (TDR) probes, 2 to 10 cm long, were evaluated by comparing their measurement accuracy of TDR-pulse travel time in a sand and sandy loam soil, and electrical conductivity in NaCl solutions. TDR probes <2.5 cm in length generated trough-haped TDR waveforms with rounded corners at the points of the pulse reflection from the probe ends. The sharpness of the pulse reflection on the waveforms increased with both the increasing probe length and soil-water content. The transition time for the propagation of TDR pulse at the probe entrance increased as the soil dried up. The increased transition time caused a rightward movement of the first peak of the waveform at the probe entrance. Because of such peak movement, TDR-support software algorithm determined travel path of TDR pulse through the probe that was smaller than the actual travel path. TDR-measured pulse travel time tTDR varied erratically with the predicted pulse travel time tg (from volumetric soil-water content) for the probes <2.5 cm in length. But, for all probes ³2.5 cm in length, tTDR varied linearly with tg and followed the 1:1 line. TDR could not measure tTDR < 300 ps accurately. A minimum probe length Lmin and the lowest allowable soil-water content qmin that the probe can accurately measure govern this lowest pulse travel time tmin. The mean absolute deviation between tTDR and tg was 77 ps for the 2.3 cm long probe and 1.39 ps for all probes ≥2.5 cm in length. All probes ≥2.5 cm in length measured electrical conductivity of salt solutions sTDR that compared well with the electrical conductivity measured by a conductivity meter sm. The length of the probes did not exert any noticeable influence on the accuracy of electrical conductivity measurement.
Keywords: TDR probe, pulse travel time, dielectric constant, electrical conductivity
Introduction
In spite of significant advances in the practical techniques and conceptual understanding of the time-domain reflectometry (TDR) technique over the last two decades, the TDR probe length currently used, usually above 10 cm, has limited the application of TDR in small-scale measurements such as in the laboratory study of water flow and solute transport in small columns. Using a 5 cm long probe, Topp et al. (1984) obtained considerably lower soil-water content by a compared with the gravimetric measurement and described the error in TDR-measurement in relation to the measurement accuracy of the TDR pulse travel time. Heimovaara (1993) reported increase in rise time of the reflected TDR pulse for probes <5 cm in length when used with coaxial cables >3.2 m and he did not use these
probes. Pulse rise time is defined as the time required for a TDR pulse to rise from 10% to 90% of its final value. Transition time of a TDR pulse defined by the time between the beginning of transition of the reflected pulse and 50% of the final value after complete reflection has also been described as a dominant error in measuring the travel time of the pulse (Hook and Livingston, 1995). The transition time is caused by the interaction of the energy of the high frequency TDR pulse with soil. Taking into account all these factors attempts were made in recent years to downsize TDR probes (1) by increasing clarity of the reflected signal using high bandwidth TDR system (Kelly et al., 1995), (2) by improving the technique of waveform analysis (Yanuka et
M. A. Mojid
out long probe rods on a short support material (Nissen et
al., 1998,1999).
Kelly et al. (1995) used an expensive 20 GHz digital sampling oscilloscope that generated TDR pulses with 25 ps rise time. This oscilloscope displayed clear waveforms with sharp reflections at the ends of the probe and allowed use of probes as small as 2.5 cm long. Malicki et al. (1992) reported using 5.4-cm long probes with a TDR moisture meter operating with a pulse of 250 ps rise time. Neither of these two TDR systems was more popular among users than the Tektronix 1500 series TDR cable testers. Dalton and van Genuchten (1986) and Keng and Topp (1983) used Tektronix cable tester and experimentally found 10 cm as the practical lowest length of probe with a ±0.02 m3m-3 uncertainty in the measured water content over the entire range of soil-water content. They could, however, use shorter probes in soil with high water content. Amato and Ritchie (1995) claimed to obtain reliable determination of soil-water content over 0.07 m3 m-3 using a 2.1 cm long probe. The clarity of the waveforms that they interpreted (e.g., their Fig.3) for this determination was very poor. This raises concern about the interpretation of such waveforms, especially manually, obtaining accurate travel time or travel path of the pulse. Amato and Ritchie (1995) did not evaluate their probe by determining soil-water content using TDR-support software, which is now an obvious requirement for most TDR applications. Nissen et al. (1998) constructed a 1.5 cm long probe by winding coils on a core material. This coil probe was coated to prevent penetration of water between the windings of the coil and, therefore, could not measure electrical conductivity of soil. Nissen et al. (1999) introduced a printed circuit board probe in which a 3-line serpentine wave guide was produced in a copper cladding of a circuit laminate, 5 cm long, 1 cm wide, and 0.064 to 0.1 cm thick. Being a plate, this probe could be installed only along the water flow lines. Both probes of Nissen et
al. (1998) and Nissen et al. (1999) needed additional
calibration and produced unusual shape waveforms that most software could not analyse.
Only limited successes have so far been achieved in using small TDR probes for measuring dielectric constant and soil-water content, occasionally under specific conditions. The measurement of electrical conductivity with small probes was ignored in most studies. This study investigated the performance of small probes in measuring TDR pulse travel times in soils and electrical conductivity of salt solutions using a Tektronix 1502C cable tester and TDR support software, called WinTDR99, developed by Or et al. (1999). The objective was to identify the factors that control the length of TDR probes and the limiting values of the factors to obtain accurate TDR measurements with small probes.
Materials and methods
DIELECTRIC CONSTANT, SOIL-WATER CONTENT, AND TDR WAVEFORM MEASUREMENT
Nine 3-rod probes, 2 to 10 cm long, were constructed using 0.1-cm diameter stainless steel rod and 350 cm long RG-58A/U coaxial cable of resistance 50 W. The probe head consisted of 1-cm thick, 0.8-cm wide and 1.8-cm long acrylic block. The centre-to-centre spacing between the two outer rods was 1.1 cm and that between the central and outer rods was 0.55 cm. Before using these probes for measurement in soil, they were first calibrated in pure water with its known dielectric constant (78.39 at 25 oC) using WinTDR99. This calibration was necessary to determine the effective length of the probes for accurate measurement of TDR pulse travel time. During the calibration, the point of initial reflection of the pulse from the probe entrance was identified for all probes.
The bottom 4 cm of an acrylic column, 5-cm long, 5-cm inner diameter, and the base closed with a ceramic plate, was filled with air-dry sand. One TDR probe was inserted in the sand 2 cm above the bottom of the column keeping the three rods of the probe in a horizontal plane. The sand was saturated from the bottom of the column using a Marriotte bottle. Step-wise suctions ranging from 0 to 150 cm of water were applied at the bottom of the column using a hanging water column to drain the sand. The drainage water was collected for each suction until equilibrium condition in the sand was reached. The dielectric constant of the sand and TDR waveform were recorded for each step of suction at equilibrium using WinTDR99 (both for the fixed initial reflection at its location obtained in pure water and for the relocated initial reflection in each measurement). The measurement was continued until soil-water content decreased to such an extent that the program algorithm failed to analyse the waveform properly. After all measurements had been made, the water content of the sand was determined gravimetrically by drying it at 105oC for 24 hrs and was converted to volumetric water content, θg. This experiment was carried out using 2.0, 2.3, 2.5, 3.0, 3.5, 4.0, 4.5, 4.8, and 10.0-cm long probes in sand as well as in a sandy loam soil. In the case of the 10-cm long probe, the diameter of the soil column was 10 cm. The experiments were repeated three times for each probe at a constant room temperature of 25±1oC.
The algorithm of WinTDR99 first estimates the length of travel path of the TDR pulse through the probes using the point of initial and final reflections of the pulse. Unlike other TDR-support softwares, WinTDR99 draws two tangent lines at the inflection points of the waveforms on either side of the first peak at the probe entrance and assumes the initial
reflection at the intersection of these tangent lines. The point of final reflection is located at the intersection of a tangent passing through the inflection point on the waveform after the local minimum and a tangent passing through the local minimum. The inflection points are located at the largest positive and the largest negative first derivatives of the waveforms around the points of reflection. The travel time of the TDR pulse t (s) in a probe of length L (m) and the dielectric constant of the surrounding media e are related by electro-dynamic equation as:
c L
t= ε (1)
where c is the velocity of TDR pulse in free space (3´108 m s–1). The dielectric constant εεεεε and volumetric water content θθθθθ for the sand and sandy loam soil are related by the equation of Topp et al. (1980) given by:
3 2 76.7 146 3 . 9 03 . 3
θ
θ
θ
ε
= + + − (2)The first derivatives of the waveforms were calculated to check the clarity of the inflection points on the waveforms for all probes. The travel time of the TDR pulse t was calculated from εεεεεusing Eqn. 1 and was denoted by tTDR (ps), called the measured pulse travel time. In addition to tTDR, the pulse travel time was predicted independently from the gravimetrically measured soil-water content θθθθθg using Eqns. 2 and 1 and was denoted by tg (ps). The predicted travel times tg, considered to be an accurate estimate of t, were compared with tTDR to evaluate the accuracy of TDR measurements for different probes at different water contents.
ELECTRICAL CONDUCTIVITY MEASUREMENT
The thin-section approach of Giese and Tiemann (1975) was used in WinTDR99 to calculate electrical conductivity σσσσσ (dS m–1) by analysing TDR waveforms. The governing equation is given by:
− =10 0 0 2 0 1 f u V V Z Z L c ε σ (3)
where εεεεε0 is the dielectric permittivity of free space (8.9 × 10⁻¹² F m–1), Z
0 the characteristic impedance of the probe (Ω), Zu the output impedance of the TDR cable tester (50Ω for Tektronix 1502C), V0 the incident pulse voltage, Vf the reflected pulse voltage after multiple reflections were suppressed, and c and L are as described before. The algorithm of WinTDR99 selected V0 and Vf from the waveforms. Z0 was determined in a separate calibration by
immersing the probes in pure water and using its known dielectric constant εw (78.39 at 25oC) according to:
−
=
1 0 1 02
V
V
V
Z
z
uε
w (4)where V1 is the minimum voltage on the TDR waveform between the initial and final reflections of the pulse from the two ends of the probe and was obtained from the waveforms.
Nine NaCl solutions, 0.001 to 0.1M, were prepared and kept at 25±1oC for 48 hours to achieve homogeneous salt solutions. The electrical conductivity of these solutions was measured first by a HORIBA ACT D-20 digital conductivity meter of Horiba Jobin, Yvon Co., Ltd., Japan and then by all TDR probes ≥ 2.5 cm in length. The other two probes, <2.5 cm in length, were not used for electrical conductivity measurement since they could not be used to measure soil-water content.
Results and discussion
WAVEFORM EVALUATION
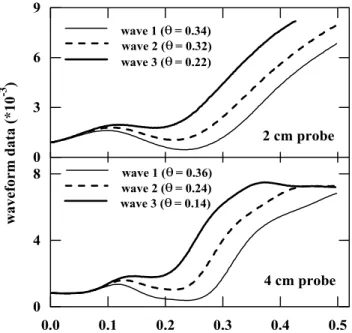
TDR probes <2.5 cm in length provided trough-shaped waveforms with rounded corners over the entire range of soil-water content. These waveforms had no well-defined sharp reflections from the probe ends. Figure 1 shows three waveforms for the 2 cm long probe and three waveforms
0.0 0.1 0.2 0.3 0.4 0.5
distance from cable tester output point [m] 0 3 6 9 0 4 8 w aveform data (*10 -3 ) wave 1 (θ = 0.34) wave 2 (θ = 0.32) wave 3 (θ = 0.22) wave 1 (θ = 0.36) wave 2 (θ = 0.24) wave 3 (θ = 0.14) 2 cm probe 4 cm probe
Fig. 1. TDR waveforms retrieved for three different soil-water
M. A. Mojid
for the 4 cm long probe retrieved in sand. The soil-water content was 0.34, 0.32 and 0.22 m3 m–3 for the waveform 1, 2 and 3, respectively for the 2 cm long probe and 0.36, 0.24 and 0.14 m3 m–3, respectively for the 4 cm long probe. The combined effects of the large rise time (≤200 ps, Tektronix, 1987) and the large transition times of the TDR pulse for small travel times in the small probes caused trough-shaped waveforms.
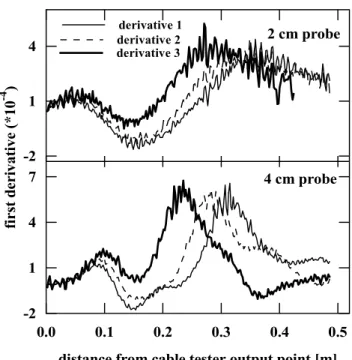
The TDR system operates on a frequency bandwidth, which is the range of frequencies from zero to the highest frequency component of the TDR signal that the instrument can measure. The frequency bandwidth is inversely proportional to the rise time of the TDR pulse (Oliver and Cage, 1971, p.372-373). A small rise time of the TDR pulse causes sharp reflections from the ends of a probe and generates a clear signal. The travel time of the TDR pulse through the 2 cm long probe came close to or shorter than the rise time of the reflected pulse depending on the soil-water content (Eqn.1). The short travel time of the pulse made the points of reflection on the waveform from the ends of the probe unclear (Lancaster, 1992). The accuracy of measurement of the TDR cable tester also limits the clarity of the reflected waveforms. Figure 1 reveals that the sharpness of the reflection of the TDR pulse increases both with the increasing probe length and soil-water content. Figure 2 illustrates the three-point moving average of the first derivatives of the waveforms presented in Fig. 1. The
peaks on the first derivatives represent the inflection points of the waveforms and were more rounded for the 2 cm long probe than for the 4 cm long probe. Sharp inflection points on the first derivatives of the waveforms are always needed to determine the initial and final points of reflection of the TDR waveforms accurately by a program algorithm.
It was noticed that the first peak of the waveform and the two inflection points around it that are located at the largest positive and the largest negative first derivatives, moved rightward with decreasing soil-water content in all experiments. The movement of the first peak can be visualised in Fig. 1 and that of the inflection points is estimated for the 4 cm long probe in Fig. 2. Consequently, the point of the initial reflection of the waveform also moved rightward as the soil dried up due to the increased transition time of the pulse as it entered from the probe head to the probe rod.
PULSE TRAVEL TIME EVALUATION
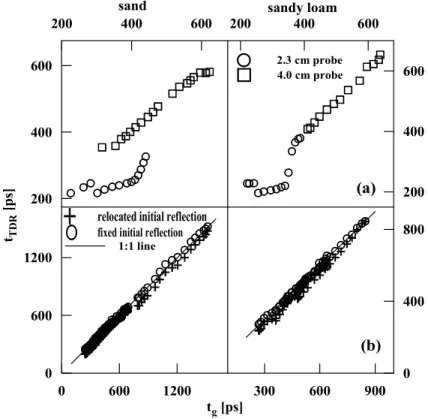
The travel time of the TDR pulse through a particular probe is a function of the dielectric constant of the surrounding soil (Eqn. 1), and it decreased as soil-water content decreased. Figure 3(a) (top half) illustrates the variation of the measured pulse travel time tTDR with the predicted pulse travel time tg in sand and sandy loam soil for the 2.3 cm and 4.0 cm long probes. The measured pulse travel time tTDR varied erratically with tg for all probes <2.5 cm in length and consistently for all probes ≥2.5 cm in length. For the 2.3-cm long probe, tTDR was large when the soils were saturated but decreased sharply in response to a small decrease in soil-water content. Then tTDR decreased gradually with further decrease in soil-water content until the program algorithm failed to analyse the waveforms at certain low water content. This behaviour of tTDR can be explained in terms of the length and wall effects of the probe. The sampling volume of TDR was small for the small probes and the pore water interacted with the probes in the same way as it interacted with the soil particles. This caused jumps in the measured pulse travel time by TDR as the soil dried or wetted. At certain low soil-water content, the base of the TDR waveform moved up above its first peak (as estimated in Fig. 1) and the program algorithm could not draw a proper tangent at the base of the waveform and failed to analyse the waveform properly. This situation occurred for all nine probes below certain limiting soil-water content specific to the length of the probe. For all probes ≥2.5 cm in length,
tTDR varied linearly with tg both in sand and sandy loam soil as illustrated in Fig. 3a (top) for the 4.0 cm probe.
Figure 3b (bottom) visualises a comparison between tTDR measured under two different treatments of the initial
Fig. 2. First derivatives of the TDR waveforms shown in Fig. 1 for
the 2 cm and 4 cm long probes.
0.0 0.1 0.2 0.3 0.4 0.5
distance from cable tester output point [m] -2 1 4 -2 1 4 7 fi rst d eri vati ve (*1 0 -4 ) 2 cm probe 4 cm probe derivative 1 derivative 2 derivative 3
reflection (fixed and relocated) and tg for all probes ≥2.5 cm in length. TDR underestimated tTDR over the whole range of soil-water content when the point of initial reflection on the waveforms was relocated. The deviation between tTDR and
tg increased with decreasing tg. This result suggests fixing the initial reflection of the TDR pulse when TDR measurement is intended by using WinTDR99. For the fixed initial reflection of the pulse on the waveform, tTDR varied linearly with tg for all probes ≥2.5 cm in length and followed the 1:1 line both in sand and sandy loam soil (Fig. 3(b)). The coefficient of determination of this linear relationship was r2 = 0.998 for sand (no. of observation = 111) and 0.995 for sandy loam soil (no. of observation = 57). The 1:1 relationship between tTDR and tg with a slope of 1.010 (SE = ± 0.0043) for sand and 1.001 (SE = ± 0.0097) for sandy loam soil ensured that TDR measured the pulse travel time accurately with the probes ≥2.5 cm in length when the point of initial reflection was kept fixed.
The mean absolute deviation between tTDR and tg was 77 ps for the 2.3 cm long probe and 1.39 ps for all probes ≥2.5 cm in length. These results indicate the failure of the small probes, <2.5 cm, in the measurement of pulse travel time in soils. Amato and Ritchie (1995) quantified the error in travel
time measurement in air using short-circuited probes ranging from 1 to 15 cm in length. They obtained high coefficients of variation (2.8 – 7.3%) for travel times <100 ps and relatively low (<3%) values for higher travel times. Assuming the dielectric constant of air = 1 and the velocity of TDR pulse in air = 3 × 10⁸ m s–1, Eqn. (1) results in a 100 ps pulse travel time from a 3-cm long probe. Thus, the accuracy criterion in the observation of Amato and Ritchie (1995) further confirms the results stated above.
Since TDR cable tester measures the pulse travel time
tTDR through the probes to estimate ε and θ based on Eqns. (1) and (2), respectively, it is assumed that there is a minimum measurable travel time of the pulse tmin for a particular length of a probe L and dielectric constant of the soil ε. When the travel time t (= L√ε/c in Eqn. 1) becomes greater than tmin, which would be possibly close to the rise time of the pulse (200 ps), the TDR measurement of ε and θ will be accurate. For a particular L and tmin, εmin can be given based on Eqn 1, and Eqn. 2 gives the corresponding minimum water content θmin. Roughly speaking, it was observed that TDR could not measure accurately the pulse travel time <300 ps (Fig. 3) that was close to the rise time of the pulse (200 ps). In practical measurements, this
0 600 1200 tg [ps] 200 400 600 200 400 600 0 400 800 200 400 600 0 600 1200 tTD R [ps ]
sand sandy loam
300 600 900
200 400 600
2.3 cm probe 4.0 cm probe
1:1 line
relocated initial reflection
fixed initial reflection
(a)
(b)
Fig. 3. Relationship between TDR-measured pulse travel time tTDR and predicted pulse travel time tg in sand and sandy loam soil for: (a) the fixed initial reflection of the TDR pulse on the waveforms of 2.3 cm and 4 cm long probes and (b) both fixed and relocated initial reflection of the TDR pulse on the waveforms of all probes =2.5 cm in length.
M. A. Mojid
approximate lowest travel time could be obtained for various combinations of probe length and soil-water content. Assuming tmin = 300 ps, it is possible to determine the lowest measurable q for a particular length of the probe Lgreater than 2.5 cm by: θ > f(L); (L ≥ 2.5 cm). However, it should be noted that these smallest probes would measure ε accurately but the accuracy in the determination of θ would depend on the accuracy of ε - θ relationship such as Eqn. 2.
COMPARISON OF ELECTRICAL CONDUCTIVITY
Figure 4 illustrates the relationship between the TDR-measured electrical conductivity of NaCl solutions σTDR and the electrical conductivity measured by the conductivity meter σm for all probes ≥2.5 cm in length. The σm – σTDR relationship was linear in an arithmetic paper with a slope of 0.9996 (SE = ± 0.0024). The coefficient of determination
r2 was 0.9996 (no. of observation = 70). Since the small values clustered together, log–log scale was used to show them clearly. At very low electrical conductivity of the solutions, σm<0.2 dS m–1 for tap water, TDR underestimated electrical conductivity. The observed 1:1 relationship between the two independently measured electrical conductivities showed the applicability of the probes to measure electrical conductivity. The length of the probe did not influence the accuracy of measurement.
Summary
Small TDR probes, <2.5 cm long, provided trough-shaped waveforms with rounded corners at the points of their reflection from the probe ends due to the combined effect of the rise time and large transition time of the TDR pulse. The sharpness of the reflection point on the waveform increased both with the increasing probe length and soil-water content. The transition time of the TDR pulse at the probe entrance increased with decreasing soil-water content and caused a rightward movement of the first peak of the waveform at the probe entrance. Consequently, the algorithm of WinTDR99 determined the length of travel path of the pulse through the probes that was smaller than the actual travel path.
TDR-measured pulse travel time tTDR varied erratically with the predicted pulse travel time tg for the small probes, <2.5 cm long. For the longer probes, ≥2.5 cm in length, tTDR versus tg plot followed the 1:1 line. TDR could not measure
tTDR<300 ps accurately. A minimum probe length Lmin and the lowest allowable soil-water content θmin that the probe can measure accurately, govern this lowest pulse travel time
tmin. The electrical conductivity of salt solutions measured by the probes ≥2.5 cm in length agreed well with that measured by a conductivity meter stating the suitability of the probes to measure electrical conductivity. Probe length did not influence noticeably the accuracy of electrical conductivity measurement.
References
Amato, M. and Ritchie, J.T., 1995. Small spatial scale soil-water content measurement with time-domain reflectometry, Soil Sci.
Soc. Am. J., 59, 325–329.
Dalton, F.N. and van Genuchten, M.Th., 1986. The time-domain reflectometry method for measuring soil-water content and salinity, Geodarma, 38, 237–250.
Giese, K. and Tiemann, R., 1975. Determination of the complex permittivity from thin sample time-domain reflectometry, improved analysis of the step response waveform, Adv. Mol.
Relax. Processes, 7, 45–49.
Heimovaara, T.J., 1993. Design of triple-wire time-domain reflectometry probes in practice and theory, Soil Sci. Soc. Am.
J., 57, 1410–1417.
Hook, W.R. and Livingston, N.J., 1995. Propagation velocity errors in time-domain reflectometry measurements of soil water, Soil
Sci. Soc. Am. J., 59, 92–96.
Kelly, S.F., Selker, J.S. and Green, J., 1995. Using short soil moisture probes with high-band with time-domain reflectometry instruments, Soil Sci. Soc. Am. J., 59, 97–102.
Keng, J.C.W. and Topp, G.C., 1983. Measuring water content of soil columns in the laboratory: A comparison of gamma ray attenuation and time-domain techniques, Can. J. Soil Sci., 63, 37–43.
Lancaster, G., 1992. Introduction to fields and circuits. Oxford University Press, Oxford, UK.
Malicki, M.A., Plagge, R., Renger, M. and Walczak, R.T., 1992. Application of time-domain reflectometry (TDR) soil moisture
0.1 1 1E+1 σm [dS/m] 1E-2 0.1 1 1E+1 σTD R [ dS/ m] 2.5 cm probe 3.0 cm probe 3.5 cm probe 4.0 cm probe 4.5 cm probe 10.0 cm probe 1:1 line
Fig. 4 . Relationship between electrical conductivity of salt solutions
measured by TDR probes ≥2.5 cm in length sTDR (dS m-1) and electrical conductivity of the same salt solutions measured by a conductivity meter sm (dS m-1). The s
m - sTDR relationship was linear in an arithmetic paper; the purpose of using log – log scale is to
miniprobe for the determination of unsaturated soil-water characteristics from undisturbed soil cores, Irrig. Sci., 13, 65– 72.
Nissen, H.H., Moldrup, P. and Henriksen, K., 1998. High-resolution time-domain reflectometry coil probe for measuring soil-water content, Soil Sci. Soc. Am. J., 62, 1203–1211. Nissen, H.H., Moldrup, P., Olesen, T. and Raskmark, P., 1999.
Printed circuit board time-domain reflectometry probe: Measurements of soil-water content, Soil Sci., 164, 454–466. Oliver, B.M. and Cage, J.M., 1971. Electronic measurements and
instrumentation. McGraw-Hill, New York.
Or, D., Fisher, B., Hubscher, R.A. and Wraith, J., 1999.
WinTDR99-users guide. Utah State University, Utah, USA.
Tektronix, 1987. 1502C metallic time-domain reflectometer:
operator manual. Tektronix, Inc. Beaverton, OR97077, USA.
Topp, G.C., Davis, J.L. and Annan, A.P., 1980. Electromagnetic determination of soil-water content: measurements in coaxial
transmission lines, Water Resour. Res., 16, 574–582.
Topp, G.C., Davis, J.L., Bailey, W.G. and Zebchuck, W.D., 1984. The measurement of soil-water content using a portable TDR hand probe, Can. J. Soil Sci., 64, 313–321.
Wraith, J.M., Comfort, S.D., Woodburry, B.L. and Inskeep, W.P., 1993. A simplified waveform analysis approach for monitoring solute transport using time-domain reflectometry, Soil. Sci. Soc.
Am. J., 57, 637–642.
Yanuka, M., Topp, G.C., Zegellin, S. and Zebchuck, W.D., 1988. Multiple reflection and attenuation of time-domain reflectometry pulses: Theoretical considerations for applications to soil and water, Water Resour. Res., 24, 939–944.