HAL Id: hal-00330743
https://hal.archives-ouvertes.fr/hal-00330743
Submitted on 15 Oct 2008HAL is a multi-disciplinary open access
archive for the deposit and dissemination of sci-entific research documents, whether they are pub-lished or not. The documents may come from teaching and research institutions in France or abroad, or from public or private research centers.
L’archive ouverte pluridisciplinaire HAL, est destinée au dépôt et à la diffusion de documents scientifiques de niveau recherche, publiés ou non, émanant des établissements d’enseignement et de recherche français ou étrangers, des laboratoires publics ou privés.
Millennial-scale climatic variability between 340 000 and
270 000 years ago in SW Europe: evidence from a NW
Iberian margin pollen sequence
S. Desprat, M. F. Sánchez Goñi, J. Duprat, Elsa Cortijo, J. F. Mcmanus
To cite this version:
S. Desprat, M. F. Sánchez Goñi, J. Duprat, Elsa Cortijo, J. F. Mcmanus. Millennial-scale climatic variability between 340 000 and 270 000 years ago in SW Europe: evidence from a NW Iberian margin pollen sequence. Climate of the Past Discussions, European Geosciences Union (EGU), 2008, 4 (2), pp.375-414. �hal-00330743�
CPD
4, 375–414, 2008 Millennial-scale climatic variability between 340–270 kyr S. Desprat et al. Title Page Abstract Introduction Conclusions References Tables Figures ◭ ◮ ◭ ◮ Back CloseFull Screen / Esc
Printer-friendly Version
Interactive Discussion Clim. Past Discuss., 4, 375–414, 2008
www.clim-past-discuss.net/4/375/2008/
© Author(s) 2008. This work is distributed under the Creative Commons Attribution 3.0 License.
Climate of the Past Discussions
Climate of the Past Discussions is the access reviewed discussion forum of Climate of the Past
Millennial-scale climatic variability
between 340 000 and 270 000 years ago in
SW Europe: evidence from a NW Iberian
margin pollen sequence
S. Desprat1,2, M. F. S ´anchez Go ˜ni1, J. Duprat1, E. Cortijo3, and J. F. McManus2
1
EPHE, UMR-CNRS 5805, EPOC, Universit ´e Bordeaux 1, Avenue des Facult ´es, 33405 Talence, France
2
Woods Hole Oceanographic Institution, Department of Geology and Geophysics, Woods Hole, MA 02543, USA
3
Laboratoire des Sciences du Climat et de l’Environnement, LSCE-Vall ´ee, B ˆat. 12, avenue de la Terrasse, F-91198 Gif-Sur-Yvette cedex, France
Received: 13 February 2008 – Accepted: 25 February 2008 – Published: 28 March 2008 Correspondence to: S. Desprat ([email protected])
CPD
4, 375–414, 2008 Millennial-scale climatic variability between 340–270 kyr S. Desprat et al. Title Page Abstract Introduction Conclusions References Tables Figures ◭ ◮ ◭ ◮ Back CloseFull Screen / Esc
Printer-friendly Version
Interactive Discussion
Abstract
We present a new high-resolution marine pollen record from NW Iberian margin sedi-ments (core MD03-2697) covering the interval between 340 000 and 270 000 years ago a time period centred on Marine Isotope Stage (MIS) 9 and characterised by particu-lar baseline climate states. This study enables to document the vegetation changes
5
in north-western Iberian Peninsula and therefore the terrestrial climatic variability at orbital and in particular at millennial scales during MIS 9, directly on a marine stratig-raphy. Suborbital vegetation changes in NW Iberia in response to cool/cold events are detected throughout the studied interval even during MIS 9e ice volume minimum. However, they appears more frequent and of higher amplitude during the 30 000 years
10
following the MIS 9e interglacial period and during the MIS 9a-8 transition which cor-respond to intervals of an intermediate to high ice volume and mainly periods of ice growth. Each suborbital cold event detected in NW Iberia has a counterpart in the southern Iberian margin SST record. High to moderate amplitude cold episodes de-tected on land and in the ocean appears related to changes in deep water circulation
15
and likely to iceberg discharges at least during MIS 9d, the mid-MIS 9c cold event and MIS 9b. This work provides therefore additional evidence of a pervasive millennial-scale climatic variability in the North Atlantic borderlands throughout past climatic cy-cles of the Late Pleistocene, regardless of glacial state. However, ice volume might have an indirect influence on the amplitude of the millennial climatic changes in
south-20
ern Europe.
1 Introduction
An increasing number of studies on previous climatic cycles shows that millennial-scale variability is an inherent pattern of the Late Pleistocene climates affecting glacial periods (Bond et al., 1993; Bond and Lotti, 1995; Dansgaard et al., 1993; Grootes et
25
CPD
4, 375–414, 2008 Millennial-scale climatic variability between 340–270 kyr S. Desprat et al. Title Page Abstract Introduction Conclusions References Tables Figures ◭ ◮ ◭ ◮ Back CloseFull Screen / Esc
Printer-friendly Version
Interactive Discussion intervals of reduced ice volume such as the current or the last interglacial (Bond et al.,
1997; Delmotte et al., 2004, EPICA community members, 2004; Martrat et al., 2004, 2007; McManus et al., 1999; Oppo and Lehman, 1995; Oppo et al., 1998, 2001, 2007). However, the origin of this variability remains unclear. Several hypotheses have been proposed including internal ocean oscillations, periodic calving of ice-sheets or solar
5
forcing (Bond et al., 2001; Broecker et al., 1990; Mayewski et al., 1997; Sakai and Peltier, 1997; van Kreveld et al., 2000; van Geel et al., 1999).
So far, few studies focused on the climatic variability of the interval between 340 000 and 270 000 years ago, encompassing the interglacial complex Marine Isotope Stage (MIS) 9. Ruddiman (2007) lately called attention to this isotopic stage: based on the
10
caloric summer half-year insolation, the early part of MIS 9 is the closest analog to the late Holocene throughout the last 450 000 years. The Antarctica ice cores record during the MIS 9 peak interglacial the highest greenhouse gas concentrations of the past 650,000 years, excluding the Holocene industrial period (Petit et al., 1999; Siegen-thaler et al., 2005; Spahni et al., 2005). Pollen analysis, from the southern Portuguese
15
margin core MD01-2443, revealed suborbital vegetation change during the MIS 9e ice volume minimum bringing to an end the interglacial forest stage (Tzedakis et al., 2004; Roucoux et al., 2006). These authors pointed out the potential role of the suborbital climatic variability on the duration of the interglacials. MIS 9 is therefore a valuable complement to the better studied intervals such as MIS 5 or 11 to investigate the
cli-20
mate of interglacial periods.
Despite a different astronomical forcing but a similar range of sea level, the interval ∼310–290 kyr ago (MIS 8.6 or 9b) and MIS 3 are marked by a suborbital variability of similar pacing and amplitude in the Vostok deuterium record (Siddall et al., 2007). In the southern Portuguese margin region, frequent moderate to high amplitude decreases
25
in sea surface temperatures (SST) strikingly punctuate the 30 000 years following the MIS 9e interglacial period (Martrat et al., 2007). Over this period covering one and a half precession cycle, the summer insolation maximum at high latitudes was not par-ticularly strong (Berger, 1978), CO2 concentrations decreased following a particular
CPD
4, 375–414, 2008 Millennial-scale climatic variability between 340–270 kyr S. Desprat et al. Title Page Abstract Introduction Conclusions References Tables Figures ◭ ◮ ◭ ◮ Back CloseFull Screen / Esc
Printer-friendly Version
Interactive Discussion gradual general trend (Petit et al., 1999) and although some sea level reconstructions
give somehow divergent results (Shackleton et al., 2000; Stirling et al., 2001), ice vol-ume appears to have increased following a quite gradual general trend (McManus et al., 1999; Waelbroeck et al., 2002). MIS 9 period gives, therefore, the opportunity to study the millennial-scale climatic variability under different baseline climate states
re-5
lated to different astronomical forcing, ice volume and greenhouse gas concentrations. Documenting the response of the different Earth’s environments would ultimately bring new insights in the mechanisms controlling the rapid climatic changes. However, the vegetation and terrestrial climate response to this high frequency climatic variability remains ill-documented for the MIS 9 time interval.
10
We present here a high resolution marine pollen record covering the interval 340 000–270 000 years ago from the north-western Iberian margin core MD03-2697. It will allow us to refine and characterize the sequence of suborbital climatic events affecting the Iberian region during MIS 9. Pollen analysis of marine sediments permits to perform a direct correlation of the terrestrial and marine climatic indicators and to
15
record the vegetation change against a marine isotopic time-scale. Marine pollen se-quences from the Iberian margin have already shown their particular ability to detect the millennial scale climatic variability and to delineate the linkage between atmospheric and oceanic changes over the previous (Desprat et al., 2005; 2006) and more recent climatic cycles (Naughton et al., submitted; Roucoux et al., 2005, 2006; Sanchez Go ˜ni
20
et al., 1999, 2000, 2005, in press; Tzedakis et al., 2004).
On the basis of a large forest development at southern European sites during MIS 8.5 terrestrial equivalent which appears of similar extent to those of deglacial substages such as MIS 5a and 5c, Tzedakis et al. (1997) first suggested that substage 8.5 should belong to MIS 9. The direct land-sea correlation from SW Iberian margin confirmed that
25
a large southern European forest expansion is coeval with the anomalous light benthic oxygen isotopic event, which is usually labeled 8.5 according to the isotopic stratigraphy of Imbrie et al. (1984) and Prell et al. (1986) (Tzedakis et al.; 2004). Although sea level reconstructions show similar lowstands during MIS 8.6 and 3, they display a sea level
CPD
4, 375–414, 2008 Millennial-scale climatic variability between 340–270 kyr S. Desprat et al. Title Page Abstract Introduction Conclusions References Tables Figures ◭ ◮ ◭ ◮ Back CloseFull Screen / Esc
Printer-friendly Version
Interactive Discussion maximum during MIS 8.5 as high or higher than during the previous deglacial substage
9.1 (McManus et al., 1999; Shackleton et al., 2000; Siddall et al., 2003; Stirling et al., 2001; Waelbroeck et al., 2002) and generally of similar range to the MIS 5.1 or 5.3 highstands (Shackleton et al., 2000; Siddall et al., 2003; Waelbroeck et al., 2002). Throughout this paper, we will follow accordingly the isotopic stage notation applied by
5
Tzedakis et al. (2004), Roucoux et al. (2006) and Martrat et al. (2007) to the Portuguese margin benthic δ18O record over the interval 340–270 kyr. This implies including the isotopic substages 8.5 and 8.6 in MIS 9 and labelling them from now “MIS 9a”and “MIS 9b”, respectively.
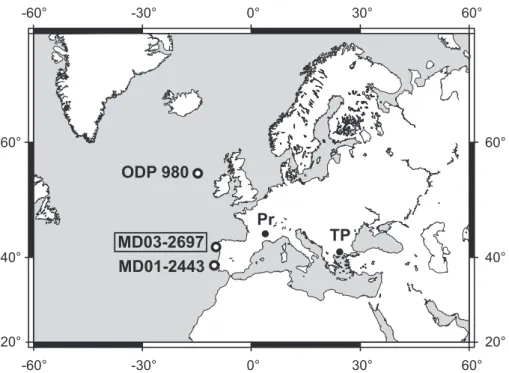
2 Environmental setting 10
We examined sediments from MIS 9 interval from core MD03-2697 located on the north-western Iberian margin, at ∼100 km off the Galician coast (42◦09.6′N, 09◦42.1′W, 2,164 m). This site is under the influence of the North Atlantic Deep Water mass. The present-day climate of north-western Iberia is temperate and humid with mean annual temperatures between 10 and 17◦C and mean annual precipitation between
15
1000 and 2000 mm.an−1 (Atlas Nacional de Espa ˜na, 1992). This region is incised in the north by the Rias Baixas valleys (Galician coast basin) and the Mi ˜no-Sil river (Sil basin) (Atlas Nacional de Espa ˜na, 1993) and crossed in the south by the Douro river which are the main suppliers of terrestrial sediments to the shelf (Naughton et al., 2007). North-western Iberia belongs to the Eurosiberian and sub-Mediterranean
20
regions (Ozenda, 1982) where deciduous oak woodlands with heaths dominate (Alcara Ariza et al., 1987).
3 Material and methods
Core MD03-2697, retrieved in 2003 during the PICABIA campaign, is constituted of hemi-pelagic clays. The sedimentological description reveals an apparently
CPD
4, 375–414, 2008 Millennial-scale climatic variability between 340–270 kyr S. Desprat et al. Title Page Abstract Introduction Conclusions References Tables Figures ◭ ◮ ◭ ◮ Back CloseFull Screen / Esc
Printer-friendly Version
Interactive Discussion ous sedimentation. We have achieved a multiproxy study of the sediments from MIS
9 interval, including pollen analysis, stable oxygen isotope measurements from plank-tonic and benthic foraminifera and plankplank-tonic foraminifera counting and derived SST estimations. The MIS 9 interval in core MD03-2697 was initially located using plank-tonic δ18O profiles from the complete sedimentary sequence (Desprat, 2005).
5
3.1 Isotopic analysis
For the benthic foraminifera oxygen isotopic data, 42 levels were subsampled between 2860 and 3260 cm at 20, 10, 5 or 2 cm interval between samples. Each specimen of benthic foraminifera (Cibicides wuellerstorfi) has been picked up within the 250– 315 µm grain-size fraction, and cleaned with distilled water. Each aliquot (4 to 8
spec-10
imens, representing a mean weight of 80 µg) has been prepared using a Micromass Multiprep autosampler, using an individual acid attack for each sample. The CO2 gas
extracted has been analyzed against NBS 19 standard, taken as an international ref-erence standard. Isotopic analyses have been carried out at the Laboratoire des Sci-ences du Climat et l’Environnement (LSCE, Gif-sur-Yvette, France), using a delta plus
15
Finnigan isotope mass spectrometer. All the isotopic results are presented versus PDB. The mean external reproducibility of powdered carbonate standards is ±0.05‰ for oxygen. Absence of the foraminifera species C. wuellerstorfi and M. barleeanus at the bottom of the studied interval precluded a benthic isotopic record of the MIS 10-9 glacial-interglacial transition.
20
The same preparation technique was applied to analyze stable oxygen isotopes of planktonic foraminifera from 70 levels subsampled at 20 to 2 cm intervals. The plank-tonic foraminifera Globigerina bulloides was used between 2860 and 3270 cm and Neogloboquadrina pachyderma left coiling over the intervals 2720–2860 and 3260– 3400 cm.
CPD
4, 375–414, 2008 Millennial-scale climatic variability between 340–270 kyr S. Desprat et al. Title Page Abstract Introduction Conclusions References Tables Figures ◭ ◮ ◭ ◮ Back CloseFull Screen / Esc
Printer-friendly Version
Interactive Discussion 3.2 Planktonic foraminifera quantitative climatic reconstruction
Summer and winter sea surface temperatures (SST) were estimated from planktonic foraminifera assemblages using the Modern Analogue Technique from the database of Pflaumann et al. (1996) improved by Cortijo E. (LSCE) and Duprat J. (EPOC UMR-CNRS 5805).
5
3.3 Pollen analysis
Pollen analysis was completed on 70 levels between 3300 and 2860 cm at 10 to 2 cm intervals. Pollen samples preparation followed the procedure described by de Vernal et al. (1996) and modified at EPOC UMR-CNRS 5805, Bordeaux I University (De-sprat, 2005). After chemical and physical treatments using cold HCl, cold HF and
10
sieving through 10 µm nylon mesh screens, the residue was mounted unstained in glycerol. Pollen counting was achieved using a Zeiss Axioscope light microscope at 500 and 1250 (oil immersion) magnifications. A minimum of 100 pollen grains with-out Pinus and 20 taxa were identified in each sample. The pollen percentages for each taxon are based on a main pollen sum that excludes Pinus because of its
over-15
representation in marine sediments (Heusser and Balsam, 1977; Turon, 1984), aquatic plants, pteridophyte spores and indeterminable pollen grains. Pinus percentages were calculated from the main sum plus Pinus. Spores and aquatic pollen percentages were obtained from the total sum including pollen, spores, indeterminables and unknowns. We have defined the major forested phases as periods showing a classical tree
suc-20
cession which is known in southern Europe and in particular in NW Iberia for beginning with the development of Betula, deciduous Quercus, and ending by the expansion of late successional trees such as Carpinus betulus and Fagus (Tzedakis et al., 2001; Desprat et al., 2007). Local names are given to these major forested periods.
CPD
4, 375–414, 2008 Millennial-scale climatic variability between 340–270 kyr S. Desprat et al. Title Page Abstract Introduction Conclusions References Tables Figures ◭ ◮ ◭ ◮ Back CloseFull Screen / Esc
Printer-friendly Version
Interactive Discussion 3.4 Chronology
We established the chronology of core MD03-2697 by graphical correlation between its planktonic δ18O curve and that of core MD01-2443 located on the southern Portuguese margin (Tzedakis et al., 2004; Martrat et al., 2007). Based on the similarity between the benthic δ18O record of southern Iberian margin cores and Antarctica temperatures
5
(Shackleton et al., 2000), MD01-2443 benthic δ18O signal was aligned to the EPICA Dome C isotopic record (edc2 age-scale) for developing the age model (Tzedakis et al., 2004; Martrat et al., 2007). The low resolution of the MD03-2697 benthic δ18O signal and lack of measurements during Termination IV impeded us to develop the age-model of our core by lining up the benthic isotopic records. However, as both cores were
10
retrieved on the Iberian margin, the major oscillations of their planktonic isotopic signals can be reasonably assumed synchronous. Despite the analysis-resolution difference, MD01-2443 major planktonic δ18O changes are clearly identified in our sequence. We tied up 6 points of heavier isotopic values and the first point of the light MIS 9e isotopic values over the record, allowing a strong correlation (r2=0.86) between the tuned and
15
target planktonic δ18O curves.
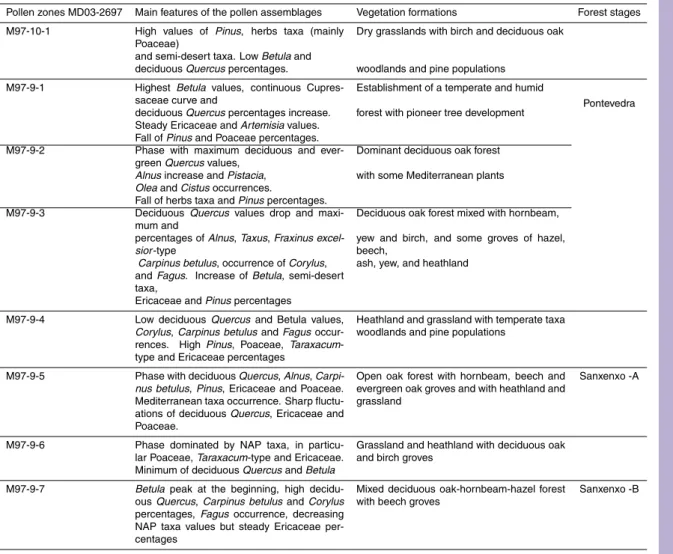
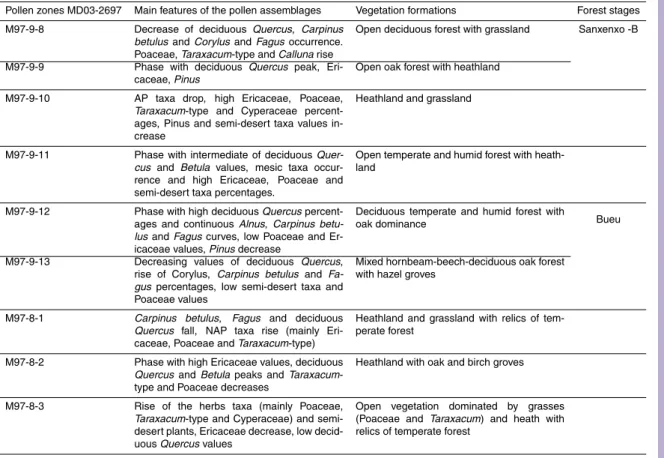
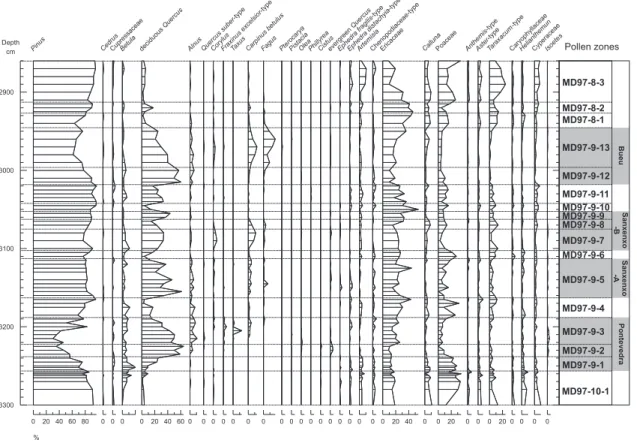
4 The north-western Iberian margin record – Results
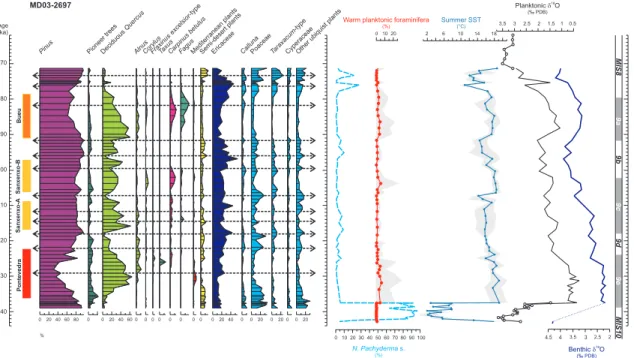
The main features of the MD03-2697 pollen record and inferred vegetation changes during MIS 9 in NW Iberia are presented in Table 1, Fig. 2 and the direct land-sea correlation in Fig. 3. Three temperate forest periods (Pontevedra, Sanxenxo and Bueu)
20
(Table 1, Fig. 3) characterize each interglacial substages of stage 9 (MIS 9e, c and a) interspaced by more or less open vegetation intervals. Afforestation in north-western Iberia generally began with Betula (birch), and deciduous Quercus (oak) followed by Alnus (alder), Corylus (hazel), Carpinus betulus (hornbeam), Fagus (beech), Taxus (yew) or Pinus (pine). These trees are the dominant components of the temperate and
25
CPD
4, 375–414, 2008 Millennial-scale climatic variability between 340–270 kyr S. Desprat et al. Title Page Abstract Introduction Conclusions References Tables Figures ◭ ◮ ◭ ◮ Back CloseFull Screen / Esc
Printer-friendly Version
Interactive Discussion climatic conditions influence the vegetation cover by promoting forest opening. In our
pollen record, increase of Ericaceae (heath) or dry-grassland taxa (mainly Poaceae, Taraxacum-type and semi-desert plants such as Artemisia, Ephedra distachya-type, Ephedra fragilis-type and Chenopodiaceae) at the expense of the tree taxa, outlines the vegetation response to cold and cool events.
5
The first major forested period (Pontevedra, 12 kyr duration) occurring during MIS 9e displays a maximum expansion of deciduous oak forest and Mediterranean plants (evergreen Quercus, Olea and Pistacia) between 334 and 331 ka, revealing the climate optimum of this warm period in north-western Iberia. An abrupt decrease of decidu-ous oak populations at ∼330 ka, principally in favor of heath, marks the end of this
10
optimum in this region. Subsequently, deciduous oak populations weakly re-expand before beginning to reduce as yew, hornbeam and finally beech developed. The ex-pansion of these latecomer trees reveals the temperature decrease on the continent characterizing the second part of Pontevedra. The climate optimum of this interval and the end-phase cooling observed on land are synchronously recorded in the ocean. The
15
climate optimum is reflected by the lightest planktonic δ18O values and by the maximal development of the warmest planktonic species of MIS 9, with summer SST estimates by at around 19◦C, similar to Holocene reconstruction (Naughton, 2007). However, ocean surface warmed quickly before the beginning of Pontevedra and afforestation shown by the expansion of birch and deciduous oak occurred progressively over a
20
couple of thousand years. Although the lack of data precludes the identification of the real beginning of the MIS 9e benthic isotopic plateau, the record shows that the light-est benthic δ18O values are reached before the maximal development of the deciduous forest and Mediterranean plants. The end-phase cooling is also revealed by planktonic foraminifera assemblages indicating a 3◦C summer SST drop and a planktonic δ18O
25
increase. This change is also contemporaneous with the end of the benthic isotopic plateau suggesting an initial accumulation of glacial ice in the high latitudes.
After the establishment of an open vegetation cover dominated by heathland and grassland during MIS 9d, a new forested period, named Sanxenxo, begins. Decidous
CPD
4, 375–414, 2008 Millennial-scale climatic variability between 340–270 kyr S. Desprat et al. Title Page Abstract Introduction Conclusions References Tables Figures ◭ ◮ ◭ ◮ Back CloseFull Screen / Esc
Printer-friendly Version
Interactive Discussion oak forest briefly reached an expansion similar to that of Pontevedra at the beginning
of Sanxenxo but in general the forest cover remained less extensive. Summer SST estimations indicate warm conditions (∼18◦C) during the second part of Sanxenxo (-B) but do not show a warming during the first part of Sanxenxo (-A) probably because of the relatively high N. pachyderma s. percentages. Such polar foraminifera percentages
5
seem quite anomalous as the planktonic δ18O signal would indicate a warming at the beginning of Sanxenxo. Moreover, the error on the summer SST estimations is large during the whole Sanxenxo-A interval. The Sanxenxo period occurs during the inter-glacial substage MIS 9c but the associated benthic δ18O values are not clearly lighter than during MIS 9d and began to decrease quickly at 312 ka.
10
Interestingly, in addition to a relatively smaller extent of the temperate forest, the Sanxenxo period can be distinguished by abrupt fluctuations of the deciduous oak forest in favour of heathland or grassland. This suggests millennial-scale cooling events in NW Iberia at around 314, 311, 307 and 300 ka. The major one (at 307 ka) is a two-millennia cold episode during which the forest collapsed, explaining our division of
15
this period into Sanxenxo-A and -B. Summer SST estimations clearly record this cold suborbital event by cooling of ∼3◦C but do not show the other cool events detected on
land. However, this could be an artefact due to the lower time-resolution of the marine proxy records and to the anomalously high N. pachyderma s. percentages.
In contrast to Sanxenxo, the last forested period of MIS 9 (Bueu) is associated with
20
a longer benthic δ18O decrease which corresponds to the 9a isotopic substage. The expansion of the temperate forest during periods Bueu and Pontevedra are of similar magnitude. However, during phase Bueu, hornbeam and beech which grow preferen-tially in moister and cooler conditions than deciduous oak, play an important role and Meditterranean plants hardly expands.
25
Between Sanxenxo-B and Bueu, summer SST cooled by 3◦C within MIS 9b and
the north-western Iberian landscape is dominated by herbaceous plants, in paticular heaths. Oak populations decrease strongly at ∼296 ka, reflecting a strong and abrupt cold climatic event in NW Iberia and weaker reduction occurs at 292 ka, just before the
CPD
4, 375–414, 2008 Millennial-scale climatic variability between 340–270 kyr S. Desprat et al. Title Page Abstract Introduction Conclusions References Tables Figures ◭ ◮ ◭ ◮ Back CloseFull Screen / Esc
Printer-friendly Version
Interactive Discussion rapid oak forest expansion associated with the beginning of Bueu.
Finally, while the benthic δ18O increases towards the glacial values of MIS 8, herba-ceous communities become largely dominant, suggesting the establishment of the glacial cold conditions. However, at around 276 ka, some woodlands of birch, oak, hornbeam and hazel expanded while grassland decreased, summer SST increased
5
and planktonic δ18O became lighter. This change can reflect a rapid weak warm fluc-tuation occurring contemporaneously on land and in the ocean during the MIS 9-8 transition.
5 Discussion
5.1 Climatic variability at orbital scale
10
The MIS 9 marine pollen record off Galicia shows the response of the NW Iberian vege-tation at orbital-scale by detecting three major periods of temperate forest development (Pontevedra, Sanxenxo, Bueu) related to the MIS 9 interglacial substages interspersed by 2 more or less open vegetation periods corresponding to the stadial substages 9d and 9b. Forest character and extent of the different periods assign the first major
15
forested period (Pontevedra) as the climate optimum of MIS 9 in NW Iberia, and the second one, Saxenxo, as a period of intermediate climatic amelioration between the forested stages Pontevedra and Bueu occurring during MIS 9e and MIS 9a, respec-tively. These features are commonly recognized in the long southern European pollen sequences Tenaghi Philippon (Tzedakis et al., 2003; Wijmstra and Smit, 1976) and
20
Praclaux (Reille and de Beaulieu, 1995; Reille et al., 2000) and the Portuguese margin pollen record MD01-2443 (Tzedakis et al., 2004; Roucoux et al., 2006). In a review of the long southern European pollen records, Tzedakis (2005) pointed out a broad correspondence between ice volume and southern European forest development over the previous glacial cycles. However, boundaries of isotopic substages and forest
pe-25
CPD
4, 375–414, 2008 Millennial-scale climatic variability between 340–270 kyr S. Desprat et al. Title Page Abstract Introduction Conclusions References Tables Figures ◭ ◮ ◭ ◮ Back CloseFull Screen / Esc
Printer-friendly Version
Interactive Discussion during temperate intervals exhibits an apparent closer relationship with summer
inso-lation changes at 65◦N than with ice volume extent, due to a vegetation response to
climate regimes (Tzedakis et al., 2004; 2003, Tzedakis, 2005; Shackleton et al., 2002). Indeed, as the climate optimum in NW Iberia and in general in southern Europe, the highest sea level and 65◦N summer insolation maximum of MIS 9 interval occurs during
5
substage 9e (Lea et al., 2002; McManus et al., 1999; Siddall et al., 2003; Shackleton et al., 2000; Stirling et al., 2001; Waelbroeck et al., 2002). As noted by Tzedakis et al. (2003) for Tenaghi Philippon site, forest extent in NW Iberia is effectively weaker during MIS 9c than during MIS 9a like 65◦N summer insolation (Fig. 5). The sea level reconstructions display MIS 9a highstand from equivalent to largely higher than that of
10
MIS 9c (McManus et al., 1999; Siddall et al., 2003; Shackleton et al., 2000; Stirling et al., 2001; Waelbroeck et al., 2002). The relationship between forest extent, ice volume and insolation at orbital scale still remains difficult to state within MIS 9 interval.
Although all the records agree in indicating the warm period of MIS 9e as the cli-mate optimum, the difference in warmth between MIS 9 warm periods displayed by
15
the southern European pollen sequences does not always come out so well expressed in North Atlantic records. The highest summer SST from cores MD03-2697, MD01-2443 (Martrat et al., 2007) and ODP 980 (McManus et al., 1999) (Figs. 4 and 5) are as well included in the MIS 9e plateau, characterizing the ice volume minimum of MIS 9. And MIS 9e plateau corresponds to the period of maximal production rate of North
20
Atlantic Deep Water (NADW), inferred from the deepest position of the Deep Western Boundary Current over the Blake-Bahama Outer Ridge (Yokokawa and Franz, 2002). SST during MIS 9a appears warmer than during most of the MIS 9c interval off SW Portugal, equivalent off Galicia and cooler in the subpolar North Atlantic. Further, in the eastern equatorial and southwest Pacific, Mg/Ca SST reconstructions, suggest a
25
warm phase during MIS 9a of at least 1◦C warmer than all along the interval following the interglacial period (Lea et al., 2000; Pahnke et al., 2003). Otherwise, in Antarctica, the deuterium records of Vostok or EPICA-Dome C ice cores show an important warm phase during substage 9a but not warmer than during substage 9c (Petit et al., 1999;
CPD
4, 375–414, 2008 Millennial-scale climatic variability between 340–270 kyr S. Desprat et al. Title Page Abstract Introduction Conclusions References Tables Figures ◭ ◮ ◭ ◮ Back CloseFull Screen / Esc
Printer-friendly Version
Interactive Discussion EPICA members, 2004, Jouzel et al., 2007) (Fig. 5). The degree of warming during
the different MIS 9 warm periods remains difficult to assess because of the seasonal character of the different paleotemperature proxies used, the analysis time resolution and the regional signature of the records.
5.2 Millennial-sale climatic variability
5
5.2.1 Sequence of suborbital events in the Iberian region
NW Iberian vegetation response to millennial-scale climatic variability is clearly recorded in the MD03-2697 marine pollen sequence. Suborbital cold events are ex-pressed by abrupt temperate forest reductions of moderate to high amplitude in partic-ular during the interval from MIS 9d to 9b and during the MIS 9a-MIS 8 transition but
10
also of smaller extent during the warmest interval Pontevedra. To examine the char-acter of the suborbital variability detected in the NW Iberian region, we will compare our data with the Portuguese margin records from core MD01-2443 (Tzedakis et al., 2004; Martrat et al., 2007). Although core MD03-2697 chronology is based on core MD01-2443 age-scale, north-western Iberian vegetation and SST suborbital changes
15
do not always appear synchronous with those of south-western Iberian region. How-ever, such abrupt events during the last glacial period and MIS 5 have been related with rapid shifts in the polar front and considered simultaneous in eastern North At-lantic and in southern Europe (Tzedakis, 2005, Shackleton et al., 2000; Sanchez Go ˜ni et al., 2005 and in press). A certain degree of age uncertainty in our chronology is
20
the result of the graphical correlation of the isotopic signals which are of different time resolution, and because of likely different changes in sediment accumulation rate at each site. The close location of the sites allows us to assume the synchroneity of the abrupt events even if their timing seems slightly different.
During the ice volume minimum, a forest reduction in NW Iberia is recorded, at
25
∼330 ka, marking the end of maximal extent of the deciduous oak forest and Mediter-ranean plants and therefore the end of the climate optimum. In southwestern Iberia,
CPD
4, 375–414, 2008 Millennial-scale climatic variability between 340–270 kyr S. Desprat et al. Title Page Abstract Introduction Conclusions References Tables Figures ◭ ◮ ◭ ◮ Back CloseFull Screen / Esc
Printer-friendly Version
Interactive Discussion an abrupt cold/arid event, occurring at ∼333 ka brought to an end the forested period
while it led to the forest decline in France (Praclaux sequence) and Greece (Tenaghi Philippon) (Tzedakis et al., 2004). The 3000 age discrepancy between SW and NW Iberia for this event is probably an artefact of the age model of our record which is not well constrained over this time period. Like in France and Greece, the forest
recov-5
ered in Galicia afterwards and cooler temperate tree taxa such as Taxus developed while deciduous oak forest kept reducing until the end of Pontevedra. Though such an abrupt event is not obvious in the southern and northwestern Iberian margin SST records, both direct land-sea correlations show that a cooling trend follows the SST optimum values (Fig. 4). Consequently, this suborbital event not only marks the end of
10
the forested stage in SW Iberia (Tzedakis et al., 2004) but also the end of the Ponteve-dra climate optimum in and off Iberia some millennia before the end of the ice volume minimum.
From MIS 9d to MIS 9b, forest reductions in NW Iberia occur every 3 to 5 kyr. MD03-2697 planktonic δ18O and summer SST estimates show cold conditions during MIS 9d
15
and MIS 9b forest reductions and a particular synchronous strong SST decrease and forest decrease at 307 ka during MIS 9c. Unfortunately for most of the events detected by the pollen record, the lower resolution analysis of the marine proxies impedes us to evaluate a SST change counterpart. However, almost each reduction of the tem-perate and humid forest in NW Iberia corresponds within the chronology uncertainties
20
to a summer SST cooling detected by the Portuguese margin record (Iberian Margin Stadials of the third climatic cycle (3IMS) 7 to 15, as named by Martrat et al., 2007). Cold events 3IMS- 14, 13, 12 and 11 have as well an impact on the southern Iberia vegetation (Fig. 5). In the Portuguese margin pollen record, the 3IMS-15 cooling does not correspond to a forest reduction but is contemporaneous of a replacement of
Eri-25
caceae by Poaceae in the herbaceous community which would reveal cooler conditions (Roucoux et al., 2006). Forest extent is strongly reduced at the end of MIS 9b in SW Iberia but the time resolution of MD01-2443 pollen record appears too low for indentify-ing individual vegetation response to cold oscillations 3IMS- 10 and 9. One additional
CPD
4, 375–414, 2008 Millennial-scale climatic variability between 340–270 kyr S. Desprat et al. Title Page Abstract Introduction Conclusions References Tables Figures ◭ ◮ ◭ ◮ Back CloseFull Screen / Esc
Printer-friendly Version
Interactive Discussion cool/arid suborbital event at ∼315 ka which is not detected by the Iberian margin SST
and Portuguese pollen records influenced the NW Iberian vegetation during the MIS 9c ice volume minimum.
Later synchronous vegetation and SST changes in the NW Iberian region are de-tected during the MIS 9a-8 transition. At ∼282 ka, a 2◦C SST decrease is coeval with
5
a minimum of the temperate forest extent and the maximum of Fagus development (Figs. 3 and 4) which reveal cool and wet climate while ice volume is still quite low. Though a cold SST fluctuation is not detected by core MD01-2443, a forest reduc-tion occurred concurrently in southwestern Iberia as well as heavier planktonic δ18O values. Finally, at ∼276 and 273 ka, two severe SST decreases and forest collapses
10
punctuated the end of the MIS 9a-8 transition in both Iberian records while ice volume is already large.
The amplitude of vegetation changes in NW Iberia indicates that 3IMS-15a and 13a which occur during the MIS 9e and 9c ice volume minima, are the weakest oscillations. In contrast, NW Iberian forest collapses reveal the most severe cooling during
3IMS-15
14, 12 and 10. Intervals of open vegetation are also recorded in France (Reille et al., 1995) during MIS 9d and MIS 9b. However, in southwestern Iberia, the relative small contribution of steppe plants and high temperate tree representation implies moder-ate arid and cold conditions during 3IMS-14 in comparison with other stadials such as 3IMS-10 (Roucoux et al., 2006). In the ocean, the SST cooling also appears moderate
20
off south Portugal (Martrat et al., 2007) while in subpolar North Atlantic SST estimates suggest a cooling of relatively high magnitude during MIS 9d though not extreme (Mc-Manus et al., 1999) (Figs. 4 and 5). The difference in the magnitude of vegetation change between the northernmost sites and the SW Iberia one can reflect the latitu-dinal temperature gradient and a certain degree of winter moisture availability during
25
this period which allows maintaining a Mediterranean forest in this region. However, although climatic deterioration, in particular in winter, could have been stronger in NW Iberia and France during MIS 9d, the ecological threshold of the temperate trees could have been crossed at these northernmost sites and not in southern Iberia. Indeed, at
CPD
4, 375–414, 2008 Millennial-scale climatic variability between 340–270 kyr S. Desprat et al. Title Page Abstract Introduction Conclusions References Tables Figures ◭ ◮ ◭ ◮ Back CloseFull Screen / Esc
Printer-friendly Version
Interactive Discussion sites where temperate trees are living near their critical tolerance limit, even a
moder-ate climatic change can genermoder-ate a forest collapse which consequently impedes us to decipher the intensity of different cold events from the pollen diagrams (Tzedakis et al., 2004). Therefore, cooling in NW Iberia could have been moderate during 3IMS-14 or at least less intense than during 3IMS-12 and 10 but as a forest collapse in NW Iberia
5
requires a certain degree of cooling, temperatures must have been clearly lower than during 3IMS-15, 13, 11 and 9.
The NW Iberian pollen record not only allows us to document vegetation changes during MIS 9 in this region but to refine and characterize the sequence of suborbital climatic events previously identified by the south-western Iberian margin SST record.
10
More importantly, this highlights the persistence of millennial-scale climatic variability in southern Europe throughout MIS 9 which appears coupled with North Atlantic SST changes. Effectively, suborbital climatic changes during stage 9 happened whatever ice volume extent but during low ice volume conditions the oscillations seem dampened (cf. events 15a and 13a) and somehow scarcer.
15
5.2.2 Climatic implications
Suborbital variability during ice volume minimum is not a special feature of MIS 9e. Mil-lennial variability represented by North Atlantic surface cooling and ice-rafting episodes as well as vegetation changes in adjacent landmasses appears also a characteristic of Holocene records (Bond et al., 1997; Came et al., 2007; Viau et al., 2002). Within the
20
MIS 5e ice volume minimum, several suborbital SST cooling are detected in the subpo-lar North Atlantic and Nordic Seas and one of them terminated the short-lived climate optimum of the substage (Cortijo et al., 1994; Fronval and Jansen, 1997; Oppo et al., 2001, 2007). At the Grande Pile site (France), a series of cooling episodes are detected during the Eemian and have been suggested possibly related to the oceanic circulation
25
changes in the Nordic seas and North Atlantic (Rousseau et al., 2006). In the Iberian Peninsula, a deciduous forest reduction might also be associated to the suborbital event marking the end of the MIS 5e climate optimum in the North Atlantic. Indeed,
CPD
4, 375–414, 2008 Millennial-scale climatic variability between 340–270 kyr S. Desprat et al. Title Page Abstract Introduction Conclusions References Tables Figures ◭ ◮ ◭ ◮ Back CloseFull Screen / Esc
Printer-friendly Version
Interactive Discussion before the substantial winter temperature decrease which are clearly indicated by the
development of Carpinus betulus in NW and SW Iberian margin sequences, a temper-ate forest minimum (mainly deciduous oak) occurred in SW Iberia at ∼123–122 ka while deciduous oak forest in NW Iberia reduced (Fig. 4 from Sanchez Go ˜ni et al, 2005). Al-though the drier or cooler nature of the suborbital event causing this forest reduction in
5
SW Iberia appears difficult to determine regarding the pollen assemblages, this subor-bital vegetation change seems concurrent to the beginning of SST decrease off Iberia during MIS 5e (Sanchez Go ˜ni et al, 2005) as the MIS 9e observed suborbital event is coeval with the end of SST optimum. In the subpolar North Atlantic, SST cooling events during MIS 5e ice volume minimum are marked by a reduction in MOC
(Merid-10
ional Overturning Circulation) and minor ice-rafting events (Oppo et al., 2007). The MD01-2443 hydrological indicator records (Fig. 5; Martrat et al., 2007) do not reveal, however, significant changes in deep ocean circulation associated with the suborbital oscillations recorded in sea and air surface temperatures during MIS 9e. High sensitive sites to changes in MOC such as ODP site 980 in the subpolar North Atlantic have to
15
be analyzed in order to document the frequency and amplitude of MOC changes during MIS 9. Tzedakis et al. (2004) also showed a south-western Iberian forest collapse in response to an abrupt arid/cool event during the MIS 7e ice volume minimum. These authors pointed out that although the origin of this suborbital climatic variability within MIS 9e and 7e remains unclear, they may be the expression of a global modification
20
in climate conditions though with no apparent change in ice volume as these millennial events appear coeval with the abrupt declines in methane concentrations recorded in Vostok ice core. Bond et al. (2001) interpreted the Holocene millennial variability as the result of atmospheric circulation changes forced by solar irradiance variability and put forward that solar-forced millennial-scale variability is a persistent feature of the past
25
interglacials. The MIS 9e suborbital event could be the particular expression of such a variability. However, there is no consensus on the forcing mechanisms for millennial climatic change during interglacial periods; in particular the solar origin has been lately challenged by a Holocene subpolar North Atlantic record (Came et al., 2007).
Regard-CPD
4, 375–414, 2008 Millennial-scale climatic variability between 340–270 kyr S. Desprat et al. Title Page Abstract Introduction Conclusions References Tables Figures ◭ ◮ ◭ ◮ Back CloseFull Screen / Esc
Printer-friendly Version
Interactive Discussion less of the origin, as suborbital event marks the premature end of the climate optimum
during MIS 9e but also MIS 5e ice volume minimum, when insolation decrease, we can wonder to which extent the millennial-scale variability and the astronomical forcing played each a role in the interglacial demise and further the glacial inception.
Of particular interest is the climatic variability during the 30 000 years following the
5
interglacial period, which is characterized by frequent moderate to high amplitude vege-tation and SST oscillations with recurrence time varying between 3 to 5 kyr even during the forest stage Sanxenxo. The variability of this interval from MIS 9d to 9b is even more outstanding when we look at the other interglacial complexes of the last 500 ka. Large amplitude suborbital oscillations affect also the course of MIS 11 (Desprat et al.,
10
2005; Oppo et al., 1998) as well as MIS 5 in North Atlantic from the subtropics to the subpolar region and adjacent landmasses (Chapman and Shackleton, 1999; Dans-gaard et al., 1993; Heusser and Oppo, 2003; Lehman et al., 2002; McManus et al., 1994, 2002; Kukla et al., 1997; Oppo et al., 2007; Sanchez Go ˜ni et al., 2005). How-ever, forest intervals of the previous climatic cycles from Iberian records (Desprat et al.,
15
2007; Desprat et al., 2006; Martrat et al., 2007; Roucoux et al., 2006; Sanchez Go ˜ni et al., 1999, 2005) do not present oscillations with such recurrence and amplitude as Sanxenxo. For example, the apparent higher stability of temperatures on land and in the ocean during MIS 7 forest stages in the Iberian region (Desprat et al., 2006; Martrat et al., 2007) makes a clear contrast with Sanxenxo. Insolation variations discriminate
20
Sanxenxo from other forest intervals by a relatively low 65◦N summer insolation forcing (Fig. 5) which probably played a role in the relatively low forest extent of this period by conditioning the climate regime (Tzedakis et al., 2003). However, there is no ob-vious direct relationship between the amplitude of the suborbital vegetation response and the magnitude of orbital parameter variations. For instance, the most severe
cool-25
ing episodes in NW Iberia during MIS 9 occur either at high or low summer insolation values (Fig. 5).
A likely explanation for the particular high variability during MIS 9 is related to changes in oceanic circulation and ice-sheet size variations. Martrat et al. (2007) have
CPD
4, 375–414, 2008 Millennial-scale climatic variability between 340–270 kyr S. Desprat et al. Title Page Abstract Introduction Conclusions References Tables Figures ◭ ◮ ◭ ◮ Back CloseFull Screen / Esc
Printer-friendly Version
Interactive Discussion shown that during the last 420 ka, prominent abrupt SST drops in the Portuguese
mar-gin region, which occur during increased ice-sheet extent period, are preceded by decreases in both C26OH ratio and benthic δ
13
C which indicate increasing deep water ventilation by AABW inflow at the Iberian margin and reduction of NADW contribu-tion (Martrat et al., 2007). Such prominent SST drops during MIS 9 are represented by
5
3IMS-7, 8, 9 and 10. The MD01-2443 data (Fig. 4; Martrat et al., 2007) also suggest the likelihood of deep water circulation changes in connection with terrestrial and marine cooling events of moderate amplitude during the interval MIS 9d to 9b. Small decreases in MD01-2443 benthic δ13C which would reveal small weakening of the NADW occur with 3IMS- 15 and 14 cooling episodes. Later, in a context of low deep water
oxygena-10
tion (high C26OH ratio), sharp benthic δ13C drops with small C26OH ratio decreases are associated with the moderate SST cooling events 3IMS-12 and 11. Despite its low time resolution, the ODP site 980 record confirms a reduction in MOC during MIS 9d and 9b, and during a suborbital SST changes at ∼307 ka which likely corresponds to the event 3IMS-12 (Fig. 5; McManus et al., 1999). Consequently, the climate
variabil-15
ity detected in Iberian margin and borderlands is likely linked to recurrent reduction of the northward oceanic heat transport associated to a change in oceanic circulation and European atmospheric gradients. North Atlantic MOC changes whether caused by internal oscillations, ocean-atmosphere mechanisms or solar forcing, are generally involved as driver or amplifier of the millennial scale climatic variability (Bond et al.,
20
1997; Broecker et al., 1990; McManus et al., 2004; Mayewski et al., 1997; Sakai and Peltier, 1997).
McManus et al. (1999) and Schulz et al. (1999) showed a control of ice volume on the amplitude of SST millennial-scale climatic variability. When ice sheets decay or grow, even in a limited extent during stadials, and ice volume surpasses a critical
25
threshold (∼–30 m sea level), suborbital SST decreases of larger amplitude occur in association with abundant iceberg discharges which amplify in turn the reduction in MOC (McManus et al., 1999). Similar mechanism has been proposed for explaining the large amplitude suborbital climatic instabilities during MIS 5 and 11 (Chapman and
CPD
4, 375–414, 2008 Millennial-scale climatic variability between 340–270 kyr S. Desprat et al. Title Page Abstract Introduction Conclusions References Tables Figures ◭ ◮ ◭ ◮ Back CloseFull Screen / Esc
Printer-friendly Version
Interactive Discussion Shackleton, 1999; Oppo et al., 1998, 2007). The benthic δ18O signals of the
differ-ent North Atlantic records suggest a first weak ice-sheet enlargemdiffer-ent during MIS 9d, they even do not reach the 3.5 per mil threshold (Figs. 4 and 5). However, ODP 980 IRD record testifies of iceberg discharges in North Atlantic (Fig. 5) and severe cooling are experienced in the NW Iberian region during this interval. Glacier nucleation near
5
surrounding coasts may have favoured ice margins to reach the sea, and therefore generation icebergs discharges, despite a relatively weak ice-sheet development (Mc-Manus et al., 1994). After a short-lived ice volume minimum during MIS 9c, ice sheet growth appears to begin early during Saxenxo and the benthic δ18O values cross the 3.5 per mil threshold as early as ∼312 ka, i.e. just before the first high amplitude cold
10
event of MIS 9c (3IMS-13), and until ∼290 ka and again during the MIS 9a-8 transi-tion (Figs. 4 and 5). This suggests that ice-sheet size is favourable to instabilities over most of the interval MIS 9c-9b. ODP 980 IRD record testifies of important ice-rafting episodes during MIS 9b and MIS 9c (3IMS-12). However, bottom temperature varia-tions can have a substantial influence on benthic δ18O signal (Skinner and Shackleton,
15
2006) which consequently may not strictly represent ice volume variations.
A number of sea level reconstruction based on different approaches are available for the previous climatic cycles but for MIS 9 they significantly diverge, in particular for the amplitude of sea level drop and rise during MIS 9d and 9c, respectively (Bintanja et al., 2005; Lea et al., 2002; McManus et al., 1999; Siddall et al., 2003; Shackleton et al.,
20
2000; Stirling et al., 2001; Waelbroeck et al., 2002). On the other hand, they broadly agree on the important sea level drop between the MIS 9c ice volume minimum and MIS 9b maximum, reaching glacial values similar to MIS 3. With the lack of IRD evi-dence we cannot put forward the amplification of MOC reduction by ice melting during each cooling event. However, it is noticeable that European vegetation and SST during
25
MIS 9 particularly respond to millennial-scale variability when ice sheets were reorga-nizing, in particular when ice-sheets were building up and reached a significant size. Moreover, even if ice-rafting events do not actually accompanied some cold events, modeling experiments suggest that overturning circulation in the North Atlantic is more
CPD
4, 375–414, 2008 Millennial-scale climatic variability between 340–270 kyr S. Desprat et al. Title Page Abstract Introduction Conclusions References Tables Figures ◭ ◮ ◭ ◮ Back CloseFull Screen / Esc
Printer-friendly Version
Interactive Discussion oscillatory when freshwater discharge is moderate, as might occur during periods of
ice growth (Sakai and Peltier, 1997).
Recently, Siddall et al. (2007) noted that the Vostok ice record strikingly displays during MIS 9b (8.6, ∼290–310 kyr) millennial changes in deuterium and methane of similar frequency and amplitude than the “Bond cycles” during MIS 3 from ∼30 to
5
55 kyr (Siddall et al., 2007). In the Iberian region, the recurrence time of the subor-bital changes over this MIS 9 interval accordingly evokes the MIS 3 glacial variability in terms of Dansgaard-Oeschger cycles or group of them. Between 310 and 290 ka, three Antarctic isotopic maxima are recorded in the Vostok, EPICA – Dome C or Dome Fuji Antarctic ice cores (Petit et al., 1999, EPICA community members, 2004; Kawumara,
10
2007) while the Iberian vegetation and SST records indicate three warming (3IMI-9 and 3IMI-10 and 11, included in Sanxenxo-B) (Fig. 5). The similarity between amplitude of SST changes during both MIS 3 (Martrat et al., 2007) and 9b intervals also seems relevant in the SW Portuguese region but amplitude of vegetation changes in SW and NW Iberia during this MIS 9 interval (in particular cycles 3IM-11 and 10) appears larger
15
than during MIS 3 (Sanchez Go ˜ni et al., in press). However, temperate forest in Iberia does not always record all the range of climate change due to the tolerance threshold of the temperate trees to cold conditions (Tzedakis et al., 2004). Indeed, the difference of cooling between D-O stadials and Heinrich events during the last glacial period is not detected by the Iberian vegetation record although it is evident at other southern
20
European sites (Sanchez Go ˜ni et al., 2000, Tzedakis et al., 2004). Assessment of the cooling difference between MIS 3 and MIS 9 stadials is hardly feasible from the Iberian pollen records. Moreover, after the pollen sequences and SW Iberian margin SST estimates, baseline conditions were warmer during Sanxenxo-B than during MIS 3 in-terstadials (1 to 3◦C warmer) (Martrat et al., 2007, Sanchez Go ˜ni et al., 2000, in press).
25
Therefore, the larger amplitude of temperate forest changes in Iberia does not rule out a possible similar amplitude of climatic change on land during both intervals. In any case, the Iberian margin records confirm that high amplitude multi-millennial climatic oscillations which are likely associated with deep ocean circulation changes, occurred
CPD
4, 375–414, 2008 Millennial-scale climatic variability between 340–270 kyr S. Desprat et al. Title Page Abstract Introduction Conclusions References Tables Figures ◭ ◮ ◭ ◮ Back CloseFull Screen / Esc
Printer-friendly Version
Interactive Discussion in the northern hemisphere during the interval ∼290–310 kyr as predicted by the
mod-elled Greenland δ18O from the reverse seesaw calculation (Siddall et al., 2007) and the methane Vostok record (Delmotte et al., 2004). As a different astronomical forc-ing but a similar range of sea level marks the MIS 9b and MIS 3 intervals, Siddall et al. (2007) proposed that ice volume, in particular through the existence of floating ice
5
shelves at the northern ice-sheet margins, is a key factor to predisposition the Earth climate system to the millennial-scale variability. In turn, Earth’s orbital forcing would play an indirect role in governing the ice-sheet configuration (Siddall et al., 2007). Addi-tionally, CO2reach the same range of concentrations during MIS 9b and MIS 3 (Petit et
al., 1999; Inderm ¨uhle et al., 2000). Greenhouse gases (primarily CO2) and secondary
10
albedo, mainly from northern ice-sheet brightness, which are considered as the ma-jor feedbacks on ice volume (Ruddiman, 2006), must also be a key factor, at least, in setting favourable ice volume conditions to millennial-scale variability. Consequently, the similarity of the suborbital change pattern in the SST records and eventually in the vegetation records from the Iberian margin between MIS 3 and MIS 9b sensus lato,
15
which are periods characterized by lower CO2 concentrations and larger ice volume,
reinforce the potential role of the ice volume in modulating the millennial-scale variabil-ity. However, as suborbital variability seems a pervasive feature of glacial as well as interglacial periods, ice volume state does not explain its origin (Oppo, 1997).
6 Conclusions
20
The new marine pollen record MD03-2697 retrieved in the NW Iberian margin provides a detailed reconstruction of the vegetation changes during MIS 9 in the adjacent land-masses. As shown by the other long European pollen records, the vegetation response in NW Iberia to orbital climatic variability is represented by three forest stages of differ-ent extdiffer-ent, indicating a short-lived climate optimum on land coeval with SST maximum
25
in the mid-latitudes of the eastern North Atlantic ocean during the MIS 9e ice volume minimum, and a second forested interval of moderate warming. More importantly, this
CPD
4, 375–414, 2008 Millennial-scale climatic variability between 340–270 kyr S. Desprat et al. Title Page Abstract Introduction Conclusions References Tables Figures ◭ ◮ ◭ ◮ Back CloseFull Screen / Esc
Printer-friendly Version
Interactive Discussion sequence gives a detailed picture of the vegetation response to millennial-scale
cli-matic variability in NW Iberia. The comparison with the southern Portugueuse margin pollen, SST and hydrological indicator records allowed us to refine and characterize the millennial-scale variability in the Iberian region during this stage. Moreover, the MD01-2443 record (Martrat et al., 2007) shows that the suborbital cold events of high to
mod-5
erate amplitude detected on land and in the ocean are likely related to changes in deep water circulation and an amplification of the reduction in MOC by iceberg discharges is probable at least during MIS 9d, the mid-MIS 9c cold event and MIS 9b. However, improving the resolution of the sensitive subpolar North Atlantic site ODP 980 is nec-essary to assess more accurately the changes in MOC and the ice-rafting episodes
10
related to suborbital cooling of MIS 9. Finally, our work provides additional evidence of the pervasive millennial-scale climatic variability in southern Europe throughout past climatic cycles of the Late Pleistocene, regardless of glacial state. However, subor-bital vegetation changes associated with SST changes, appears more frequent and of higher amplitude during the 30 000 years following the MIS 9e interglacial period and
15
during the MIS 9a-8 transition. As these intervals can be distinguish by an intermedi-ate to high ice volume and are mainly periods of ice growth, this points at an indirect control of the ice volume on the expression of the millennial climatic change.
Acknowledgements. We thank logistics and coring teams on board of the R/V Marion Dufresne
during the PICABIA oceanographic cruise and M.-H. Castera, K. Charlier and O. Ther for
lab-20
oratory assistance. We are also grateful to P. N. Shackleton and L. de Abreu for sharing the isotopic data from core MD01-2443. This research was supported by IPEV (Institut Paul Emile Victor), PNEDC (Programme National d’Etude de la Dynamique du Climat), the Gary Comer Science and Education Foundation and the US National Science Foundation (OCE grants 8-4911100 and 8-256500). This paper is Bordeaux 1 University, UMR-CNRS 5805 EPOC
contri-25
CPD
4, 375–414, 2008 Millennial-scale climatic variability between 340–270 kyr S. Desprat et al. Title Page Abstract Introduction Conclusions References Tables Figures ◭ ◮ ◭ ◮ Back CloseFull Screen / Esc
Printer-friendly Version
Interactive Discussion
References
Alcara Ariza, F., Asensi Marfil, A., de Bolos y Capdevilla, O., Costa Tales, M., Arco Aguilar, M., Diaz Gonzales, T. E., Diez Garretas, B., Fernandez Prieto, J. A., Fernandez Gonzales, F., Izco Sevillando, J., Loidi Arregui, J., Martinez Parras, J. M., Navarro Andres, F., Ninot I Sugranes, J. M., Peinado Lorca, M., Rivas Martinez, S., Sanchez Mata, D., Valle Guitierrez,
5
C., Vigo I Bonada, J., and Wildpret de la Torre, W.: La vegetaci ´on de Espa ˜na, Universidad de Alcala de Henares, Spain, 544 pp., 1987.
Allen, J. R. M., Brandt, U., Brauer, A., Hubberten, H.-W., Huntley, B., Keller, J., Kraml, M., Mackensen, A., Mingram, J., Negendank, J. F. W., Nowaczyk, N. R., Oberh ¨ansli, H., Watts, W. A., Wulf, S., and Zolitschka, B.: Rapid environmental changes in southern Europe during
10
the last glacial period, Nature, 400, 740–743, doi:10.1038/23432, 1999.
Atlas Nacional de Espa ˜na: Climatologia, Ministerio de Obras Publicas y Transportes, Direccion General del Instituto Geografico Nacional, Madrid, Spain, 1992.
Berger, A. L.: Long-Term variations of daily insolation and Quaternary climatic changes, J. Atmos. Sci., 35, 2362–2367, 1978.
15
Bintanja, R., van de Wal, R. S. W., and Oerlemans, J.: Modelled atmospheric tem-peratures and global sea levels over the past million years, Nature, 437, 125–128, doi:10.1038/nature03975, 2005.
Bond, G., Broecker, W., Johnsen, S., McManus, J., Labeyrie, L., Jouzel, J., and Bonani, G.: Correlations between climate records from North Atlantic sediments and Greenland ice,
Na-20
ture, 365, 143–147, doi:10.1038/365143a0, 1993.
Bond, G., Kromer, B., Beer, J., Muscheler, R., Evans, M. N., Showers, W., Hoffman, S., Lotti-Bond, R., Hajdas, I. and Bonani, G.: Persistent solar influence on North Atlantic climate during the Holocene, Science, 294, 2130–2136, doi:10.1126/science.1065680, 2001. Bond, G. and Lotti, R.: Icebergs discharges into the North Atlantic on millennial time scales
25
during the Last Glaciation, Science, 267, 1005–1009, doi:10.1126/science.267.5200.1005, 1995.
Bond, G., Showers, W., Cheseby, M., Lotti, R., Almasi, P., deMenocal, P., Priore, P., Cullen, H., Hajdas, I., and Bonani, G.: A pervasive millennial-scale cycle in North Atlantic Holocene and Glacial Climates, Science, 278, 1257–1266, doi:10.1126/science.278.5341.1257, 1997.
30
Broecker, W. S., Bond, G., Klas, M., Bonani, G., and Wolfli, W.: A salt oscillator in the glacial Atlantic? 1. The concept, Paleoceanography, 5, 469–477, 1990.
CPD
4, 375–414, 2008 Millennial-scale climatic variability between 340–270 kyr S. Desprat et al. Title Page Abstract Introduction Conclusions References Tables Figures ◭ ◮ ◭ ◮ Back CloseFull Screen / Esc
Printer-friendly Version
Interactive Discussion Came, R. E., Oppo, D. W., and McManus, J. F.: Amplitude and timing of temperature and
salinity variability in the subpolar North Atlantic over the past 10 k.y, Geology, 35, 315–318, 2007.
Chapman, M. R. and Shackelton, N. J.: Global ice-volume fluctuations, North Atlantic ice-rafted events, and deep-ocean circulation changes between 130 and 70 ka, Geology, 27, 795–798,
5
1999.
Cortijo, E., Duplessy, J.-C., Labeyrie, L., Leclaire, H., Duprat, J., and van Weering, T. C. E.: Eemian cooling in the Norwegian Sea and North Atlantic Ocean preceding continental ice-sheet growth, Nature, 372, 446–449, doi:10.1038/372446a0, 1994.
Dansgaard, W., Johnsen, S. J., Clausen, H. B., Dahl-Jensen, D., Gundestrup, N. S., Hammer,
10
C. U., Hvidberg, C. S., Steffensen, J. P., Sveinbj ¨ornsdottir, A. E., Jouzel, J., and Bond, G.: Evidence for general instability of past climate from a 250-kyr ice-core record, Nature, 364, 218–220, doi:10.1038/364218a0, 1993.
de Vernal, A., Henry, M., and Bilodeau, G.: Techniques de pr ´eparation et d’analyse en mi-cropal ´eontologie, Les cahiers du GEOTOP 3, 16–27, 1996.
15
Delmotte, M., Chappellaz, J., Brook, E., Yiou, P., Barnola, J. M., Goujon, C., Raynaud, D., and Lipenkov, V. I.: Atmospheric methane during the last four glacial-interglacial cycles: Rapid changes and their link with Antarctic temperature, J. Geophys. Res., 109, D12104, doi:10.1029/2003JD004417, 2004
Desprat, S.: R ´eponses climatiques marines et continentales du Sud-Ouest de l’Europe lors
20
des derniers interglaciaires et des entr ´ees en glaciations, PhD thesis, Universit ´e Bordeaux I, France, 282 pp., 2005.
Desprat, S., Sanchez Goni, M. F., Naughton, F., Turon, J.-L., Duprat, J., Malaize, B., Cortijo, E., and Peypouquet, J.-P.: Climate variability of the last five isotopic interglacials: Direct land-sea-ice correlation from the multiproxy analysis of North-Western Iberian margin deep-sea
25
cores, in: The Climate of Past Interglacials, Developments in Quaternary Science, edited by: Sirocko, F., Litt, T., Claussen, M. and S ´anchez Go ˜ni, M. F., Elsevier, 375–386, 2007.
Desprat, S., S ´anchez Go ˜ni, M. F., Turon, J.-L., Duprat, J., Malaiz ´e, B., and Peypouquet, J.-P.: Climatic variability of Marine Isotope Stage 7: direct land-sea-ice correlation from a multi-proxy analysis of a northwestern Iberian margin deep-sea core, Quat. Sci. Rev., 25, 1010–
30
1026, 2006.
Desprat, S., S ´anchez Go ˜ni, M. F., Turon, J.-L., McManus, J. F., Loutre, M. F., Duprat, J., Malaiz ´e, B., Peyron, O., and Peypouquet, J.-P.: Is vegetation responsible for glacial inception during
CPD
4, 375–414, 2008 Millennial-scale climatic variability between 340–270 kyr S. Desprat et al. Title Page Abstract Introduction Conclusions References Tables Figures ◭ ◮ ◭ ◮ Back CloseFull Screen / Esc
Printer-friendly Version
Interactive Discussion periods of muted insolation changes?, Quat. Sci. Rev, 24, 1361–1374, 2005.
EPICA community members: Eight glacial cycles from an Antarctic ice core, Nature, 429, 623– 628, doi:10.1038/nature02599, 2004.
Fronval, T. and Jansen, E.: Eemian and early Weichselian (140-60 ka) paleoceanography and paleoclimate in the Nordic seas with comparisons to Holocene conditions,
Paleoceanogra-5
phy, 12, 443–462, 1997.
Grimm, E. C., Watts, W. A., L. Jacobson Jr., G. L., Hansen, B. C. S., Almquist, H. and Dieffenbacher-Krall, A. C.: Warm Wet Heinrich Events in Florida, Quat. Sci. Rev., 25, 17–18, 2006.
Grootes, P. M., Stuiver, M., White, J. W. C., Johnsen, S., and Jouzel, J.: Comparison of oxygen
10
isotope records from the GISP2 and GRIP Greenland ice cores, Nature, 366, 552–554, doi:10.1038/366552a0, 1993.
Heusser, L. E. and Balsam, W. L.: Pollen distribution in the N.E. Pacific Ocean, Quat. Res., 7, 45-62, 1977.
Heusser, L. and Oppo, D.: Millennial- and orbital-scale climate variability in southeastern United
15
States and in the subtropical Atlantic during Marine Isotope Stage 5: evidence from pollen and isotopes in ODP Site 1059, Earth Planet. Sci. Lett., 214, 483–490, 2003.
Inderm ¨uhle, A., Monnin, E., Stauffer, B., Stocker, T. F., and Wahlen, M.: Atmospheric CO2
concentration from 60 to 20 kyr BP from the Taylor Dome Ice Core, Antarctica, Geophys. Res. Lett., 27, 735–738, 2000.
20
Kawamura, K., Parrenin, F., Lisiecki, L., Uemura, R., Vimeux, F., Severinghaus, J. P., Hutterli, M. A., Nakazawa, T., Aoki, S., Jouzel, J., Raymo, M. E., Matsumoto, K., Nakata, H., Mo-toyama, H., Fujita, S., Goto-Azuma, K., Fujii, Y. and Watanabe, O.: Northern Hemisphere forcing of climatic cycles in Antarctica over the past 360 000 years, Nature, 448, 912–916, doi:10.1038/nature06015, 2007.
25
Kukla, G., McManus, J. F., Rousseau, D.-D. and Chuine, I.: How long and how stable was the last interglacial?, Quat. Sci. Rev., 16, 605–612, 1997.
Lea, D. W., Pak, D. K., Peterson, L. C., and Hughen, K. A.: Synchroneity of tropical high latitude Atlantic temperatures over the last glacial termination, Science, 301, 1361–1364, doi:10.1126/science.1088470, 2003.
30
Lea, D. W., Pak, D. K., and Spero, H. J.: Climate impact of the Late Quater-nary Equatorial Pacific sea surface temperature variations, Science, 289, 1719–1724, doi:10.1126/science.289.5485.1719, 2000.
CPD
4, 375–414, 2008 Millennial-scale climatic variability between 340–270 kyr S. Desprat et al. Title Page Abstract Introduction Conclusions References Tables Figures ◭ ◮ ◭ ◮ Back CloseFull Screen / Esc
Printer-friendly Version
Interactive Discussion Lehman, S. J., Sachs, J. P., Crotwell, A. M., Keigwin, L. D., and Boyle, E. A.: Relation of
sub-tropical Atlantic temperature, high-latitude ice rafting, deep water formation, and European climate 130 000-60 000 years ago, Quat. Sci. Rev., 21, 1917–1924, 2002.
Martrat, B., Grimalt, J. O., Lopez-Martinez, C., Cacho, I., Sierro, F. J., Flores, J. A., Zahn, R., Canals, M., Curtis, J. H., and Hodell, D. A.: Abrupt temperature changes
5
in the Western Mediterranean over the past 250 000 years, Science, 306, 1762–1765, doi:10.1126/science.1101706, 2004.
Martrat, B., Grimalt, J. O., Shackleton, N. J., de Abreu, L., Hutterli, M. A., and Stocker, T. F.: Four climate cycles of recurring deep and surface water destabilizations on the Iberian margin, Science, 317, 502-507, doi:10.1126/science.1139994, 2007.
10
Mayewski, P. A., Meeker, L. D., Twickler, M. S., Whitlow, S. I., Yang, Q., Lyons, W. B., and Prentice, M.: Major features and forcing of high latitude northern hemisphere atmospheric circulation over the last 110 000 years, J. Geophys. Res., 102, 26 345–26 366, 1997.
McManus, J. F., Bond, G. C., Broecker, W. S., Johnsen, S., Labeyrie, L. and Higgins, S.: High-resolution climate records from the North Atlantic during the last interglacial., Nature, 371,
15
326–329, 1994.
McManus, J. F., Francois, R., Gherardi, J.-M., Keigwin, L. D., and Brown-Leger, S.: Collapse and rapid resumption of Atlantic meridional circulation linked to deglacial climate changes, Nature, 428, 834–837, doi:10.1038/nature02494, 2004.
McManus, J. F., Oppo, D. W., and Cullen, J. L.: A 0.5-million-year record of
20
millennial-scale climate variability in the North Atlantic, Science, 283, 971–975, doi:10.1126/science.283.5404.971, 1999.
McManus, J. F., Oppo, D. W., and Cullen, J. L.: ODP 980 Isotope and IRD Data, IGBP PAGES/World Data Center A for Paleoclimatology, Data Contribution Series #2001-065, NOAA/NGDC Paleoclimatology Program, Boulder CO, USA, 2001.
25
McManus, J. F., Oppo, D. W., and Keigwin, L. D.: Thermohaline circulation and prolonged interglacial warmth in the North Atlantic, Quat. Res., 58, 17–21, 2002.
Naughton, F.: As variac¸ ˜oes clim ´aticas dos ´ultimos 30 000 anos e sua influ ˆencia na evoluc¸ ˜ao dos sistemas costeiros do norte de Portugal, PhD thesis, University of Lisbon, Portugal, 362 pp., 2007.
30
Naughton, F., Sanchez Goni, M. F., Desprat, S., Turon, J.-L., Duprat, J., Malaize, B., Joli, C., Cortijo, E., Drago, T., and Freitas, M. C.: Present-day and past (last 25 000 years) marine pollen signal off western Iberia, Mar. Micropaleontol., 62, 91–114, 2007.