HAL Id: insu-01334308
https://hal-insu.archives-ouvertes.fr/insu-01334308
Submitted on 21 Jun 2016
HAL is a multi-disciplinary open access
archive for the deposit and dissemination of sci-entific research documents, whether they are pub-lished or not. The documents may come from teaching and research institutions in France or abroad, or from public or private research centers.
L’archive ouverte pluridisciplinaire HAL, est destinée au dépôt et à la diffusion de documents scientifiques de niveau recherche, publiés ou non, émanant des établissements d’enseignement et de recherche français ou étrangers, des laboratoires publics ou privés.
A modeling approach of the relationship between nitrous
oxide fluxes from soils and the water-filled pore space
E. Rabot, Isabelle Cousin, C. Hénault
To cite this version:
E. Rabot, Isabelle Cousin, C. Hénault. A modeling approach of the relationship between nitrous oxide fluxes from soils and the water-filled pore space. Biogeochemistry, Springer Verlag, 2015, 122 (2-3), pp.395-408. �10.1007/s10533-014-0048-1�. �insu-01334308�
Version postprint
Version définitive du manuscrit publié dans / Final version of the manuscript published in : Biogeochemistry, 2015, http://dx.doi.org/10.1007/s10533-014-0048-1 Manu sc rit d’a uteu r / Author Man uscr ipt Manu sc rit d’a uteu r / A uthor Ma nuscr ipt Manu sc rit d’a uteu r / A uthor Ma nuscr
ipt
A modeling approach of the relationship between nitrous oxide
fluxes from soils and the water-filled pore space
E. Rabot, I. Cousin*, C. Hénault
INRA, UR0272, UR Science du Sol, F-45075 Orléans, France * Corresponding author: [email protected]
Abstract
Nitrous oxide (N2O) fluxes can increase significantly following small increases in soil
water-filled pore space (WFPS). Thus, it is essential to improve our knowledge of this crucial relationship to better model N2O emissions by soils. We studied how much the addition of a
gas transport and a gas-liquid equilibrium module to the model of N2O emissions NOE could
improve simulation results. A sensitivity analysis of the modified model (NOEGTE: Gas
Transport and Equilibrium) was first performed, and then the model was tested with published data of a wetting-drying experiment. Simulated N2O fluxes plotted against WFPS appeared to
be bell-shaped during the 7 days simulated, combining the effects of the low N2O production
for WFPS < 0.62, and the slow gas diffusion for WFPS > 0.95. The WFPS generating the maximum simulated N2O fluxes shifted with time, from 0.76 after 12 hours, to 0.79 after 168
hours, because of an increase over time of the gas concentration gradient between the soil surface and the atmosphere. NOEGTE appeared able to capture the pattern of N2O emissions
monitored in the experimental data. In particular, N2O peaks during drying were well
reproduced in terms of timing, but their magnitudes were often overestimated. They were attributed to the increasing gas diffusivity and N2O exchanges from the liquid phase to the
gaseous phase.
Keywords nitrous oxide emission modeling; water-filled pore space; gas diffusivity; soil
Introduction
Nitrous oxide (N2O) is the third largest gas contributing to global warming, as its global
warming potential is 300 times higher than that of carbon dioxide over a 100-year time scale (UNEP 2013). Soils under natural vegetation are estimated to account for 60% of natural N2O
Version postprint
Version définitive du manuscrit publié dans / Final version of the manuscript published in : Biogeochemistry, 2015, http://dx.doi.org/10.1007/s10533-014-0048-1 Manu sc rit d’a uteu r / Author Man uscr ipt Manu sc rit d’a uteu r / A uthor Ma nuscr ipt Manu sc rit d’a uteu r / A uthor Ma nuscr
ipt sources while agriculture accounts for 60% of anthropogenic sources (Ciais et al. 2013). Denitrification mainly occurs under anaerobic conditions. Thus, water in soil is known to be a key factor for controlling N2O emissions, because of its role as a barrier to oxygen transport
and availability for microorganisms. The water-filled pore space (WFPS) is defined as the proportion of soil pore space filled with water (Linn and Doran 1984). Nitrous oxide fluxes can increase significantly following small increases in WFPS. The high sensitivity of the N2O
fluxes to the WFPS can cause errors when modeling N2O emissions from soils (Grundmann
and Rolston 1987; Heinen 2006b), so it is essential that our knowledge of this crucial relationship is improved.
Soil water content is an input parameter always included in N2O emission models. In
empirical models, non-linear relationships are often used to link the WFPS to N2O emissions
(Heinen 2006b). When N2O fluxes are normalized from 0 to 1, this relationship – called the
FW function – is a reduction function used to modify the potential denitrification of soils
and/or the N2O/N2 ratio. It is combined with other reduction functions related to soil nitrate
content or soil temperature, which are used together to estimate N2O fluxes. For example, the
DenNit (Reth et al. 2005), ECOSSE (Smith et al. 2010), and NOE (Hénault et al. 2005) models used such functions. The FW function can be described as: a continuous exponential
curve starting at a WFPS value of 0.62 in the NOE and ECOSSE models, an arctangent function with a level off for WFPS > 0.7−0.9 in DAYCENT (Del Grosso et al. 2000), a sigmoid curve with half maximum N2O emissions at 60% of the field capacity in DenNit, or a
linear growing function starting at the drained upper limit in APSIM (Keating et al. 2003). A comparison of the FW functions used in denitrification models is given in Heinen (2006b).
Several experiments have been designed to build FW functions, with different levels of soil
disturbance and control on other variables. For example, experiments of Weier et al. (1993) on sieved and repacked soil samples of various textures were included in the NGAS model (Parton et al. 1996). This denitrification sub-module has subsequently been integrated into DAYCENT, with supplementary results of Del Grosso et al. (2000) on undisturbed soil cores. To derive appropriate FW equations, Del Grosso et al. (2000) eliminated data points subjected
to strong limitations due to other variables (e.g., nitrate content, temperature). To build the FW
function in the NOE model, Hénault et al. (2005) performed laboratory experiments where temperature and nitrate concentrations were favorable for N2O emissions. Results were closed
Version postprint
Version définitive du manuscrit publié dans / Final version of the manuscript published in : Biogeochemistry, 2015, http://dx.doi.org/10.1007/s10533-014-0048-1 Manu sc rit d’a uteu r / Author Man uscr ipt Manu sc rit d’a uteu r / A uthor Ma nuscr ipt Manu sc rit d’a uteu r / A uthor Ma nuscr
ipt Grundmann and Rolston (1987) was reused. For the DenNit model, results were derived by fitting the sigmoid function of Davidson (1991) on new field and laboratory experiments. Models often assume that N2O emissions change immediately when an environmental
variable does (Xing et al. 2011). This can lead to mismatches between the predicted fluxes and fluxes observed in the field, which themselves are highly variable over time, even at hourly scales. The purpose of this study was to improve NOE simulations by incorporating a gas transport and a gas-liquid equilibrium module to the original NOE model. The modified model (NOEGTE: Gas Transport and Equilibrium) was subjected to a sensitivity analysis to
observe its response to the WFPS parameter. Then the model was tested with experimental published data in order to check the relevance of the new version of NOE and to further discuss the N2O emission processes in response to varying WFPS.
Material and methods
Model description
Nitrous oxide production module
Nitrous oxide production was estimated by using the NOE model (Hénault et al. 2005), modified to be used in a 1-D configuration, i.e., to give an estimation on each vertical location within a soil horizon, instead of using an integrative value for the whole soil horizon. The NOE model was chosen because it requires few and accessible input data, and because it is frequently used in research studies (Heinen 2006a). The N2O flux produced by denitrification
(N2Odenit) is a combination of the potential denitrification (DP) and response functions to
several environmental factors (Hénault et al. 2005):
N2Odenit = DP.FW.FN.FT.rmax [1]
where FW is the denitrification response factor to soil WFPS (dimensionless), FN is the
denitrification response factor to soil nitrate content (dimensionless), FT is the denitrification
response factor to soil temperature (dimensionless), and rmax is the maximum ratio of N2O to
denitrified nitrate under anaerobic incubations. Techniques used to determine DP and rmax
experimentally are described in Hénault et al. (2005). FN and FT were taken from the original
NOE model (Hénault et al. 2005), where FN was built by Hénault and Germon (2000) from
laboratory experiments and FT was originally designed by Stanford et al. (1975). The FW
Version postprint
Version définitive du manuscrit publié dans / Final version of the manuscript published in : Biogeochemistry, 2015, http://dx.doi.org/10.1007/s10533-014-0048-1 Manu sc rit d’a uteu r / Author Man uscr ipt Manu sc rit d’a uteu r / A uthor Ma nuscr ipt Manu sc rit d’a uteu r / A uthor Ma nuscr
ipt 2000), and assumes that the WFPS parameter is a proxy of the oxygen availability for microorganisms. 74 . 1 W W 38 . 0 62 . 0 WFPS , 62 . 0 WFPS If 0 , 62 . 0 WFPS If F F [2]
We made the assumption that N2Odenit in conditions of high WFPS estimates the total N2O
production, which must then be partitioned between the gaseous and liquid phases. Nitrous oxide transport module
Transport by diffusion is the major process allowing gas movement within soils (Heincke and Kaupenjohann 1999; Yoh et al. 1997). It was modeled by using the 1-D diffusion equation of Fick (eq. [3]), solved by the finite difference method with a central difference scheme:
x C D x t C S [3]
where C is the N2O concentration (mol N2O m−3 gas), t is the time (s), DS is the gas diffusion
coefficient in soil (m3 gas m−1 soil s−1), and x is the vertical coordinate (m).
Fluxes inside a closed-chamber located above the soil horizon were also modeled because the closed-chamber technique, frequently used to measure N2O fluxes in the field, is known to
influence the N2O fluxes (Conen and Smith 2000; Venterea et al. 2009). Transport into the
chamber was modeled by the same Fick’s equation (eq. [3]), parameterized with D0, the gas
diffusion coefficient in free-air.
Four models, chosen for their wide use, were tested for the estimation of the Ds parameter (Table 1). Soil-type effects are introduced through the soil total porosity P, which is related to the soil structure. Moreover, in the M model, additional soil-type effects are taken into account by using the soil water retention curve. Two families of gas diffusion models were thus used as the M and D models have been developed with undisturbed soils to represent complex and multiscaled soil systems. On the contrary, the B and MQ models have been developed with a model porous medium, the B model being experimental whereas the MQ model is theoretical.
Version postprint
Version définitive du manuscrit publié dans / Final version of the manuscript published in : Biogeochemistry, 2015, http://dx.doi.org/10.1007/s10533-014-0048-1 Manu sc rit d’a uteu r / Author Man uscr ipt Manu sc rit d’a uteu r / A uthor Ma nuscr ipt Manu sc rit d’a uteu r / A uthor Ma nuscr
ipt Dissolved nitrous oxide
Because N2O is highly soluble in water (Heincke and Kaupenjohann 1999), we introduced a
gas-liquid equilibrium according to Henry’s law (eq. [4]): Hp
Caq [4]
where Caq is the N2O concentration in the aqueous phase (mol L−1), H is the Henry’s constant
of N2O in a given electrolyte solution at a given temperature (mol L−1 atm−1), and p is the
partial pressure of N2O in the gaseous phase (atm). The effect of the presence of ions in the
solution on the N2O solubility was taken into account with the Sechenov equation (Schumpe
1993), together with the temperature dependence of H. The gas-liquid equilibrium was applied only if the N2O concentration in the aqueous phase was lower than the saturation
concentration of N2O in water. The simulation allowed for any dissolved N2O lost with the
water outflow to be removed from the budget. Transport by diffusion in the aqueous phase is analogous to the transport in the gaseous phase and is also modeled with Fick’s law (eq. [3]), with the N2O diffusion coefficient in water being equal to 1.80 × 10⁻⁹ m2 s−1 (Weast and Astle
1979).
Model parameterization
The model was used in two types of simulations. Its sensitivity to WFPS was first tested by using randomly chosen values of WFPS and BD. Secondly, the model was applied to the experimental data set of Rabot et al. (2014), who highlighted N2O peaks during drying,
probably due to N2O entrapment during the wetting phase and fast release during the drying
phase. The hypotheses regarding the functioning of N2O emissions during the drying phase
were evaluated with our modeling approach. In the two cases, the modeling support was the same. Coding was done in FORTRAN 2003 within the INRA VSoil platform. The platform provides an easy way to use and couple numerical modules representing processes occurring in soils (Lafolie et al. 2014). Information about how to use and contribute to the platform can be found in the dedicated web site: http://www.inra.fr/sol_virtuel/.
The modeling domain
The soil horizon was represented as a 7-cm height 1-D space, with 8 discrete nodes. The closed-chamber was simulated with the same vertical spacing between simulation nodes as the soil horizon. Calculations were performed on each node with a time increment of 3 seconds and results were stored every 3600 seconds. No-flux boundary conditions were
Version postprint
Version définitive du manuscrit publié dans / Final version of the manuscript published in : Biogeochemistry, 2015, http://dx.doi.org/10.1007/s10533-014-0048-1 Manu sc rit d’a uteu r / Author Man uscr ipt Manu sc rit d’a uteu r / A uthor Ma nuscr ipt Manu sc rit d’a uteu r / A uthor Ma nuscr
ipt imposed at either the upper (i.e., top of the closed-chamber) or lower (i.e., bottom of the soil horizon) boundaries. Input parameters for NOEGTE were the volumetric water content, soil
total porosity, soil and air temperature, soil nitrate content, potential denitrification (DP), and
the ratio of N2O to denitrified nitrate (rmax). The values of all these parameters were assigned
to each node of the soil horizon. At time t = 0 hour, initial N2O concentration in the gaseous
phase, in both the soil and the chamber, was set to the atmospheric concentration (319 ppb), and the N2O concentration in the aqueous phase was initialized to be at equilibrium with the
atmospheric concentration of N2O at 20°C. Then, every 30 minutes, the N2O gas
concentration inside the chamber was set equal to 319 ppb, to simulate the regular chamber removal done before each N2O flux measurement in the study of Rabot et al. (2014).
Evaluating the model sensitivity to the water-filled pore space
To test the NOEGTE sensitivity to the WFPS parameter, we built a quasi-random data set
consisting of a combination of hydric conditions (WFPS in the range [0−1]) and bulk density (BD in the range [1.2−1.4], needed to estimate DS/D0; the BD values were typical for the
surface horizon of cultivated soils, and corresponded to P in the range [0.47−0.55]). These simulations are hereafter referred to as VARBD. To test the effect of BD on the simulation results, the model was also run for fixed BD values of 1.20, 1.30, and 1.40 g cm−3, and WFPS in the range [0−1]. This second test of the model sensitivity to the WFPS parameter is hereafter referred to as FIXEDBD simulations. We used a Sobol’ sequence in order to reduce the computational cost of the analysis, and generated thus 200 realizations from a uniform distribution. The values of the other parameters were fixed to be in agreement with the experimental data set of Rabot et al. (2014): DP = 15 g N ha−1 d−1, rmax = 0.9, FN = 1, and FT =
1. WFPS was a uniform value in the entire column and was set to be constant with time. The gas diffusivity was estimated with the MQ model. The total simulation time was 168 hours (7 days).
Evaluating hypotheses on nitrous oxide emission processes
We used experimental data presented in Rabot et al. (2014) to parameterize and evaluate hypotheses on the N2O emission processes. Briefly, in this study, 12 undisturbed soil cores
(15 cm inner diameter, 7 cm height) were subjected to two wetting-drying cycles. Nitrous oxide fluxes were measured by infrared correlation spectroscopy by using the closed-chamber method, soil matric potential was recorded by three tensiometers inserted at 3, 4, and 5 cm
Version postprint
Version définitive du manuscrit publié dans / Final version of the manuscript published in : Biogeochemistry, 2015, http://dx.doi.org/10.1007/s10533-014-0048-1 Manu sc rit d’a uteu r / Author Man uscr ipt Manu sc rit d’a uteu r / A uthor Ma nuscr ipt Manu sc rit d’a uteu r / A uthor Ma nuscr
ipt depth, and soil water content was recorded by a soil moisture probe installed vertically at the soil surface to record an integrated value of the soil moisture. The soil was first saturated for four days with a nitrate solution. The soil drying was then performed stepwise in a tension table, by applying a decreasing pressure head level once a day across the range 0 to −100 cm, beginning with a −7 cm pressure head step. Three treatments of soil drying were applied depending on the number of steps required to reach −100 cm pressure head, and are hereafter referred as the Fast, Medium, and Slow treatment.
For each sample, the volumetric water content data were first smoothed to remove noise, by using the functional data analysis package “fda” (Ramsay et al. 2013) built on R (R Development Core Team 2012). It was realized by using a B-spline basis system and a roughness penalty on the second derivative. The smoothing parameters were chosen by examining the quality of the resulting fit (Ramsay et al. 2009). Four gas diffusivity models were tested (Table 1). The Campbell pore size distribution index (b) used in the M model was determined by fitting the Campbell (1974) model to the soil water retention curve (eq. [5]), based on the measured soil water contents and soil matric potentials. The b parameter was estimated by curve fitting for the two wetting-drying cycles of each soil sample, to take into account the effect of the hysteresis in the soil water retention curve.
b 1 b s for b [5]
where θ is the soil water content (cm3
cm−3), θs is the saturated water content (cm3 cm−3), Ψ is
the soil matric potential (m), and Ψb is the air-entry potential (m).
For the N2O production module, we made the following assumptions: (1) N2O production
occurred over the whole horizon depth, because the 12 soil samples were extracted from surface horizon, where C and N are available for microorganisms (Jobbagy and Jackson 2001), (2) N2O was mainly produced by denitrification because water content was high
throughout the experiment (WFPS always > 0.6), and (3) because the experimental setup begins with a quick rewetting to saturation, the N2O production increased so much that the
initial N2O concentration in the soil appeared negligible in comparison. To focus on the effect
of the FW function on N2O emissions, the experiment of Rabot et al. (2014) was conducted
under laboratory conditions with the room temperature ranging between 20 and 21°C and the nitrate concentration of the wetting solution being equal to 200 mg N kg−1, thus giving FT = 1
Version postprint
Version définitive du manuscrit publié dans / Final version of the manuscript published in : Biogeochemistry, 2015, http://dx.doi.org/10.1007/s10533-014-0048-1 Manu sc rit d’a uteu r / Author Man uscr ipt Manu sc rit d’a uteu r / A uthor Ma nuscr ipt Manu sc rit d’a uteu r / A uthor Ma nuscr
ipt (10 cm inner diameter, 20 cm height) with a nitrate solution for 24 hours, then allowing the sample to drain freely for a further 24 hours, before measuring the N2O flux over a 3-hour
period (Hénault et al. 2005). The wetting phase was four times longer in the experiment of Rabot et al. (2014), but the nitrate concentration of the wetting solution and the soil temperature were the same as for the experiments enabling the estimation of the DP
parameter. We therefore approximated DP in the 12 soil samples by dividing the flux value at
the end of the −7 cm pressure head step by four. During this step, the pressure head was lowered to the bottom of the soil sample, allowing the macropores to drain for 24 hours. DP
was estimated for the two wetting-drying cycles. The rmax parameter was fixed to 0.9, because
at high nitrate availability, the N2O/N2 ratio is known to be high (Letey et al. 1980; Ruser et
al. 2006; Weier et al. 1993).
Data analyses
Cumulative N2O fluxes were calculated by linearly interpolating the N2O flux values that
were frequently recorded or simulated with time, and then integrating the area under the curve (Castellano et al. 2010; Dobbie et al. 1999). To compare the effect of the different DS/D0
estimations in the model, we used the root-mean-square error (RMSE):
n i i i O P n 1 2 1 RM SE [6]where Pi and Oi are predicted and observed values and n is the number of observations. The
mean error (ME) was used to evaluate over- or underestimations of the model:
n i i i O P n 1 1 M E [7]The effect of the hydric period or treatment on RMSE and ME were assessed by a Mann-Whitney U test or a Kruskal-Wallis test at the 5% level. Correlations were assessed by the calculation of Pearson correlation coefficients.
Results and discussion
Evaluating the model sensitivity to the water-filled pore space
Results of the VARBD simulations are given in Fig. 1. It shows the evolution of the N2O
Version postprint
Version définitive du manuscrit publié dans / Final version of the manuscript published in : Biogeochemistry, 2015, http://dx.doi.org/10.1007/s10533-014-0048-1 Manu sc rit d’a uteu r / Author Man uscr ipt Manu sc rit d’a uteu r / A uthor Ma nuscr ipt Manu sc rit d’a uteu r / A uthor Ma nuscr
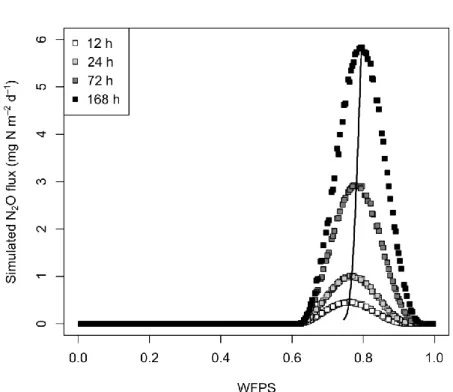
ipt for the overall simulation period, because the source term was set to zero by the N2O production module. For WFPS between 0.62 and ~0.95, fluxes increased to the end of the simulation period. The maximum N2O fluxes were reached at a WFPS of approximately 0.8.
Conversely, very low fluxes were simulated for WFPS > 0.95 because of the slow gas diffusion in the water-saturated soil. Considering only gas diffusion, at WFPS = 0.62, a N2O
molecule covers approximately 37 cm during the 7 days simulated, whereas at WFPS = 0.8 it covers 13 cm, and only 1.3 cm at WFPS = 0.95 (according to the MQ model, with BD = 1.30 g cm−3). Thus, the whole soil profile is expected to participate to the surface flux at WFPS = 0.8, where maximum fluxes were simulated. The three-dimensional representation of Fig. 1 is projected onto the plane formed by the N2O flux and WFPS axes in Fig. 2 for four simulation
times. Fluxes were bell-shaped during the 7 days simulated, combining the effects of the low N2O production for low WFPS, and the slow gas diffusion for the highest WFPS. This shape
was in agreement with other data collected in the field (e.g., Laville et al. 2011; Rafique et al. 2011; Schmidt et al. 2000) and laboratory experiments (e.g., Balaine et al. 2013; Castellano et al. 2010; Ciarlo et al. 2007). In these studies, maximum N2O fluxes occurred at a WFPS
ranging between 0.6 and 0.8, and the decrease in N2O fluxes at high WFPS was attributed
both to the slow gas diffusion and to a high reduction of N2O into N2 at high water content,
because the N2O-reductase is inhibited by oxygen (Ruser et al. 2006). In the N2O production
module used, the reduction of N2O into N2 is represented by a fixed value measured
experimentally, which integrates thus several soil parameters affecting the N2O/N2 ratio.
Some factors are known to modify the N2O/N2 ratio: the N2O-reductase is inhibited by
oxygen (Ruser et al. 2006), high nitrate contents (Weier et al. 1993), low pH (Knowles 1982), or high temperatures (Keeney et al. 1979). High carbon contents increase denitrification, so an increase in N2O fluxes has already been observed (e.g., Harrison-Kirk et al. 2013), or on the
contrary, a decrease of the N2O/N2 ratio (e.g., Khalil et al. 2002). Even if the reduction of N2O
into N2 has been demonstrated (Ciarlo et al. 2007; Letey et al. 1980; Weier et al. 1993), the
slow gas diffusion appeared to be enough to explain the decrease of N2O fluxes at high WFPS
in our simulations. However, a major improvement of the model would be to include the N2O
reduction as a function of the WFPS. It would lead to a shift of the simulated peak to lower WFPS. Moreover, some low N2O fluxes have already been measured in the field or in
laboratory experiments for WFPS < 0.62, and were attributed to denitrification occurring in anaerobic zones inside water saturated aggregates, or to nitrification (Bateman and Baggs 2005).
Version postprint
Version définitive du manuscrit publié dans / Final version of the manuscript published in : Biogeochemistry, 2015, http://dx.doi.org/10.1007/s10533-014-0048-1 Manu sc rit d’a uteu r / Author Man uscr ipt Manu sc rit d’a uteu r / A uthor Ma nuscr ipt Manu sc rit d’a uteu r / A uthor Ma nuscr
ipt In addition, the VARBD simulations showed a N2O flux increase with time at a given WFPS, when anoxic conditions were favorable. Indeed, as the N2O accumulated in the soil because of
the slow gas diffusion and a constant production, the gas concentration gradient between the soil surface and the chamber headspace increased with time, and the flux increased. This phenomenon led to the shift of the peak to higher WFPS with time: maximum N2O fluxes
occurred near WFPS = 0.76 after 12 hours and this value increased with time to reach WFPS = 0.79 after 168 hours (Fig. 2). Moreover, for high WFPS and for the latest times of simulation, N2O produced at deeper nodes diffused enough to contribute to emissions at the
soil surface. By highly increasing the simulation time, the transport length of N2O molecules
would increase and the right side of the bell would tend to disappear. Thus, the hydric history could explain the different WFPS values recorded in the literature for the maximum N2O
fluxes, in addition to other variables linked to N2O production or N2O/N2 ratio, such as
texture, structure or carbon and nitrogen contents. It is also noteworthy that that in published experimental data, the FW relationship was often noisy compared to laboratory experiments or
our modeling approach, because some other factors (e.g., nitrate content, temperature) were limiting (Laville et al. 2011). Using a boundary line method such as proposed by Schmidt et al. (2000) generally allows highlighting the bell-shaped relationship of field data.
In the FIXEDBD simulations, by comparing the WFPS corresponding to the maximum simulated N2O flux at different times (Table 2), we observed that the effect of BD was low
(difference in the WFPS of 0.007 after 168 hours between BD = 1.20 and 1.40 g cm−3), and that a soil with a high BD tended to produce the maximum N2O flux at lower WFPS
compared to a soil with low BD. This low effect of BD was also seen in the cumulative N2O
fluxes: they were in the same order of magnitude for the three BD, from 10.63 mg N m−2 d−1 at BD = 1.40 g cm−3, to 10.74 mg N m−2 d−1 at BD = 1.20 g cm−3. Dense soils are known to cause higher N2O fluxes than loose soils (e.g., Balaine et al. 2013; Beare et al. 2009; Hansen
et al. 1993; Ruser et al. 2006; Yamulki and Jarvis 2002). These high fluxes were often explained in field experiments by a reduction of the air-filled porosity (Hansen et al. 1993; Ruser et al. 2006). In our model, BD is a component of the gas diffusion coefficient calculation, and the amount of water involved in the gas-liquid equilibrium. Because there was a difference in the water content at a given WFPS between the three BD, contribution of the N2O dissolution in the liquid phase was different: the amount of N2O was higher in the
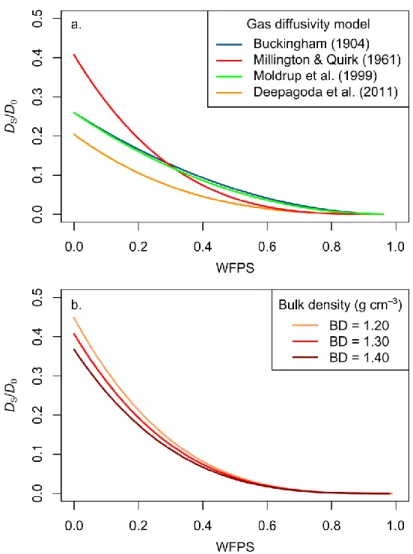
soil solution for the low BD. Moreover, the gas diffusivity estimated with the MQ model as function of the WFPS is a very flat curve at high WFPS (Fig. 3). Thus, in the range of WFPS
Version postprint
Version définitive du manuscrit publié dans / Final version of the manuscript published in : Biogeochemistry, 2015, http://dx.doi.org/10.1007/s10533-014-0048-1 Manu sc rit d’a uteu r / Author Man uscr ipt Manu sc rit d’a uteu r / A uthor Ma nuscr ipt Manu sc rit d’a uteu r / A uthor Ma nuscr
ipt which allows gas productivity, the sensitivity of the MQ model to BD is low. It resulted in very similar DS/D0 values for the three BD values.
Evaluating hypotheses on nitrous oxide emission processes
Comparison between measured and simulated nitrous oxide fluxes
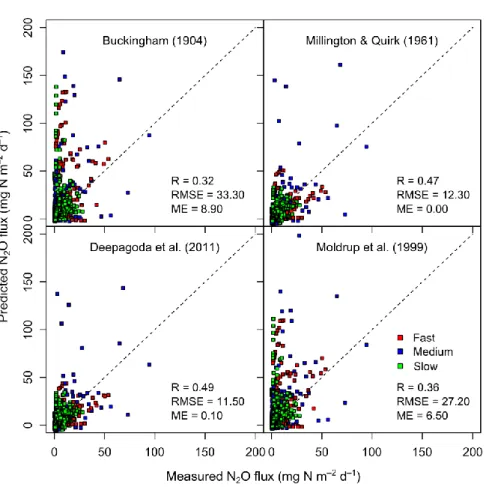
Measured and simulated cumulative N2O fluxes are presented in Fig. 4. Correlation
coefficients calculated for each gas diffusivity model were high, in the range 0.85 to 0.89, which demonstrates that the NOEGTE model provided satisfactory results for the cumulative
N2O fluxes regardless of which model was used to calculate DS/D0. However, for a given soil
sample, the simulated flux dynamics were still highly variable and depended on the gas diffusivity model used. Since estimation of the soil gas diffusivity is still a challenge, we integrated the four simulation results with the four gas diffusivity coefficients in the form of a 95% confidence interval for each sample. Measured and simulated flux dynamics are presented in Fig. 5. For the 12 soil samples, the measured and simulated fluxes were in the same order of magnitude. NOEGTE appeared able to capture the pattern of N2O emissions
monitored in the experiment of Rabot et al. (2014). The use of a diffusion transport module in addition to the NOE model allowed the transient N2O peaks during the drying phase to be
reproduced, but they were sometimes overestimated. Conversely, N2O dynamics were less
well modeled for the wetting phase: an increase in N2O fluxes was modeled at the beginning
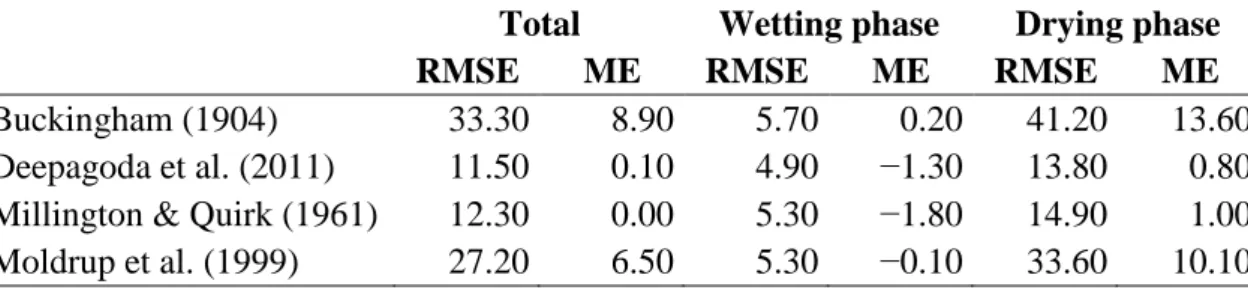
of the wetting phase, instead of a peak occurring 2 or 3 days after rewetting. Nevertheless, RMSE and ME were lower for the wetting phase than for the drying phase (p < 0.05; Table 3), because of the overestimated peaks during drying.
By comparing the N2O flux estimations from the four gas diffusivity models used (Fig. 6), we
observed that they were very similar between B and M models on the one hand, and between MQ and D models on the other hand. Indeed, in the range of WFPS of the experiment (WFPS > 0.6), the B and M models in the one hand, and the MQ and D models in the other hand give similar DS/D0 estimations, especially at high WFPS (Fig. 3). The B and M models tended to
overestimate N2O fluxes, whereas the MQ and D models were closer to experimental data
(Table 3). In particular, fluxes were generally underestimated during the wetting phase for the four models, and fluxes were overestimated for the B and M models and were generally better for the MQ and D models during the drying phase (Table 3). No trend in the ME or RMSE values was observed between the three treatments of decreasing pressure head (p > 0.05). The confidence interval was often modeled to be higher for the first wetting phase than for the
Version postprint
Version définitive du manuscrit publié dans / Final version of the manuscript published in : Biogeochemistry, 2015, http://dx.doi.org/10.1007/s10533-014-0048-1 Manu sc rit d’a uteu r / Author Man uscr ipt Manu sc rit d’a uteu r / A uthor Ma nuscr ipt Manu sc rit d’a uteu r / A uthor Ma nuscr
ipt second wetting phase (Fig. 5). For high WFPS, the DS/D0 was very similar for the four gas diffusivity models (Fig. 3). We attributed thus the lower variability in the simulation results during the second cycle to a lower N2O production during the second wetting cycle, linked to
the lower WFPS and lower DP.
Whereas we obtained very different results depending on the gas diffusivity model used, Böttcher et al. (2011) in their sensitivity analysis found few effects of DS/D0 on the simulated
N2O fluxes. The soils were well-aerated, contrary to the current experiment, with water
contents in the near-saturated range. Böttcher et al. (2011) recommended, however, the use of measured rather than estimated DS/D0. Using an efficient gas diffusivity model is essential as
Balaine et al. (2013) suggested that N2O emissions can be more efficiently predicted by DS/D0
than by the WFPS. Indeed, they concluded that the maximum N2O emissions occurred at a
DS/D0 of 0.006 and that this value was independent of the soil BD. For lower DS/D0, they
hypothesized that N2O was entrapped in the soil and that the reduction of N2O into N2 was
high. In our study, the DS/D0 allowing the maximum simulated N2O fluxes varied depending
on the simulated time, ranging from 0.002 to 0.004 (corresponding to the WFPS given in Table 2). Emissions may have been simulated to occur for DS/D0 < 0.006 because N2O
reduction into N2 was not encoded in the model as a function of the WFPS, but as a fixed
value. Other factors can influence the DS/D0 value where maximum fluxes are observed. The
study of Petersen et al. (2013) demonstrated that high soil carbon contents may increase the oxygen demand and lead to suboxic conditions, increasing thus the DS/D0 where N2O
emissions are observed. Our results support the observation of Balaine et al. (2013) that DS/D0
is an efficient parameter to predict N2O emissions, because at a given BD, it can be seen as a
proxy of the WFPS to trigger the N2O production, and because it controls the N2O transport
by combining information about the solid-induced tortuosity and the water-induced disconnectivity.
Description of the nitrous oxide emission processes
Rabot et al. (2014) observed in their laboratory experiment that N2O flux peaks could occur
during the wetting of a soil, as frequently observed in previous studies (e.g., Groffman and Tiedje 1988; Sanchez-Martin et al. 2010; Sexstone et al. 1985), but also during the drying phase, with a higher or similar intensity. Conversely, the N2O flux peak during drying has not
previously been documented, probably because of its brevity. The maximum N2O flux
Version postprint
Version définitive du manuscrit publié dans / Final version of the manuscript published in : Biogeochemistry, 2015, http://dx.doi.org/10.1007/s10533-014-0048-1 Manu sc rit d’a uteu r / Author Man uscr ipt Manu sc rit d’a uteu r / A uthor Ma nuscr ipt Manu sc rit d’a uteu r / A uthor Ma nuscr
ipt matric potential or water content. The flux decreased then drastically. To explain peaks during soil drying, Rabot et al. (2014) made the following hypothesis: N2O was produced and
entrapped during the wetting phase and was emitted both by rapid gas displacement from the gaseous phase and released from the soil solution during the soil drying. After applying our modeling approach, we were able to decompose the N2O flux dynamics during drying in two
parts: i) the rapid rise of the N2O flux can be attributed to the increasing DS/D0 due to the
increase of free-air porosity, and N2O exchanges from the liquid to the gaseous phase, ii) the
decline of the N2O flux occurring approximately 1.6 hours after the beginning of the soil
drying can be attributed to the removal of the N2O entrapped in the gaseous phase, the
removal from the budget by drainage of a part of the N2O entrapped in the soil solution, and
the declining water content and nitrate content leading to lower N2O production. The
remaining question about the origin of the N2O released during the drying phase, i.e., from the
gaseous or from the liquid phase, in the Rabot et al. (2014) experiment can also be answered by the model: the best simulation results were achieved by using both Fick’s and Henry’s laws, favoring the hypothesis that N2O was entrapped and released from the two phases. The
behavior of N2O in the aqueous phase, i.e., its high solubility and its possible transport out of
a soil system with the water flow is an important aspect to consider for the study of indirect N2O emissions.
Our analysis underscores the importance of transient dynamics in N2O fluxes and identifies
the need to use shorter time steps. A lot of models, e.g., APSIM (Thorburn et al. 2010), DAYCENT (Parton et al. 2001), DNDC (Deng et al. 2013), ECOSSE (Bell et al. 2012), were designed to be run at daily time steps. Although most of them succeeded in capturing cumulative N2O fluxes at monthly or seasonal time steps, they often failed to simulate
precisely the magnitude of N2O fluxes. Indeed, even if the main controlling factors were
understood, modeling emissions of a gas which is soluble and reacts to form other compounds with high temporal resolution is complex (Shcherbak and Robertson 2014). Estimating N2O
fluxes at hourly time steps thus remains a challenge. Like the previously cited models, the NOE model was initially developed to be run at daily time steps. Attempts to use NOE at hourly time steps have occurred (e.g., Bessou et al. 2010; Hergoualc’h et al. 2009; Metay et al. 2011) and by numerically re-building fine water content chronicles, they provided moderately good simulation results. Cannavo et al. (2006) combined NOE and simulated soil water content with gas transport equations. We assumed that introducing processes occurring at a fine temporal resolution, such as gas transport and gas-liquid equilibrium, would allow
Version postprint
Version définitive du manuscrit publié dans / Final version of the manuscript published in : Biogeochemistry, 2015, http://dx.doi.org/10.1007/s10533-014-0048-1 Manu sc rit d’a uteu r / Author Man uscr ipt Manu sc rit d’a uteu r / A uthor Ma nuscr ipt Manu sc rit d’a uteu r / A uthor Ma nuscr
ipt refining of NOE simulation results. In our case, a constant rise in N2O fluxes was modeled at the beginning of the wetting phase, instead of a peak occurring 2 or 3 days after rewetting. This phenomenon, highly pronounced in some of the experiments at the first wetting-drying cycle, may be linked to denitrifying microorganisms which adapted gradually to anaerobic conditions (Laville et al. 2011). Indeed, N2O emissions have already been observed to begin
quickly after rewetting whereas the N2O reduction into N2 has been observed to occur after 2
to 4 days of wetting (e.g., Letey 1980, Hansen et al. 2014). Errors in the flux estimation during the wetting phase propagated then to the end of the simulation period.
Conclusion
The modeling approach performed in this study was intended to refine the NOE model in order to demonstrate the role of the physical processes relating water and N2O emissions and
the importance of these in N2O modeling. A sensitivity analysis of the WFPS parameter was
performed using the new NOEGTE model. The results showed that simulated N2O fluxes
plotted against WFPS were bell-shaped during the 7 days simulated, combining the effects of the low N2O production for WFPS < 0.62, and the slow gas diffusion for WFPS > 0.95. It was
in agreement with previous studies based on data collected in field or laboratory experiments. The WFPS generating the maximum simulated N2O fluxes shifted with time because of an
increase over time of the gas concentration gradient between the soil surface and the atmosphere, and because the participation of the deeply produced N2O to the surface flux
increased with time. By increasing the simulation time, the right side of the bell would tend to disappear. The hydric history is thus an additional explanation of the different WFPS values recorded in the literature for the maximum N2O fluxes, in addition to other variables linked to
the N2O production or to the N2O/N2 ratio. Moreover, the model appeared able to capture the
pattern of N2O emissions monitored during wetting and drying experiments. Nitrous oxide
peaks observed during soil drying were indeed well reproduced in terms of timing, but their magnitudes were often overestimated. We were able to validate the hypothesis that the rapid rise of the N2O flux during soil drying was attributed to the increasing DS/D0, and N2O
exchanges from the liquid to the gaseous phase. The decline occurring a few hours later was attributed to a decrease of the N2O entrapped in the gaseous phase, the removal from the
budget by drainage of a part of the N2O entrapped in the soil solution, and the declining water
content and nitrate content leading to lower N2O production. The next improvement for N2O
Version postprint
Version définitive du manuscrit publié dans / Final version of the manuscript published in : Biogeochemistry, 2015, http://dx.doi.org/10.1007/s10533-014-0048-1 Manu sc rit d’a uteu r / Author Man uscr ipt Manu sc rit d’a uteu r / A uthor Ma nuscr ipt Manu sc rit d’a uteu r / A uthor Ma nuscr
ipt the soil by: i) taking into account N2O production and consumption by microorganisms as a function of time and soil moisture, and ii) considering that equilibrium between the gaseous and aqueous phases is probably not direct (Stolk et al. 2011).
Acknowledgements
We are grateful to F. Lafolie for his help with the VSoil Platform functioning. This work was supported by a Conseil Général du Loiret grant, and by the Labex VOLTAIRE (ANR-10-LABX-100-01).
References
Balaine N, Clough TJ, Beare MH, Thomas SM, Meenken ED, Ross JG (2013) Changes in relative gas diffusivity explain soil nitrous oxide flux dynamics. Soil Sci Soc Am J 77:1496-1505 doi:10.2136/sssaj2013.04.0141
Bateman EJ, Baggs EM (2005) Contributions of nitrification and denitrification to N2O
emissions from soils at different water-filled pore space. Biol Fertil Soils 41:379-388 doi:10.1007/s00374-005-0858-3
Beare MH, Gregorich EG, St-Georges P (2009) Compaction effects on CO2 and N2O
production during drying and rewetting of soil. Soil Biol Biochem 41:611-621 doi:10.1016/j.soilbio.2008.12.024
Bell MJ, Jones E, Smith J, Smith P, Yeluripati J, Augustin J, Juszczak R, Olejnik J, Sommer, M (2012) Simulation of soil nitrogen, nitrous oxide emissions and mitigation scenarios at 3 European cropland sites using the ECOSSE model. Nutr Cycl Agroecosyst 92:161-181 doi:10.1007/s10705-011-9479-4
Bessou C, Mary B, Léonard J, Roussel M, Gréhan E, Gabrielle B (2010) Modelling soil compaction impacts on nitrous oxide emissions in arable fields. Eur J Soil Sci 61:348-363 doi:10.1111/j.1365-2389.2010.01243.x
Böttcher J, Weymann D, Well R, von der Heide C, Schwen A, Flessa H, Duijnisveld WHM (2011) Emission of groundwater-derived nitrous oxide into the atmosphere: model simulations based on a 15N field experiment. Eur J Soil Sci 62:216-225 doi:10.1111/j.1365-2389.2010.01311.x
Version postprint
Version définitive du manuscrit publié dans / Final version of the manuscript published in : Biogeochemistry, 2015, http://dx.doi.org/10.1007/s10533-014-0048-1 Manu sc rit d’a uteu r / Author Man uscr ipt Manu sc rit d’a uteu r / A uthor Ma nuscr ipt Manu sc rit d’a uteu r / A uthor Ma nuscr
ipt Buckingham E (1904) Contributions to our knowledge to the aeration of soils. US Government Printing Office, Washington, DC
Campbell GS (1974) A simple method for determining unsaturated conductivity from moisture retention data. Soil Sci 117:311-314
Cannavo P, Lafolie F, Nicolardot B, Renault P (2006) Modeling seasonal variations in carbon dioxide and nitrous oxide in the vadose zone. Vadose Zone J 5:990-1004 doi:10.2136/vzj2005.0124
Castellano MJ, Schmidt JP, Kaye JP, Walker C, Graham CB, Lin H, Dell CJ (2010) Hydrological and biogeochemical controls on the timing and magnitude of nitrous oxide flux across an agricultural landscape. Glob Change Biol 16:2711-2720 doi:10.1111/j.1365-2486.2009.02116.x
Ciais P, Sabine C, Bala G, Bopp L, Brovkin V, Canadell J et al. (2013) Carbon and other biogeochemical cycles. In: Stocker TF et al. (eds) Climate change 2013: The physical science basis. Contribution of working group I to the fifth assessment report of the intergovernmental panel on climate change. Cambridge University Press, Cambridge, United Kingdom and New York, NY, USA, pp 465-570
Ciarlo E, Conti M, Bartoloni N, Rubio G (2007) The effect of moisture on nitrous oxide emissions from soil and the N2O/(N2O+N2) ratio under laboratory conditions. Biol
Fertil Soils 43:675-681 doi:10.1007/s00374-006-0147-9
Conen F, Smith KA (2000) An explanation of linear increases in gas concentration under closed chambers used to measure gas exchange between soil and the atmosphere. Eur J Soil Sci 51:111-117 doi:10.1046/j.1365-2389.2000.00292.x
Davidson EA (1991) Fluxes of nitrous oxide and nitric oxide from terrestrial ecosystems. In: Rogers JE, Whitman WB (eds) Microbial production and consumption of greenhouse gases: Methane, nitrogen oxides, and halomethanes. American Society for Microbiology, Washington, DC, pp 219-235
Deepagoda TKKC, Moldrup P, Schjønning P, de Jonge LW, Kawamoto K, Komatsu T (2011) Density-corrected models for gas diffusivity and air permeability in unsaturated soil. Vadose Zone J 10:226-238 doi:10.2136/vzj2009.0137
Version postprint
Version définitive du manuscrit publié dans / Final version of the manuscript published in : Biogeochemistry, 2015, http://dx.doi.org/10.1007/s10533-014-0048-1 Manu sc rit d’a uteu r / Author Man uscr ipt Manu sc rit d’a uteu r / A uthor Ma nuscr ipt Manu sc rit d’a uteu r / A uthor Ma nuscr
ipt Del Grosso SJ, Parton WJ, Mosier AR, Ojima DS, Kulmala AE, Phongpan S (2000) General model for N2O and N2 gas emissions from soils due to denitrification. Glob
Biogeochem Cycle 14:1045-1060 doi:10.1029/1999GB001225
Deng J, Zhou ZX, Zheng XH, Li CS (2013) Modeling impacts of fertilization alternatives on nitrous oxide and nitric oxide emissions from conventional vegetable fields in southeastern China. Atmos Environ 81:642-650 doi:10.1016/j.atmosenv.2013.09.046 Dobbie KE, McTaggart IP, Smith KA (1999) Nitrous oxide emissions from intensive
agricultural systems: Variations between crops and seasons, key driving variables, and mean emission factors. J Geophys Res-Atmos 104:26891-26899 doi:10.1029/1999jd900378
Groffman PM, Tiedje JM (1988) Denitrification hysteresis during wetting and drying cycles in soil. Soil Sci Soc Am J 52:1626-1629
Grundmann GL, Rolston DE (1987) A water function approximation to degree of anaerobiosis associated with denitrification. Soil Sci 144:437-441 doi:10.1097/00010694-198712000-00008
Hansen M, Clough TJ, Elberling B (2014) Flooding-induced N2O emission bursts controlled
by pH and nitrate in agricultural soils. Soil Biol Biochem 69:17-24 doi:http://dx.doi.org/10.1016/j.soilbio.2013.10.031
Hansen S, Mæhlum JE, Bakken LR (1993) N2O and CH4 fluxes in soil influenced by
fertilization and tractor traffic. Soil Biol Biochem 25:621-630 doi:http://dx.doi.org/10.1016/0038-0717(93)90202-M
Harrison-Kirk T, Beare MH, Meenken ED, Condron LM (2013) Soil organic matter and texture affect responses to dry/wet cycles: Effects on carbon dioxide and nitrous oxide
emissions. Soil Biol Biochem 57:43-55
doi:http://dx.doi.org/10.1016/j.soilbio.2012.10.008
Heincke M, Kaupenjohann M (1999) Effects of soil solution on the dynamics of N2O
emissions: A review. Nutr Cycl Agroecosyst 55:133-157 doi:10.1023/A:1009842011599
Heinen M (2006a) Application of a widely used denitrification model to Dutch data sets. Geoderma 133:464-473 doi:10.1016/j.geoderma.2005.08.011
Version postprint
Version définitive du manuscrit publié dans / Final version of the manuscript published in : Biogeochemistry, 2015, http://dx.doi.org/10.1007/s10533-014-0048-1 Manu sc rit d’a uteu r / Author Man uscr ipt Manu sc rit d’a uteu r / A uthor Ma nuscr ipt Manu sc rit d’a uteu r / A uthor Ma nuscr
ipt Heinen M (2006b) Simplified denitrification models: Overview and properties. Geoderma 133:444-463 doi:10.1016/j.geoderma.2005.06.010
Hénault C, Bizouard F, Laville P, Gabrielle B, Nicoullaud B, Germon JC, Cellier P (2005) Predicting in situ soil N2O emission using NOE algorithm and soil database. Glob
Change Biol 11:115-127 doi:10.1111/j.1365-2486.2004.00879.x
Hénault C, Germon JC (2000) NEMIS, a predictive model of denitrification on the field scale. Eur J Soil Sci 51:257-270 doi:10.1046/j.1365-2389.2000.00314.x
Hergoualc’h K, Harmand JM, Cannavo P, Skiba U, Oliver R, Hénault C (2009) The utility of process-based models for simulating N2O emissions from soils: A case study based on
Costa Rican coffee plantations. Soil Biol Biochem 41:2343-2355 doi:10.1016/j.soilbio.2009.08.023
Jobbagy EG, Jackson RB (2001) The distribution of soil nutrients with depth: Global patterns and the imprint of plants. Biogeochemistry 53:51-77 doi:10.1023/a:1010760720215 Khalil MI, Rosenani AB, Van Cleemput O, Boeckx P, Shamshuddin J, Fauziah CI (2002)
Nitrous oxide production from an ultisol of the humid tropics treated with different nitrogen sources and moisture regimes. Biol Fertil Soils 36:59-65 doi:10.1007/s00374-002-0505-1
Keating BA, Carberry PS, Hammer GL, Probert ME, Robertson MJ, Holzworth D et al. (2003) An overview of APSIM, a model designed for farming systems simulation. Eur J Agron 18:267-288 doi:10.1016/s1161-0301(02)00108-9
Keeney DR, Fillery IR, Marx GP (1979) Effect of temperature on the gaseous nitrogen products of denitrification in a silt loam soil. Soil Sci Soc Am J 43:1124-1128
Knowles R (1982) Denitrification. Microbiol Rev 46:43-70
Lafolie F, Moitrier Ni, Balesdent J, Bruckler L, Cousin I, Maron PA et al. (2014) The VSoil platform: A tool to integrate physico-bio-geo-chemical models in soils at the local scale. Environ Modell Softw Submitted
Laville P, Lehuger S, Loubet B, Chaumartin F, Cellier P (2011) Effect of management, climate and soil conditions on N2O and NO emissions from an arable crop rotation
using high temporal resolution measurements. Agric For Meteorol 151:228-240 doi:10.1016/j.agrformet.2010.10.008
Version postprint
Version définitive du manuscrit publié dans / Final version of the manuscript published in : Biogeochemistry, 2015, http://dx.doi.org/10.1007/s10533-014-0048-1 Manu sc rit d’a uteu r / Author Man uscr ipt Manu sc rit d’a uteu r / A uthor Ma nuscr ipt Manu sc rit d’a uteu r / A uthor Ma nuscr
ipt Letey J, Valoras N, Hadas A, Focht DD (1980) Effect of air-filled porosity, nitrate concentration, and time on the ratio of N2O/N2 evolution during denitrification. J
Environ Qual 9:227-231
Linn DM, Doran JW (1984) Effect of water-filled pore space on carbon dioxide and nitrous oxide production in tilled and nontilled soils. Soil Sci Soc Am J 48:1267-1272
Metay A, Chapuis-Lardy L, Findeling A, Oliver R, Moreira JAA, Feller C (2011) Simulating N2O fluxes from a Brazilian cropped soil with contrasted tillage practices. Agric
Ecosyst Environ 140:255-263 doi:10.1016/j.agee.2010.12.012
Millington RJ, Quirk JM (1961) Permeability of porous solids. Trans Faraday Soc 57:1200-1207
Moldrup P, Olesen T, Yamaguchi T, Schjønning P, Rolston DE (1999) Modeling diffusion and reaction in soils: IX. The Buckingham-Burdine-Campbell equation for gas diffusivity in undisturbed soil. Soil Sci 164:542-551 doi:10.1097/00010694-199908000-00002
Parton WJ, Mosier AR, Ojima DS, Valentine DW, Schimel DS, Weier K, Kulmala AE (2001) Generalized model for NOx and N2O emissions from soils. J Geophys Res-Atmos
106:17403-17419 doi:10.1029/2001jd900101
Parton WJ, Mosier AR, Ojima DS, Valentine DW, Schimel DS, Weier K, Kulmala AE (1996) Generalized model for N2 and N2O production from nitrification and denitrification.
Glob Biogeochem Cycle 10:401-412 doi:10.1029/96gb01455
Petersen SO, Ambus P, Elsgaard L, Schjønning P, Olesen JE (2013) Long-term effects of cropping system on N2O emission potential. Soil Biol Biochem 57:706-712
doi:http://dx.doi.org/10.1016/j.soilbio.2012.08.032
Pritchard DT, Currie JA (1982) Diffusion of coefficients of carbon dioxide, nitrous oxide, ethylene and ethane in air and their measurement. J Soil Sci 33:175-184
R Development Core Team (2012) R: A language and environment for statistical computing. R Foundation for Statistical Computing, Vienna, Austria, ISBN 3-900051-07-0, URL: http://www.R-project.org/
Rabot E, Hénault C, Cousin I (2014) Temporal variability of nitrous oxide emissions by soils as affected by hydric history. Soil Sci Soc Am J 78:434-444 doi:10.2136/sssaj2013.07.0311
Version postprint
Version définitive du manuscrit publié dans / Final version of the manuscript published in : Biogeochemistry, 2015, http://dx.doi.org/10.1007/s10533-014-0048-1 Manu sc rit d’a uteu r / Author Man uscr ipt Manu sc rit d’a uteu r / A uthor Ma nuscr ipt Manu sc rit d’a uteu r / A uthor Ma nuscr
ipt Rafique R, Hennessy D, Kiely G (2011) Nitrous oxide emission from grazed grassland under different management systems. Ecosystems 14:563-582 doi:10.1007/s10021-011-9434-x
Ramsay JO, Hooker G, Graves S (2009) Functional data analysis with R and MATLAB. Use R. Springer, New York
Ramsay JO, Wickham H, Graves S, Hooker G (2013) fda: Functional Data Analysis. R package version 2.4.0. http://CRAN.R-project.org/package=fda.
Reth S, Hentschel K, Drösler M, Falge E (2005) DenNit - Experimental analysis and modelling of soil N2O efflux in response on changes of soil water content, soil
temperature, soil pH, nutrient availability and the time after rain event. Plant Soil 272:349-363 doi:10.1007/s11104-004-5978-2
Ruser R, Flessa H, Russow R, Schmidt G, Buegger F, Munch JC (2006) Emission of N2O, N2
and CO2 from soil fertilized with nitrate: Effect of compaction, soil moisture and
rewetting. Soil Biol Biochem 38:263-274 doi:10.1016/j.soilbio.2005.05.005
Sanchez-Martin L, Sanz-Cobena A, Meijide A, Quemada M, Vallejo A (2010) The importance of the fallow period for N2O and CH4 fluxes and nitrate leaching in a
Mediterranean irrigated agroecosystem. Eur J Soil Sci 61:710-720 doi:10.1111/j.1365-2389.2010.01278.x
Schmidt U, Thöni H, Kaupenjohann M (2000) Using a boundary line approach to analyze N2O flux data from agricultural soils. Nutr Cycl Agroecosyst 57:119-129
doi:10.1023/a:1009854220769
Schumpe A (1993) The estimation of gas solubilities in salt solutions. Chem Engineer Sci 48:153-158 doi:http://dx.doi.org/10.1016/0009-2509(93)80291-W
Sexstone AJ, Parkin TB, Tiedje JM (1985) Temporal response of soil denitrification rates to rainfall and irrigation. Soil Sci Soc Am J 49:99-103
Shcherbak I, Robertson GP (2014) Determining the diffusivity of nitrous oxide in soil using in situ tracers. Soil Sci Soc Am J 78:79-88 doi:10.2136/sssaj2013.05.0181
Smith J, Gottschalk P, Bellarby J, Chapman S, Lilly A, Towers W et al. (2010) Estimating changes in Scottish soil carbon stocks using ECOSSE. I. Model description and uncertainties. Clim Res 45:179-192 doi:10.3354/cr00899
Version postprint
Version définitive du manuscrit publié dans / Final version of the manuscript published in : Biogeochemistry, 2015, http://dx.doi.org/10.1007/s10533-014-0048-1 Manu sc rit d’a uteu r / Author Man uscr ipt Manu sc rit d’a uteu r / A uthor Ma nuscr ipt Manu sc rit d’a uteu r / A uthor Ma nuscr
ipt Stanford G, Dzienia S, Vander Pol RA (1975) Effect of temperature on denitrification rate in soils. Soil Sci Soc Am J 39:867-870 doi:10.2136/sssaj1975.03615995003900050024x Stolk PC, Hendriks RFA, Jacobs CMJ, Moors EJ, Kabat P (2011) Modelling the effect of
aggregates on N2O emission from denitrification in an agricultural peat soil.
Biogeosciences 8:2649-2663 doi:10.5194/bg-8-2649-2011
Thorburn PJ, Biggs JS, Collins K, Probert ME (2010) Using the APSIM model to estimate nitrous oxide emissions from diverse Australian sugarcane production systems. Agric Ecosyst Environ 136:343-350 doi:10.1016/j.agee.2009.12.014
UNEP (2013) Drawing down N2O to protect climate and the ozone layer. A UNEP synthesis
report. United Nations Environment Programme (UNEP), Nairobi, Kenya
Venterea RT, Spokas KA, Baker JM (2009) Accuracy and precision analysis of chamber-based nitrous oxide gas flux estimates. Soil Sci Soc Am J 73:1087-1093 doi:10.2136/sssaj2008.0307
Weast RC, Astle MJ (1979) Handbook of chemistry and physics vol 60. CRC Press, Inc., Florida, USA
Weier KL, Doran JW, Power JF, Walters DT (1993) Denitrification and the dinitrogen/nitrous oxide ratio as affected by soil water, available carbon, and nitrate. Soil Sci Soc Am J 57:66-72
Xing HT, Wang EL, Smith CJ, Rolston D, Yu Q (2011) Modelling nitrous oxide and carbon dioxide emission from soil in an incubation experiment. Geoderma 167-168:328-339 doi:10.1016/j.geoderma.2011.07.003
Yamulki S, Jarvis SC (2002) Short-term effects of tillage and compaction on nitrous oxide, nitric oxide, nitrogen dioxide, methane and carbon dioxide fluxes from grassland. Biol Fertil Soils 36:224-231 doi:10.1007/s00374-002-0530-0
Yoh M, Toda H, Kanda K, Tsuruta H (1997) Diffusion analysis of N2O cycling in a fertilized
Version postprint
Version définitive du manuscrit publié dans / Final version of the manuscript published in : Biogeochemistry, 2015, http://dx.doi.org/10.1007/s10533-014-0048-1 Manu sc rit d’a uteu r / Author Man uscr ipt Manu sc rit d’a uteu r / A uthor Ma nuscr ipt Manu sc rit d’a uteu r / A uthor Ma nuscr ipt
Figures
Fig. 1 Simulated nitrous oxide flux with time for water-filled pore space in the range [0, 1]. At time = 0 hour,
initial conditions were applied. For the next time increments, the nitrous oxide production module, and the gas transport and equilibrium modules were activated
Version postprint
Version définitive du manuscrit publié dans / Final version of the manuscript published in : Biogeochemistry, 2015, http://dx.doi.org/10.1007/s10533-014-0048-1 Manu sc rit d’a uteu r / Author Man uscr ipt Manu sc rit d’a uteu r / A uthor Ma nuscr ipt Manu sc rit d’a uteu r / A uthor Ma nuscr ipt
Fig. 2 Simulated N2O fluxes after 12, 24, 72, and 168 hours as function of the water-filled pore space. The black
Version postprint
Version définitive du manuscrit publié dans / Final version of the manuscript published in : Biogeochemistry, 2015, http://dx.doi.org/10.1007/s10533-014-0048-1 Manu sc rit d’a uteu r / Author Man uscr ipt Manu sc rit d’a uteu r / A uthor Ma nuscr ipt Manu sc rit d’a uteu r / A uthor Ma nuscr ipt
Fig. 3 Comparison of the relative gas diffusivities (DS/D0) estimated with (a) four different gas diffusion models
and a bulk density of 1.30 g cm–3, and (b) the Millington and Quirk (1961) model for three different bulk densities
Version postprint
Version définitive du manuscrit publié dans / Final version of the manuscript published in : Biogeochemistry, 2015, http://dx.doi.org/10.1007/s10533-014-0048-1 Manu sc rit d’a uteu r / Author Man uscr ipt Manu sc rit d’a uteu r / A uthor Ma nuscr ipt Manu sc rit d’a uteu r / A uthor Ma nuscr ipt
Fig. 4 Comparison of cumulative measured and predicted N2O fluxes for the four models of gas diffusivity
Version postprint
Version définitive du manuscrit publié dans / Final version of the manuscript published in : Biogeochemistry, 2015, http://dx.doi.org/10.1007/s10533-014-0048-1 Manu sc rit d’a uteu r / Author Man uscr ipt Manu sc rit d’a uteu r / A uthor Ma nuscr ipt Manu sc rit d’a uteu r / A uthor Ma nuscr ipt
Fig. 5 Measured (black squares) and 95% confidence interval of simulated N2O fluxes (grey areas). Sample
names refer to the number of decreasing pressure heads applied during one wetting-drying cycle (Fast: 3 values, Medium: 4 values, Slow: 6 values, BD: bulk density in g cm−3). Yellow areas represent the drying phases, and white areas the wetting phases
Version postprint
Version définitive du manuscrit publié dans / Final version of the manuscript published in : Biogeochemistry, 2015, http://dx.doi.org/10.1007/s10533-014-0048-1 Manu sc rit d’a uteu r / Author Man uscr ipt Manu sc rit d’a uteu r / A uthor Ma nuscr ipt Manu sc rit d’a uteu r / A uthor Ma nuscr ipt
Fig. 6 Comparison of measured and predicted N2O fluxes for the four models of gas diffusivity tested (Fast: 3
Version postprint
Version définitive du manuscrit publié dans / Final version of the manuscript published in : Biogeochemistry, 2015, http://dx.doi.org/10.1007/s10533-014-0048-1 Manu sc rit d’a uteu r / Author Man uscr ipt Manu sc rit d’a uteu r / A uthor Ma nuscr ipt Manu sc rit d’a uteu r / A uthor Ma nuscr ipt
Tables
Table 1 Models of soil gas diffusivity used in the study
Abbreviation Model Formulaa
B Buckingham (1904) model
20
s P1WFPS
D D
MQ Millington and Quirk (1961) model
2 3 10 0 s 1 WFPS P P D D M Buckingham-Burdine-Campbellmodel of Moldrup et al. (1999)
b P D D 2 2 3 0 s 1WFPS D Generalized density-correctedmodel of Deepagoda et al. (2011) 0.1
2
1 WFPS
0.04
1 WFPS
3 0 s D D a
D0 is the gas diffusion coefficient in free air (D0 = 1.42 × 10⁻⁵ m2 s−1 at 20°C and 1 atm,
Pritchard and Curie (1982)), WFPS is the water-filled pore space, P is the soil total porosity (cm3 cm−3), and b is the Campbell pore size distribution index
Table 2 Water-filled pore space corresponding to the maximum simulated nitrous oxide flux, after 12, 24, 72,
and 168 hours, for three bulk densities (BD)
BD 12 h 24 h 72 h 168 h
1.20 0.762 0.770 0.783 0.798 1.30 0.760 0.767 0.780 0.794 1.40 0.757 0.764 0.777 0.791
Table 3 Root-mean-square error (RMSE) and mean error (ME) of the predicted nitrous oxide fluxes, depending
on the soil gas diffusivity model used
Total Wetting phase Drying phase RMSE ME RMSE ME RMSE ME
Buckingham (1904) 33.30 8.90 5.70 0.20 41.20 13.60 Deepagoda et al. (2011) 11.50 0.10 4.90 −1.30 13.80 0.80 Millington & Quirk (1961) 12.30 0.00 5.30 −1.80 14.90 1.00 Moldrup et al. (1999) 27.20 6.50 5.30 −0.10 33.60 10.10
![Fig. 1 Simulated nitrous oxide flux with time for water-filled pore space in the range [0, 1]](https://thumb-eu.123doks.com/thumbv2/123doknet/14792752.602146/23.892.160.735.327.770/fig-simulated-nitrous-oxide-water-filled-space-range.webp)