HAL Id: hal-00298836
https://hal.archives-ouvertes.fr/hal-00298836
Submitted on 31 May 2007HAL is a multi-disciplinary open access
archive for the deposit and dissemination of sci-entific research documents, whether they are pub-lished or not. The documents may come from teaching and research institutions in France or abroad, or from public or private research centers.
L’archive ouverte pluridisciplinaire HAL, est destinée au dépôt et à la diffusion de documents scientifiques de niveau recherche, publiés ou non, émanant des établissements d’enseignement et de recherche français ou étrangers, des laboratoires publics ou privés.
A conceptual model of flow to the Waikoropupu Springs,
NW Nelson, New Zealand, based on hydrometric and
tracer (18O, Cl,3H and CFC) evidence
M. K. Stewart, J. T. Thomas
To cite this version:
M. K. Stewart, J. T. Thomas. A conceptual model of flow to the Waikoropupu Springs, NW Nelson, New Zealand, based on hydrometric and tracer (18O, Cl,3H and CFC) evidence. Hydrology and Earth System Sciences Discussions, European Geosciences Union, 2007, 4 (3), pp.1215-1264. �hal-00298836�
HESSD
4, 1215–1264, 2007Conceptual flow model for karst
springs M. K. Stewart and J. T. Thomas Title Page Abstract Introduction Conclusions References Tables Figures ◭ ◮ ◭ ◮ Back Close
Full Screen / Esc
Printer-friendly Version Interactive Discussion
Hydrol. Earth Syst. Sci. Discuss., 4, 1215–1264, 2007 www.hydrol-earth-syst-sci-discuss.net/4/1215/2007/ © Author(s) 2007. This work is licensed
under a Creative Commons License.
Hydrology and Earth System Sciences Discussions
Papers published in Hydrology and Earth System Sciences Discussions are under open-access review for the journal Hydrology and Earth System Sciences
A conceptual model of flow to the
Waikoropupu Springs, NW Nelson, New
Zealand, based on hydrometric and tracer
(
18
O, Cl,
3
H and CFC) evidence
M. K. Stewart1,*and J. T. Thomas2 1
GNS Science, Lower Hutt, New Zealand
2
Tasman District Council, Richmond, New Zealand
*
now at: Aquifer Dynamics Ltd, Lower Hutt, New Zealand
Received: 27 April 2007 – Accepted: 13 May 2007 – Published: 31 May 2007 Correspondence to: M. K. Stewart (mk.stewart@gns.cri.nz)
HESSD
4, 1215–1264, 2007Conceptual flow model for karst
springs M. K. Stewart and J. T. Thomas Title Page Abstract Introduction Conclusions References Tables Figures ◭ ◮ ◭ ◮ Back Close
Full Screen / Esc
Printer-friendly Version Interactive Discussion
Abstract
The Waikoropupu Springs, a large karst resurgence 4 km from the coast, are supplied by the Arthur Marble Aquifer (AMA) underlying the Takaka Valley, South Island, New Zealand. New evidence on the recharge sources in the catchment, combined with previous results, is used to establish a new recharge model for the AMA. Combined
5
with the oxygen-18 mass balance, this yields a quantitative description of the inputs and outputs to the aquifer. It shows that the Main Spring is sourced mainly from the karst uplands (74%), with smaller contributions from the Upper Takaka River (18%) and valley rainfall (8%), while Fish Creek Spring contains mostly Upper Takaka River water (50%). In addition, much of the Upper Takaka River contribution to the aquifer (58%)
10
bypasses the springs and is discharged offshore via submarine springs. The chemical concentrations of the Main Spring show input of 0.5% of sea water on average, which varies with flow and derives from the deep aquifer. Tritium measurements spanning 40 years, and CFC-11 measurements, give a mean residence time of 8 years for the Main Spring water using the preferred two-component model. Our conceptual flow
15
model, based on the flow, chloride, oxygen-18 and age measurements, invokes two different flow systems with different recharge sources to explain the flow within the AMA. One system contains deeply penetrating old water with mean age 10.2 years and water volume 3 km3, recharged from the karst uplands. The other, at shallow levels below the valley floor, has much younger water, with mean age 1.2 years and
20
water volume 0.4 km3, recharged by Upper Takaka River and valley rainfall. The flow systems contribute in different proportions to the Main Spring, Fish Creek Springs and offshore springs. Their very different behaviours, despite being in the same aquifer, are attributed to the presence of a diorite intrusive below the surface of the lower valley, which diverts the deep flow towards the Waikoropupu Springs and allows much of the
25
shallow flow to pass over the intrusive and escape via submarine springs.
HESSD
4, 1215–1264, 2007Conceptual flow model for karst
springs M. K. Stewart and J. T. Thomas Title Page Abstract Introduction Conclusions References Tables Figures ◭ ◮ ◭ ◮ Back Close
Full Screen / Esc
Printer-friendly Version Interactive Discussion
1 Introduction
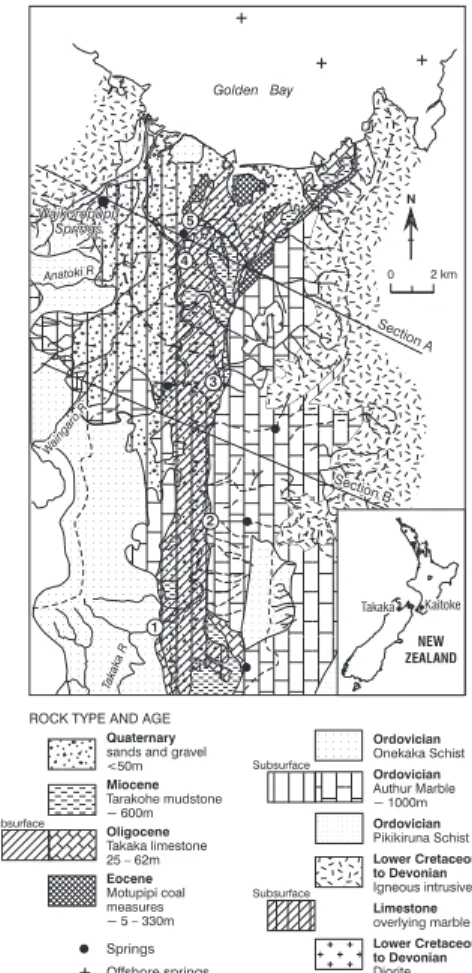
The Arthur Marble Aquifer (AMA) underlies the Takaka Valley on the South Island of New Zealand (Figs. 1, 2), and supplies the Waikoropupu Springs comprising the Main Spring, Dancing Sands Spring and Fish Creek Springs (Fig. 3). Waikoropupu Springs are locally known as Pupu Springs and both terms are used in this paper for the
collec-5
tive discharges. The springs are New Zealand’s largest and an impressive sight; their average flow is 13 300 l/s. They are karstic, tidal and slightly brackish. The springs emerge from Arthur Marble through a cover of Motupipi Coal Measures approximately 4 km south of Golden Bay and 14–17 m above sea level. The source of the water has been at issue since the end of the last century (Park, 1890).
10
The mystique of the springs has to do with their size, clarity and attractive setting, but the springs have many interesting features. Their sheer size suggests that they are drawn from a diversity of sources over a wide area in company with large karstic springs elsewhere in the world (Ford and Williams 1989; Williams, 2004). The Pupu Springs are the main discharge zone of the AMA. Arthur Marble also outcrops east
15
and west of the lower valley, and in the upper headwaters of the Waitui Stream (Fig. 2). Several investigations in the late 1970s established physical, hydrological, and chem-ical features of the springs (Michaelis, 1976; Williams, 1977; Stewart and Williams, 1981; Stewart and Downes, 1981). Further work has been reported in the 1980s and 1990s (Mueller, 1987, 1992; Edgar, 1998; Thomas, 2000; Taylor, 2001).
20
The Pupu Springs lie on the western side of the Takaka Valley (Fig. 1). Williams (1977) demonstrated hydraulic connection between Takaka River water sinking into its bed 16–18 km inland of the springs and the springs themselves by pulse-train analy-sis, using pulses in the Takaka River flow caused by releases from the upstream Cobb Reservoir. He also discussed the location of the springs and the nature of the
subter-25
ranean system.
This paper brings together new and existing evidence to improve our understanding of flow in the AMA, and in particular the sources of the Waikoropupu Springs.
HESSD
4, 1215–1264, 2007Conceptual flow model for karst
springs M. K. Stewart and J. T. Thomas Title Page Abstract Introduction Conclusions References Tables Figures ◭ ◮ ◭ ◮ Back Close
Full Screen / Esc
Printer-friendly Version Interactive Discussion
metric information on the sources of recharge is critically evaluated and combined with the oxygen-18 mass balance to produce a quantitative recharge/discharge flow model for the AMA. Chloride concentrations of the Main Spring combined with oxygen-18 val-ues point to a two-component flow system. Tritium, CFC and oxygen-18 measurements are used to determine water residence times. Because the tritium measurements on
5
the Main Spring almost cover the rise and fall of tritium in the atmosphere due to nuclear weapons testing in the 1950s and 1960s, they are particularly reliable for determining the mean residence time and the shape of the age distribution.
The various types of evidence are put together to support a conceptual model of flow in the AMA involving two apparently almost independent flow systems. These
10
combine in different proportions to produce the various outflows of the Pupu Springs, and offshore springs.
2 Hydrogeological setting
The Takaka River has a catchment area of 928 km2, and includes subcatchments of the Waingaro, Anatoki, Waikoropupu Rivers on the west (Fig. 1). Precipitation ranges
15
from 1900–5000 mm/yr between the lowest and highest altitudes. The Anatoki ment (5000 mm/yr) receives more precipitation per unit area than the Waingaro catch-ment (3200 mm/yr), which in turn receives more than the Upper Takaka catchcatch-ment (2700 mm/yr). The decrease in precipitation from west to east is due to the westerly-dominated weather systems, which shed more rainfall on the first mountain ranges
20
they encounter. Mountain range and peak altitudes are about the same in all three sub-catchments.
There are three main water-bearing geological units in the area; 1) the Arthur Marble Aquifer, 2) the Takaka Limestone Aquifer, and 3) the Takaka Valley Unconfined Gravel Aquifer. The hydrologic characteristics of these aquifers are directly related to the
25
lithology/geology of the aquifers.
HESSD
4, 1215–1264, 2007Conceptual flow model for karst
springs M. K. Stewart and J. T. Thomas Title Page Abstract Introduction Conclusions References Tables Figures ◭ ◮ ◭ ◮ Back Close
Full Screen / Esc
Printer-friendly Version Interactive Discussion
2.1 Arthur Marble Aquifer
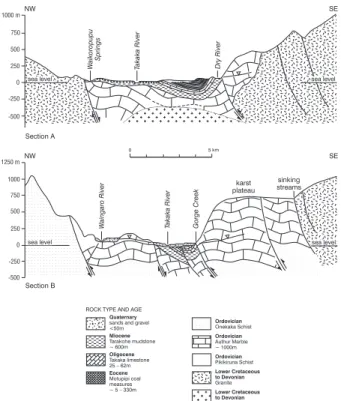
The Arthur Marble Aquifer is the principal karstic aquifer in the Takaka Valley area, and is an aquifer in Ordovician Arthur Marble. Arthur Marble is found underneath the Takaka Valley floor, from Upper Takaka to the Golden Bay coast, and in the mountain ranges parallel to this valley section (Fig. 1). Figure 2 shows northwest-southeast
5
cross-sections (Sections A and B). Marble covers an area of about 180 km2 in the Central and Lower Takaka subcatchments.
Under the Central Takaka Valley floor the marble is covered by tens of metres of alluvial gravel (45 km2) and in the Lower Takaka catchment it is additionally covered by Tertiary formations (45 km2) composed of Motupipi Coal Measures, Takaka Limestone
10
and Tarakohe Mudstone.
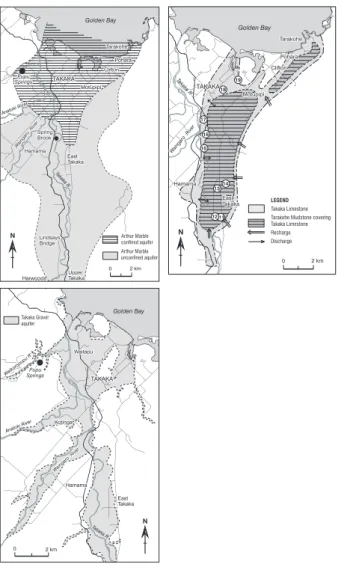
The Arthur Marble Aquifer is unconfined from Upper Takaka to about Hamama (Fig. 4a). In the unconfined area, Arthur Marble is overlain by cavernous Takaka Lime-stone and/or permeable alluvial gravels. The aquifer surface is defined by the water table, and the lithological boundary between marble and limestone has no
distinguish-15
able influence on groundwater flows. North of Hamama, impervious Motupipi Coal Measures overlie the Arthur Marble and the aquifer surface is defined by the elevation of the base of the Motupipi Coal Measures (Fig. 4a).
The thickness of the marble is up to 1000 m. Dissolution of the marble has caused the formation of a significant surface karstic landscape, with features such as karren,
20
dolines, swallow holes, a strong serrated relief, and a significant subterranean aquifer system. The depth of karstification below the valley is unknown, but given sea level change (to −130 m at the height of the last glaciation 17 000 yr ago) karstification to 1–200 m depth at least would be expected (Ford and Williams, 1989; Fleury et al., 2007).
25
HESSD
4, 1215–1264, 2007Conceptual flow model for karst
springs M. K. Stewart and J. T. Thomas Title Page Abstract Introduction Conclusions References Tables Figures ◭ ◮ ◭ ◮ Back Close
Full Screen / Esc
Printer-friendly Version Interactive Discussion
2.2 Takaka Limestone Aquifer
The Takaka Limestone Aquifer occurs between East Takaka and Tarakohe (Fig. 4b) and is a result of karstification processes on Oligocene Limestone. In the northern half of the Valley (north of Hamama and East Takaka), the Takaka Limestone Aquifer is underlain by the Motupipi Coal Measures, which act as an aquiclude. The aquiclude is
5
absent south of Hamama and East Takaka, and the Arthur Marble and Takaka Lime-stone aquifers are indistinguishable. Takaka LimeLime-stone is gently folded into a series of low amplitude synclines and anticlines. Only small amounts of groundwater are abstracted from this aquifer and the aquifer thickness varies between 30 and 60 m.
Recharge to the aquifer is from rainfall, seepage from creeks draining the eastern
10
boundary and inflow from the Upper Takaka River. 2.3 Takaka Valley unconfined gravel Aquifer
Quaternary gravel and sand deposits cover most of the Takaka Valley from Upper Takaka to the sea (Fig. 4c). The major water-bearing gravels are the ones underly-ing the lowest river terraces of the Takaka Valley and Takaka Township. The thickness
15
of the gravels varies down the valley. Around Lindsay’s Bridge the gravels are about 10 m thick, whilst recent drilling upstream of East Takaka revealed a gravel thickness of 57 m. The gravel is generally between 5–12 m thick in East Takaka. In the central part of Takaka Township, the gravels are estimated to be 30–40 m thick.
3 Sampling and methods
20
3.1 Chemical data
Water samples from rivers, springs, and groundwater wells have been collected by Tasman District Council hydrologists over a number of years. Groundwater wells were purged of at least three casing volumes before samples were taken, following methods
HESSD
4, 1215–1264, 2007Conceptual flow model for karst
springs M. K. Stewart and J. T. Thomas Title Page Abstract Introduction Conclusions References Tables Figures ◭ ◮ ◭ ◮ Back Close
Full Screen / Esc
Printer-friendly Version Interactive Discussion
outlined in Rosen et al. (1999). Samples for cation analyses were field filtered and acidified with high-purity nitric acid. Anion samples were field filtered and kept below 4◦C until analysed and bicarbonate samples were collected unfiltered, kept below 4◦C, and analysed within 48 h of collection. Analytical methods have changed for some pa-rameters, but in general the same methods have been used for each collection period.
5
Methods for cation analyses include Atomic Adsorption and ICP-OES, and for anion analyses include auto titrator, auto analyser, and ion chromatography.
3.2 Isotopic data
Groundwater bores were purged of at least three casing volumes before samples were taken. Bottles were flushed with the water to be sampled, emptied, refilled with water
10
and allowed to overflow. Care was taken to seal the bottles tightly to prevent evapora-tion. Samples of water were collected in 28 mL glass bottles for18O, and 1.1 L bottles for tritium.
For18O measurement, 2 mL of the water is isotopically equilibrated with CO2gas at
29◦C for two hours, and then the CO2is analysed in a stable isotope mass spectrometer 15
(Hulston et al., 1981). Oxygen-18 concentrations are expressed asδ18O values, where δ18O in ‰=[(18O/16O)sample/(18O/16O)VSMOW−1] × 1000 (1)
and VSMOW (Vienna standard mean ocean water) is the standard water. The mea-surement error is ±0.1‰ (standard error based on analysis of duplicate samples). Oxygen-18 concentrations in water are not affected by interaction with rock at ambient
20
temperature, and therefore are ideal for identifying recharge sources provided there is sufficient contrast in the oxygen-18 concentrations of the possible source waters.
For tritium measurement, samples are distilled, enriched in tritium by a factor of 70 by electrolysis and then counted in a Quantalus low background liquid scintillation counter for several weeks (Taylor, 1994: Morgenstern and Taylor, 2005). Measurement
25
precision was greatly improved in the 1980s and 1990s by methods which have been extensively documented (Taylor, 1994; IAEA, 1995; Morgenstern and Taylor, 2005).
HESSD
4, 1215–1264, 2007Conceptual flow model for karst
springs M. K. Stewart and J. T. Thomas Title Page Abstract Introduction Conclusions References Tables Figures ◭ ◮ ◭ ◮ Back Close
Full Screen / Esc
Printer-friendly Version Interactive Discussion
Measurement errors (1σ) on samples at the current ambient tritium level are ±2.8% (about ±0.04 TU).
3.3 Chlorofluorocarbons
Water samples for CFC concentration measurements were collected in such a way as to prevent contact of the sample with the atmosphere or with plastic materials, either
5
of which could contaminate the water with excess CFCs. The samples were preserved in the field by sealing them into 62 mL borosilicate glass ampoules at the spring or bore site, using methods developed by Busenberg and Plummer (1992) and taught to Vanessa Fox (GNS Science), when she visited the USGS at Reston, VA, USA. Where possible, the sampling apparatus was connected to the bore outlet by copper tubing. All
10
other tubing in contact with the water during sampling was stainless steel. The ampoule was attached to the sampling apparatus and flushed with ultra-high-purity nitrogen gas. The well water was then allowed to flow through the tubing and valves and into the bottom of the ampoule, displacing the nitrogen. The ampoule was rinsed with several hundred millilitres of water, then nitrogen was forced into the neck to displace some of
15
the water. The ampoule was then fused shut about 1–2 cm above the water level with an oxy/acetylene gas torch. Nitrogen flowed continually across the union to prevent any air contamination. Four ampoules were normally collected at each sampling site. The CFC samples were analysed by gas chromatography using an ECD detector. 3.4 Residence time determination
20
The different flow paths of water through the groundwater system means that outflows contain water with a variety of residence times. This distribution of ages is described by a conceptual flow or mixing model, which reflects the average conditions of flow in the system.
Rainfall incident on a catchment can be affected by surface/near surface runoff and
25
evapotranspiration losses. The remainder constitutes recharge to the subsurface wa-1222
HESSD
4, 1215–1264, 2007Conceptual flow model for karst
springs M. K. Stewart and J. T. Thomas Title Page Abstract Introduction Conclusions References Tables Figures ◭ ◮ ◭ ◮ Back Close
Full Screen / Esc
Printer-friendly Version Interactive Discussion
ter stores; the effects of the recharge processes are considered below. The tracer inputs (tritium and CFC concentrations, temporal18O variations in the recharge water) are modified by passing through the hydrological system (as represented by the flow model) before appearing in the output. The convolution integral and an appropriate flow model are used to relate the tracer input and output. The convolution integral is
5 given by Cout(t) = ∞ Z 0 Cin(t − τ)h(τ) exp(−λτ)d τ (2)
whereCinandCoutare the input and output concentrations in the recharge and outflow
respectively.t is calendar time and the integration is carried out over the transit times τ. h(τ) is the flow model or response function of the hydrological system. The exponential
10
term accounts for radioactive decay of tritium (λ is the tritium decay constant (=ln2/T1/2, where T1/2is the half-life of tritium (12.32 years)).
Two flow models are commonly used in tracer studies. The exponential-piston flow model (EPM) combines a volume with exponential transit times followed by a piston flow volume to give a model with two parameters (Maloszewski and Zuber, 1982). The
15
response function is given by
h(τ) = 0 for τ < τm(1 −f ) (3a)
h(τ) = (f τm)−1. exp[−(τ/f τm) + (1/f ) − 1] for τ ≥ τm(1 −f ) (3b)
whereτm is the mean residence time, and f the ratio of the exponential volume to the
total volume (Maloszewski and Zuber, 1982, used the parameterη; f=1/η).
20
The dispersion model (DM) assumes a tracer transport which is controlled by advec-tion and dispersion processes (Maloszewski and Zuber, 1982),
h(τ) = 1 τ q 4π(D/vx)τ/τm exp " − (1 −τ/τM) 2 4(D/vx)τ/τm # (4) 1223
HESSD
4, 1215–1264, 2007Conceptual flow model for karst
springs M. K. Stewart and J. T. Thomas Title Page Abstract Introduction Conclusions References Tables Figures ◭ ◮ ◭ ◮ Back Close
Full Screen / Esc
Printer-friendly Version Interactive Discussion
whereD is the longitudinal dispersion coefficient, v is the flow velocity and x is the flow distance. The parameters areτm and dispersion parameter (DP =D/vx).
Models can be combined to represent more complicated systems, as illustrated by the EPM model above. Based on the understanding of the system gained from the flow, 18O, chemical and age dating measurements, we have used a model
compris-5
ing two DM models in parallel; a “double dispersion” model (DDM). The two DMs de-scribe short-residence-time (shallow) and long-residence-time (deep) flow components or systems. The DDM model is simply formed by adding the two DM models:
DDM=bDM1+ (1−b)DM2 (5)
whereb is the fraction of the young component (shallow system fraction). The model
10
has five parameters.
Karst aquifers have special qualities, in particular they are often described as dual porosity media with primary matrix porosity and secondary porosity from solution chan-nels (Ford and Williams, 1989). Maloszewski et al. (2002) noted that in such systems it is not possible to determine the mean transit time of water, but instead the mean
15
transit time of tracer is determined, and that the DM model is the most suitable. Marble is recrystallised limestone, hence the primary porosity will have been reduced during metamorphism, and the aquifer may approximate a channel network alone.
4 Results
4.1 Recharge sources to the Arthur Marble Aquifer
20
Recharge to the Arthur Marble Aquifer can occur where Arthur Marble crops out at the surface or is covered by permeable rock such as Takaka Limestone or Quaternary gravels. Possible recharge sources are diverse and include drainage from rivers into sinks as concentrated point or linear inputs and infiltration of precipitation on karst or permeable cover as diffuse inputs.
25
HESSD
4, 1215–1264, 2007Conceptual flow model for karst
springs M. K. Stewart and J. T. Thomas Title Page Abstract Introduction Conclusions References Tables Figures ◭ ◮ ◭ ◮ Back Close
Full Screen / Esc
Printer-friendly Version Interactive Discussion
Three groups of recharge sources have been identified as follows:
– Karst uplands on east and west of the valley (fed by sinks in tributary streams in
Central Takaka, including the Waingaro and Anatoki Rivers, and rainfall)
– Upper Takaka River sinks
– Valley rainfall on the Central Takaka Valley 5
Mueller (1992) considered essentially the same groups of sources, except he sepa-rated the Waingaro and Anatoki Rivers from the karst uplands. Edgar (1998) added a fifth source being inter-aquifer leakage from the Takaka Limestone Aquifer, but did not estimate the amount of water being contributed from this source. We consider any such leakage to be included as part of the rainfall on the Central Takaka Valley.
10
Recharge from sinking streams in the karst uplands is an important source of water to the underlying aquifers. Fifteen named creeks and other unnamed subcatchments in the Central Takaka Valley (Figs. 1, 4a) generally run dry in their lower reaches. They drain an area of about 170 km2. Average precipitation is about 2600 mm/year, with evapotranspiration of 700 mm/year, giving net precipitation of 1900 mm/yr (Mueller,
15
1992). The uppermost parts of the subcatchments are on impervious bedrock (granite, schist) and flows are on the surface. The creeks then cross onto marble and the flows disappear through the gravel creek beds into cavernous marble. Most of the flows from tributary catchments recharge the Arthur Marble Aquifer and only peak flows reach the Takaka River. Mueller (1992) estimated that 80% of the total flow in the karst uplands
20
recharges the Arthur Marble Aquifer contributing 8200 l/s on average. Edgar (1998, Sect. 3) estimated that recharge was 50% from a 100 km2area yielding their minimum estimate of 3000 l/s recharge. (They excluded the west bank tributaries.) We estimate recharge is 7200 l/s (based on recharge of 70% on 170 km2).
The Waingaro and Anatoki Rivers cross marble in their middle reaches. Mueller
25
(1992) estimated the loss from the Waingaro River to be 2000 l/s. Edgar’s (1998, Sect. 3) estimate was 1,500 l/s. Our estimate is 2000 l/s. (All workers have consid-ered the contribution from Anatoki River to be insignificant.)
HESSD
4, 1215–1264, 2007Conceptual flow model for karst
springs M. K. Stewart and J. T. Thomas Title Page Abstract Introduction Conclusions References Tables Figures ◭ ◮ ◭ ◮ Back Close
Full Screen / Esc
Printer-friendly Version Interactive Discussion
The Takaka River commonly runs dry in its reach below Lindsays Bridge (on about 100 days per year, Mueller, 1992) and is an obvious source of recharge to the Arthur Marble Aquifer, as well as to the overlying limestone and gravel aquifers in contact with the AMA (see place names in Fig. 4a). Most of the Takaka Valley from Upper Takaka to the sea is covered with a layer of river gravels. Underneath the gravel, Arthur Marble
5
extends to a depth of several hundred metres below the valley floor. Between the Harwoods gauging station (near Upper Takaka) and the Spring Brook confluence, the river flows over the unconfined part of the Arthur Marble Aquifer and recharges the aquifer through gravel covered sinks. Mueller estimated the average loss from the river to be 11 000 l/s for the reach between Harwoods and Spring Brook confluence.
10
Edgar (1998, Sect. 3) reduced the estimate to 8000–9000 l/s. A re-examination of the Takaka River gauging data (P. White, personal communication, 2001) has shown that the Harwoods to Lindsays Bridge reach loses 750 l/s and the Lindsays Bridge to Spring Brook confluence reach loses 7600 l/s, giving total recharge to the underlying aquifers of 8350 l/s on average.
15
Recharge from rainfall on the Takaka Valley floor occurs between Upper Takaka and Hamama (an area of about 73 km2). Major areas of recharge are the higher river ter-races west of the Takaka River, and solution dolines or sinkholes are common in the area. Mueller (1992) estimated that 50% of this rainfall recharges the Arthur Marble Aquifer giving 2200 l/s. Edgar’s (1998, Sect. 3) estimate was 2200–4000 l/s, but some
20
of this was for precipitation on the karst plateau (east of the Takaka Valley, see Sec-tion B in Fig. 2), which is included in the karst uplands contribuSec-tion in Mueller’s and our models. Our estimate is 2200 l/s.
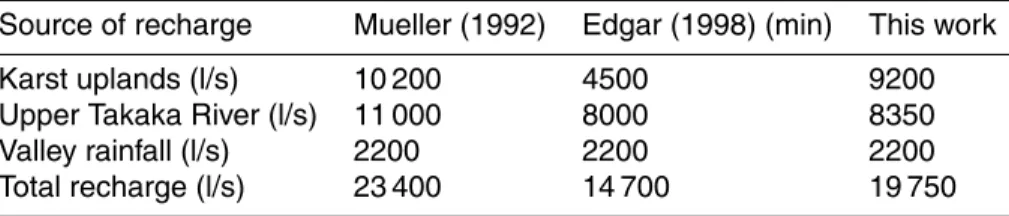
Table 1 summarises Mueller’s, Edgar’s and our estimates of recharge to the Arthur Marble Aquifer. Total recharge was 23 400 l/s in the Mueller model, of which he
consid-25
ered that 15 000 l/s was discharged by the Pupu Springs, and 8400 l/s by submarine springs in Golden Bay. Recharge was 14 700–20 000 l/s in the Edgar (Sect. 3) model; the lower limit (given in the table) suggests that there are no submarine springs (Doyle and Edgar, 1998). Our estimate gives recharge of 19 750 l/s, and requires that there
HESSD
4, 1215–1264, 2007Conceptual flow model for karst
springs M. K. Stewart and J. T. Thomas Title Page Abstract Introduction Conclusions References Tables Figures ◭ ◮ ◭ ◮ Back Close
Full Screen / Esc
Printer-friendly Version Interactive Discussion
be submarine springs to account for the excess of recharge over discharge.
Known discharges from the Arthur Marble Aquifer are mainly via the Waikoropupu Springs. Mean discharge from the Main Spring complex was 10 000 l/s, with minimum and maximum flows of 7312 and 12 459 l/s between 1990 and 1997 (Edgar, 1998). Flow from the Fish Creek Springs was 3300 l/s, with minimum and maximum flows of
5
53 and 6961 l/s. Other much smaller springs are known in the Takaka Valley (shown by small black dots in Fig. 1), of which Spring Brook is the most significant. (Spring Brook comprises a stream as well as seepages, whose flows have not been measured independently of the stream.) Three submarine springs are known to exist in Golden Bay, but their flows have not been measured (Williams, 2004), and subsequent
inves-10
tigations have not given further information (Doyle and Edgar, 1998). 4.2 Constraints on recharge sources: oxygen isotopes
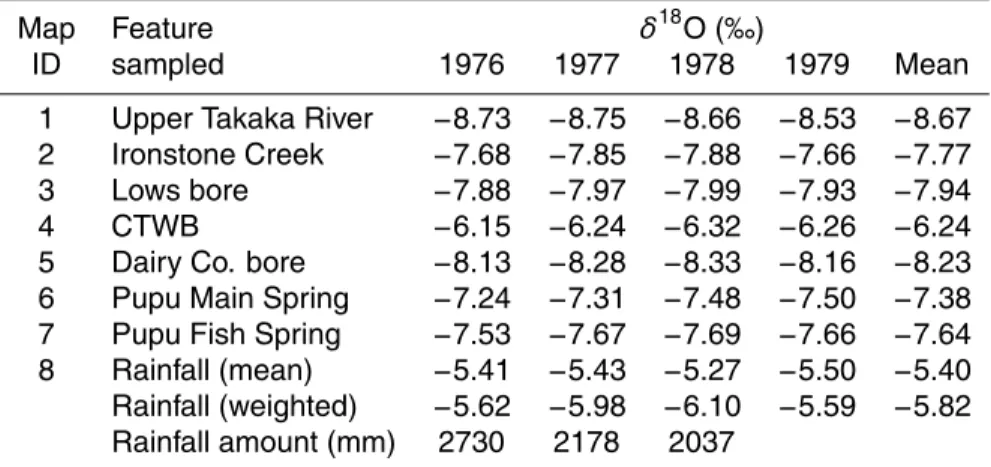
The averageδ18O values of the three recharge sources are estimated from available data. Samples were collected at monthly intervals for three and a half years from eight locations in the Takaka Valley (Stewart and Williams, 1981; Table 2). This is long
15
enough to give reasonable averages for theδ18O values of these features. Sampling sites (given in Fig. 1) were as follows:
1. Upper Takaka River, sampled at Harwoods gauging station.
2. Ironstone Creek (a spring-sourced perennial Takaka River tributary from the karst uplands on the east side of the valley).
20
3. Low’s bore (groundwater from Arthur Marble in the Central Valley region, where the Takaka River loses much of its flow).
4. CTWB, previously known as Hodgkinson’s bore (groundwater from the Takaka Limestone Aquifer).
5. Dairy Co. bore (groundwater from the Quaternary gravel aquifer (TTG) in the
25
Lower Valley),
HESSD
4, 1215–1264, 2007Conceptual flow model for karst
springs M. K. Stewart and J. T. Thomas Title Page Abstract Introduction Conclusions References Tables Figures ◭ ◮ ◭ ◮ Back Close
Full Screen / Esc
Printer-friendly Version Interactive Discussion
6. Waikoropupu Main Spring.
7. Fish Spring (one of the Fish Creek Springs).
8. Bulk monthly rainfall samples from a rainfall collector sited at the Pupu Springs. The Upper Takaka River (1) was sampled before any losses had occurred to the under-lying aquifers. The annual meanδ18O value was quite consistent from year to year and
5
averaged −8.67‰. The Upper Takaka River has the lowest δ18O value of any of the rivers. This results from rainout of the westerly-dominated weather systems causing theδ18O values to become progressively more negative from west to east (i.e. from the Anatoki (−6.5‰), to the Waingaro (−7.2‰), to the Upper Takaka (−8.7‰) catch-ments). The mean δ18O of recharge from the river will be close to that of the river
10
itself, because the recharge travels via concentrated inputs (gravel covered sinks) into the aquifer and its amount is independent of river flow when the river does not run dry. (Much of the excess, which flows out to Golden Bay, occurs during winter.) Weighting theδ18O values with the river losses to the underlying aquifer gives a weighted mean δ18O of −8.65‰, in agreement with the average value. The average δ18O for Upper
15
Takaka River recharge is taken to be −8.67‰ (Table 4).
The spring-fed Ironstone Creek (2) has a perennial flow unlike most of the other karst upland streams from east and west of the valley. The averageδ18O value is −7.77‰. Low’s bore (3) penetrates Arthur Marble in the mid-valley region east of the Takaka River (Fig. 1). Its averageδ18O value is −7.94‰, and reflects karst upland and Upper
20
Takaka River input. Other miscellaneous bore samples from East Takaka (samples 11– 14, Table 3 and Fig. 4b) are sourced from east of the valley and had values near −6.9‰. Samples from streams west of the valley were also close to −7.0‰. On the basis of available data, the eastern tributaries have been assigned a meanδ18O of −7.4‰ and the western tributaries −7.0‰, making the overall mean −7.2‰. The Waingaro and
25
Anatoki Rivers have mean values of −7.2‰ and −6.5‰, respectively. Recharge from the karst upland tributary streams is mainly via concentrated inputs (gravel covered sinkholes), and the excess during the largest flows is shed when the waters reach the
HESSD
4, 1215–1264, 2007Conceptual flow model for karst
springs M. K. Stewart and J. T. Thomas Title Page Abstract Introduction Conclusions References Tables Figures ◭ ◮ ◭ ◮ Back Close
Full Screen / Esc
Printer-friendly Version Interactive Discussion
Takaka River. The average δ18O for karst uplands recharge is taken to be −7.2‰ (Table 4).
The CTWB (4), which draws water from Takaka Limestone, has an average δ18O value of −6.24‰, showing that it is sourced almost entirely from valley rainfall. Sam-ples from bores which draw on valley rainfall-recharged groundwater (samSam-ples 15–
5
19, Table 3 and Fig. 4b) had an average δ18O of −5.7‰. Bulk monthly rainfall (8) was collected at a raingauge at the Pupu Springs. Rainfall amounts are high, being 2000–3000 mm per year. The amount-weighted mean annualδ18O value is −5.82‰. Evapotranspiration will cause preferential selection of winter rainfall leading to a more negative average δ18O value; the correctedδ18O is −6.09‰. Recharge from rainfall
10
on the Central Takaka Valley is via diffuse and concentrated (sinkhole) pathways. The averageδ18O for valley rainfall recharge is taken to be −6.0‰ (Table 4).
In the Lower Valley, the Dairy Co. bore (5) has quite negativeδ18O (−8.23‰) like the Takaka River. Both its hydrogeological situation andδ18O value suggest that the gravel aquifer here gains water from the Takaka River. However, in this reach the Takaka River
15
has a large contribution from the Waingaro River (with meanδ18O of −7.2‰), because so much of the Takaka flow is lost to sinks in its riverbed upstream of this point.
Samples were collected each month from both the Pupu Main Spring (6) and Fish Spring (7). A consistent difference in δ18O is found between them, with the Main Spring having higher (i.e. less negative) δ18O. The annual mean values are −7.38‰ and
20
−7.64‰ respectively (Table 2). (A Student’s t-test shows that the probability of these not being different is 0%.) This means that the Main Spring and Fish Spring waters contain different proportions of the source waters, and in particular Fish Spring contains more Upper Takaka River water than the Main Spring. The different proportions of the source waters in each spring are also reflected in their different chemical compositions
25
and residence times, as seen below.
When the Pupu Springs outflow decreases and the Fish Creek Springs nearly cease to flow, because of dry conditions, the δ18O and chemical composition of the Main Spring water become more like those of Fish Spring (Stewart and Downes, 1981).
HESSD
4, 1215–1264, 2007Conceptual flow model for karst
springs M. K. Stewart and J. T. Thomas Title Page Abstract Introduction Conclusions References Tables Figures ◭ ◮ ◭ ◮ Back Close
Full Screen / Esc
Printer-friendly Version Interactive Discussion
This shows that at such times the Main Spring draws on similar sources to Fish Spring, and suggests that the AMA is stratified.
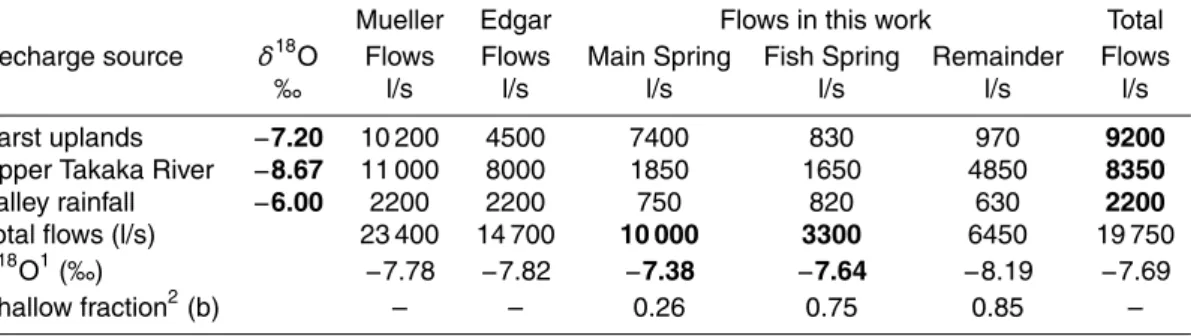
The meanδ18O values of the inputs and outputs to the Arthur Marble system given above allow the mass balance of 18O to be calculated (Table 4). The Mueller and Edgar recharge models give flow-weighted meanδ18O values of −7.78‰ and −7.82‰
5
respectively for the springs’ outflow (Table 4). These do not agree with the measured values for either the Main Spring (−7.38‰) or Fish Spring (−7.64‰), and therefore the models cannot be correct.
Our (more complex) model matches the observed δ18O values of the Pupu Main Spring and Fish Spring, while observing the restrictions imposed by the measured
10
input and output flows. The highlighted quantities in Table 4 are the constraints that have to be met by a satisfactory model. It is found that neither the flows nor the mean δ18O values of the springs can be matched if they are the only major outflows from the AMA system. An extra outflow of 6450 l/s, with a δ18O value of −8.19‰, is required (labelled “remainder” in Table 4) to complete the18O balance. Theδ18O value shows
15
that most (75%) of the remainder must be from the Upper Takaka River (Table 4). Much of this flow is believed to be being discharged offshore via submarine springs or seepages through the seabed, because no other large outflows from the system are known. (Some small springs (of which Spring Brook is the largest, Edgar, 1998) occur between the mid-valley and the sea, but these are clearly insufficient to take the
20
predicted flow.)
4.3 Chemical compositions
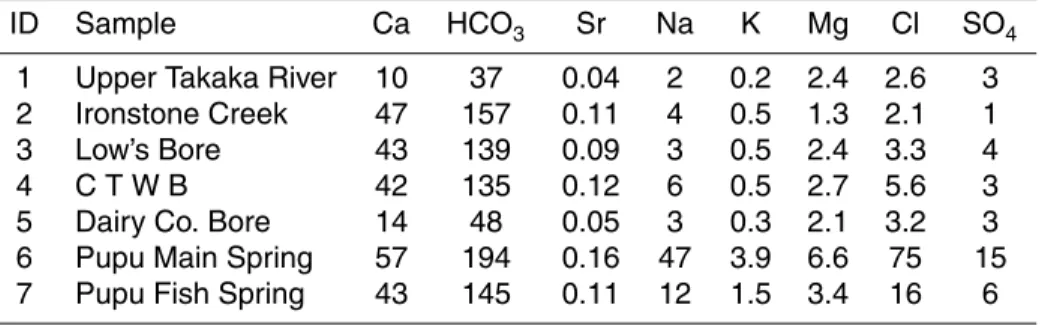
The chemical compositions of some waters from the Takaka Valley are given in Table 5. The rivers, springs and bores were sampled in 1979 (Stewart and Downes, 1981). Two major trends dominate the water compositions. These are 1) interaction with carbonate
25
rocks (marble and/or limestone), and 2) addition of sea water. More subtle interactions with the other rocks tend to be masked by these trends.
Elevated concentrations of Ca, HCO3 and Sr show the effects of interaction with
HESSD
4, 1215–1264, 2007Conceptual flow model for karst
springs M. K. Stewart and J. T. Thomas Title Page Abstract Introduction Conclusions References Tables Figures ◭ ◮ ◭ ◮ Back Close
Full Screen / Esc
Printer-friendly Version Interactive Discussion
carbonate rocks (samples from Ironstone Creek, Low’s bore, CTWB, Main Spring and Fish Spring in Table 5). These waters are derived from Arthur Marble catchments or aquifers, except CTWB bore water which is from Takaka Limestone. Waters showing much less enrichment in Ca, etc. are the Upper Takaka River and Dairy Co. bore, which derive water from non-carbonate rocks such as schist and granite. The Dairy Co. bore
5
is in gravel probably recharged by the Takaka River.
Elevated Na, K, Mg, Cl and SO4concentrations in the Pupu Springs and Fish Creek Springs reveal seawater input (Michaelis, 1976; Stewart and Downes, 1981). Cl con-centrations show that the Pupu Main Spring water contains 0.5% sea water on average (amounting to 50 l/s in the average flow), Dancing Sands spring 0.4% and Fish Creek
10
Springs 0.1%. However, the seawater content of Main Spring water varies between 0.2% at low flow and 0.65% at high flow (see Fig. 5a). (Figure 5a shows the total flow from the springs plus a small stream versus the Cl concentration in the Main Spring. The line gives the approximate flow from the springs if the stream water is removed.) Seawater discharge is 16 l/s from the Main Spring during the lowest flow, and 80 L/s
15
during the highest flow, a five-fold increase. Fish Creek Springs discharge 3 l/s of sea-water on average.
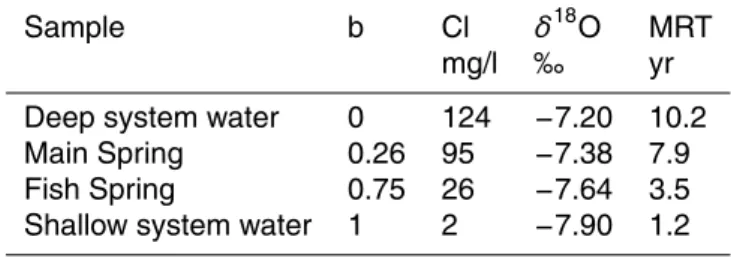
The δ18O values of the Main Spring also vary with flow like the Cl concentrations. Figure 5b shows the relationship betweenδ18O and Cl. The approximately linear rela-tionship indicates that the Main Spring can be considered to be fed by two main water
20
components, whose proportions vary with discharge from the spring. The components are deep system water withδ18O=−7.2‰ and high Cl, and shallow system water with δ18O=−7.9‰ and low Cl. The δ18O value of the shallow water is the weighted mean of the contributions from Upper Takaka River and valley rainfall to the Main Spring (Ta-ble 4). (The logic for and nature of these components are described further below.)
25
The Main Spring points plot on the mixing line between the two components within experimental error (standard deviation of theδ18O values around the line is ±0.10‰). The average values for the Main Spring and Fish Spring are also shown on the figure. Figure 5c shows the (average) mean residence times of the Main Spring, Fish Spring
HESSD
4, 1215–1264, 2007Conceptual flow model for karst
springs M. K. Stewart and J. T. Thomas Title Page Abstract Introduction Conclusions References Tables Figures ◭ ◮ ◭ ◮ Back Close
Full Screen / Esc
Printer-friendly Version Interactive Discussion
and two water components versus chloride concentrations, from the residence time determinations described below. The relationships between flows, chloride,δ18O and ages (Table 6) make it clear that the Main Spring water age decreases as its flow decreases, despite the age not being able to be determined on individual samples at different flows, i.e. as the flow from the Main Spring decreases, so the contribution
5
of deep system water will decrease, and therefore the age of the Main Spring water. This is contrary to the findings of most studies looking at the ages of springs (e.g. Siegenthaler et al., 1984).
4.4 Residence time estimation: Tritium and CFCs
Reliable interpretation of the tritium ages of the springs requires that the input of tritium
10
to the groundwater aquifer be known. This involves knowing both the tritium concen-tration in the precipitation and how it is affected during recharge to the AMA. Tritium concentration in precipitation is taken from monthly measurements at Kaitoke near Wellington, adjusted by a scale factor. (The scale factor adjusts precipitation data for well-known latitudinal and altitudinal variations over New Zealand, Stewart and Taylor,
15
1981).
The latitudes of Kaitoke and Takaka Valley are both close to 41◦00′S, and both are within mountainous terrain affected by the dominant westerlies (see inset in Fig. 1). Kaitoke is at 180 m altitude (all altitudes are given relative to mean sea level), but the precipitation-weighted mean altitude of the catchment of the Hutt River at Kaitoke was
20
estimated to be 610 m (Stewart et al., 1983) and this is taken as the appropriate altitude affecting the precipitation. The Pupu Springs are at 14 m altitude, and the precipitation-weighted mean altitudes of the Upper Takaka River, karst uplands and valley rainfall catchment areas are estimated to be 1100 m, 460 m and 100 m, respectively. Applying the recharge model in Table 4 gives mean altitudes of recharge of 546 m for Main
25
Spring and 690 m for Fish Spring, both similar to that at Kaitoke and indicating that the scale factor should be taken as 1.0.
The effect of the recharge process (i.e. seasonal selection of precipitation) on the 1232
HESSD
4, 1215–1264, 2007Conceptual flow model for karst
springs M. K. Stewart and J. T. Thomas Title Page Abstract Introduction Conclusions References Tables Figures ◭ ◮ ◭ ◮ Back Close
Full Screen / Esc
Printer-friendly Version Interactive Discussion
isotopic composition of infiltrated water has been considered for18O (both in estimat-ing the average values above, and for the individual monthly values below). The effect is much greater for the monthly 18O values than for the annual tritium values. This is because using the annual means instead of the monthly tritium data smooths the seasonal selection effect of the spring tritium peak (Stewart and Taylor, 1981). Also as
5
noted for18O, the dominant recharge is from the karst uplands and Upper Takaka River, and is mainly via concentrated inputs (sinks). Consequently, the effect of seasonal se-lection via evapotranspiration will be small. Finally, any effect tends to be counteracted by peak flows reaching the ends of the streams more frequently in winter, which acts to produce a more constant amount of recharge through the year. Recharge from valley
10
rainfall, which is subject to evapotranspiration, is a relatively small contributor to the AMA. For these reasons, the effect is taken as negligible.
Chlorofluorocarbons or CFCs are entirely man-made contaminants of the atmo-sphere and hydrological systems. Their concentrations in the atmoatmo-sphere gradually increased from zero in 1940 to peaks in the early 1990s (Plummer and Busenberg,
15
2001). Because the gases (CFC-11 and CFC-12) are relatively long-lived, they are widely distributed in the atmosphere. CFCs are slightly soluble in water and enter groundwater systems along with water during recharge. Assuming that they were in solubility equilibrium, their concentrations in groundwater record the atmospheric con-centrations when the water was recharged, thus allowing the recharge date of the
wa-20
ter to be determined. The temperature and atmospheric pressure (i.e. altitude) during recharge need to be known.
The concentrations of the gases in groundwater can also be affected by several other processes, which can make age interpretation complicated (Plummer and Busenberg, 2001). The most important of these in the present context are:
25
1. Degradation or absorption in anaerobic conditions underground (CFC-11 is more susceptible to this than CFC-12). This has not been observed in the present data. 2. Contamination from local sources such as organic liquids (CFC-12 is more prone
HESSD
4, 1215–1264, 2007Conceptual flow model for karst
springs M. K. Stewart and J. T. Thomas Title Page Abstract Introduction Conclusions References Tables Figures ◭ ◮ ◭ ◮ Back Close
Full Screen / Esc
Printer-friendly Version Interactive Discussion
to this than CFC-11). This has also not been observed in the present data. 3. Presence of excess air in solution (CFC-12 is mildly sensitive to this, and CFC-11
much less). We have assumed that there is no excess air in the present samples. If excess air was present, this assumption would have caused our estimated ages to be too young.
5
4. Unsaturated zone effect: CFCs could travel more rapidly through the unsaturated zone than tritium, because gases can travel in the soil gas phase while tritium travels with water. This means that gas ages could be expected to be younger than tritium ages in systems with substantial unsaturated zones. However, much of the recharge in this catchment occurs via sinks and sinkholes, so this is unlikely
10
to be a problem for these samples. 4.4.1 Main spring
Measurements of tritium concentrations in the Pupu Springs and other waters are given in Table 6. Tritium measurements for the Main Spring span 40 years, almost covering the rise and fall of tritium concentration in the atmosphere due to testing of nuclear
15
weapons in the 1950s and 1960s. Consequently, the problem of determining the mean residence time (MRT) from tritium is well-constrained. The Main Spring accumulates water from a large area and from a wide variety of sources, so it is expected that the water will have a wide distribution of residence times. Three such mixing models have been applied to interpret the tritium age.
20
The mixing models are the exponential piston flow (EPM), dispersion (DM) and dou-ble dispersion (DDM) models. The DDM model is based on the 2-component flow system inferred from theδ18O and Cl measurements above.
Figure 6a shows the tritium concentrations in the recharge, the data for the Main Spring, and the best-fitting model simulations. The residence time distributions of the
25
models (Fig. 6b) have very similar shapes with peaks of very young water and long tails of much older water. The variation of the quality of the fits with MRT is shown in
HESSD
4, 1215–1264, 2007Conceptual flow model for karst
springs M. K. Stewart and J. T. Thomas Title Page Abstract Introduction Conclusions References Tables Figures ◭ ◮ ◭ ◮ Back Close
Full Screen / Esc
Printer-friendly Version Interactive Discussion
Fig. 6c, with the goodness-of-fit being expressed as the standard of deviation (sd) of the measurements about the simulations. (For the DDM model, the overall MRT was varied by changing the MRT of the deep component.)
All three models give good fits to the data, and the mean residence times are sharply constrained close to 8 years despite the larger errors in the early tritium
measure-5
ments (because there were large variations in the tritium input from year to year at that time). The best EPM model has mean residence time (MRT) of 7.9 yr, exponential fraction (f) of 0.95 (i.e. it is close to an exponential model), and goodness-of-fit (sd) of ±0.40 TU. The best DM model has MRT 8.2 yr, dispersion parameter (DP) of 1.8, and sd of ±0.29 TU. Its age distribution is almost the same as that of the DDM model,
10
except for the smaller peak of very young water. The best fitting DDM model fits very well indeed (sd is ±0.08 TU). It has an overall MRT of 7.9 yr, with 74% of the water being 10.2 years old and 26% being 1.2 years old. The parameters of the DDM model are given in Table 8.
Note that the MRT determined is an average, because the MRT is expected to vary
15
with flow (Fig. 5). The chloride values for the Main Spring (Table 7) give an indication of the flow when the spring was sampled. Mean Cl for the Main Spring was 95 mg/l (Table 6), so the 1966 sample was sampled during above average flow, the 1972 and 1976 samples during average flows and the 1999 sample during less than average flow.
20
CFC measurements are given in Table 7. CFC measurements have given useful in-formation on water residence times in a number of New Zealand groundwater systems (Stewart and Morgenstern, 2001). We have found that groundwater ages estimated us-ing CFC-11 and tritium are often in agreement, whereas ages estimated usus-ing CFC-12 are generally several years younger. CFC samples were collected in 1998 and 2000.
25
For CFC-11, applying the EPM(f=0.95) model gives the best-fit MRT of 12.2 yr, and the DM(DP=1.8) model MRT of 4.8 yr, both quite different from each other and from the tritium result. Applying the DDM model with the same water components as for tri-tium, but optimising the fit by varying the young fraction (b), gives a best-fit model with
HESSD
4, 1215–1264, 2007Conceptual flow model for karst
springs M. K. Stewart and J. T. Thomas Title Page Abstract Introduction Conclusions References Tables Figures ◭ ◮ ◭ ◮ Back Close
Full Screen / Esc
Printer-friendly Version Interactive Discussion
b=0.24 and overall MRT of 8.0 yr, very similar to that for tritium. This suggests that the DDM age distribution has more validity in this system than the other two models (EPM and DM), and supports the conceptual model below. Model parameters are given in Table 8.
For CFC-12, the best-fit MRTs with the same models (i.e. keeping the other
parame-5
ters the same) are 9.2 yr, 3.2 yr and 5.7 yr (b=0.50), respectively. None of these agree well with the results for tritium and CFC-11. This is consistent with our previous obser-vations that CFC-12 frequently gives younger residence times than tritium and CFC-11 (Stewart and Morgenstern, 2001).
To compare the sensitivities of the tritium result with the CFC results we have
plot-10
ted the goodness-of-fit (sd) divided by the measurement error (ε) against b in Fig. 7a. (For tritium, the error has been taken as the root mean square of the first three mea-surements when the quoted errors were much larger than for the later samples.) The best-fit values of b for tritium and CFC-11 are close to the value calculated from the recharge flows in Table 4 (shown by the dashed vertical line in Fig. 7a). As noted, the
15
CFC-12 value is quite different and has been disregarded. 4.4.2 Fish Spring
Fish Spring results are given in Table 7. The EPM and DM models with broad distri-butions are not effective for estimating the ages of the Fish Spring (fits are poor and/or the ages are not consistent with each other), but the DDM model appears to work
20
well. Applying the DDM model to tritium and allowing the young fraction to vary gives a best-fit model with b=0.67 (Fig. 7b). However, the discrimination is weak with only one measurement, sob could lie within a range of at least ±0.2. Applying the model to the two CFC-11 measurements gives a best fit atb=0.81; this is estimated to have an error of about ±0.1. With CFC-12, the best-fit model isb=0.70. These are all relatively
25
close to the value calculated from the recharge flows in Table 4 (i.e.b=0.75, shown by the dashed vertical line in Fig. 7b). In this case, the CFC-12 measurements appear to have given an acceptable result (unlike for the Main Spring). This is possibly due to the
HESSD
4, 1215–1264, 2007Conceptual flow model for karst
springs M. K. Stewart and J. T. Thomas Title Page Abstract Introduction Conclusions References Tables Figures ◭ ◮ ◭ ◮ Back Close
Full Screen / Esc
Printer-friendly Version Interactive Discussion
dominance of the younger component in Fish Spring water. 4.4.3 Balls bore
Balls bore (WWD 6011) is a deep well (114 m) with a long unscreened interval located approximately 425 m southwest of the Main Spring (Fig. 3). The bore penetrates 33 m of Motupipi Coal Measures before encountering fractured Arthur Marble, and is cased
5
to 35 m depth. The ground level is 21 m a.s.l. compared with 14 m at the Main Spring and 17 m at Fish Spring. Rest water level (with no pumping) in the bore is 18 m a.s.l.
The δ18O value of the water is −6.48‰, indicating a dominance of valley rainfall and likely absence of Upper Takaka River water. Tritium and CFC results are given in Table 7. To obtain a consistent age from the tritium and CFC measurements, R. van
10
der Raaij (personal communication, 2006) found he had to assume binary mixing of two source waters. The mixture comprised approximately two thirds of 1-yr-old water (assumed to be from shallow level) and one third of much older water (containing zero tritium and CFCs and therefore probably at least 100-yr-old) from depth. The δ18O value is consistent with two thirds 1-yr-old water being sourced from valley rainfall, and
15
one third 100-yr-old water from karst uplands.
The result is interesting, because it emphasises how laterally inhomogeneous and stratified the AMA is. Clearly waters with very different residence times and sources can be drawn from different parts of the aquifer. The 1-yr-old shallow water component is like that observed at the Pupu Springs, but with a different source. The 100-yr-old
20
water is likely to be from the porous matrix reflecting the fact that there is no natural out-flow and few or much smaller deep fissures at this site. (e.g. Drawdown with pumping is considerable, being 3.2 m with 10.7 l/s water extraction.)
4.5 Residence time estimation of the shallow component: oxygen-18 variations Theδ18O variations in the Main and Fish Springs can be used to estimate the mean
25
residence time of the shallow component (MRT about 1.2 yr). The deep component 1237
HESSD
4, 1215–1264, 2007Conceptual flow model for karst
springs M. K. Stewart and J. T. Thomas Title Page Abstract Introduction Conclusions References Tables Figures ◭ ◮ ◭ ◮ Back Close
Full Screen / Esc
Printer-friendly Version Interactive Discussion
(MRT=10.2 yr) has too long a residence time to show any variations due to the δ18O variations in its input water, so its δ18O value can be assumed to be constant at δ18O=−7.2‰. But the shallow component water should be young enough to show effects from the δ18O variations of its inputs.
The input δ18O values of the shallow system can be calculated by correcting the
5
valley rainfall data (site 8) for evapotranspiration and the Upper Takaka River data (site 1) for river flow by the method described in Stewart et al. (2007). The calculations use the weighting formula given by Bergmann et al. (1986)
δw =
Ri
Rmean(δi−δmean) + δmean (6)
whereδw, δi are the weighted and measured δ18O values, and Ri the groundwater
10
recharge amount, in theith month respectively. δmean and Rmean are the mean δ 18
O values and recharge amounts.
Theδ18O values of the recharge for Main Spring are given by
δMSrech = b(0.29δwrf+ 0.71δwUTR) + (1 − b)δwku (7)
and that for Fish Spring is
15
δFSrech= b(0.33δwrf+ 0.67δwUTR) + (1 − b)δwku (8)
whereb is the shallow fraction, and δwrf, δwUTR, δwku are the weighted δ 18
O values for valley rainfall, Upper Takaka River and karst uplands (−7.2‰), respectively, from Eq. (6). The multiplying factors are the ratios of the flows in Table 4. Figure 8a shows the calculatedδ18O variations in the recharge for the two springs.
20
Three adjustable parameters were used to simulate the δ18O values of the Main Spring, namely the MRT and DP of the shallow water, and b. The variation of the goodness-of-fit parameter with MRT is shown in Fig. 8b, and the best-fitting simula-tion is given in Fig. 8c. (The first 12 measurements were omitted because they would
HESSD
4, 1215–1264, 2007Conceptual flow model for karst
springs M. K. Stewart and J. T. Thomas Title Page Abstract Introduction Conclusions References Tables Figures ◭ ◮ ◭ ◮ Back Close
Full Screen / Esc
Printer-friendly Version Interactive Discussion
have been affected by recharge before the measurements on valley rainfall and Up-per Takaka River had begun.) The best fit is obtained with MRT=1.0 yr, DP=0.1 and b=0.3, which are all close to the values obtained from the earlier work (i.e. MRT=1.2 yr, DP=0.12, b=0.26). This gives good support to the 2-component model.
The same three parameters were used to fit theδ18O values of the Fish Spring. The
5
optimum fit is obtained with MRT=1.1 yr, DP=0.3, b=0.75 (Figs. 8b, d). These also agree well with the parameters from the earlier work (MRT=1.2 yr, DP=0.12, b=0.75). The variation of the quality of fit withb is compared with those for tritium and CFCs in Figs. 7a, b. The optimum fits occur at close to the same values of b as with the other tracers, and therefore strongly support the 2-component model for the springs, and in
10
particular the existence of the shallow component with MRT about 1.2 yr.
One source of error in the estimation of the δ18O values of the recharge to the springs is the assumption thatb and the proportions of Upper Takaka River and valley rainfall waters are constant. In fact, these are likely to vary in time as the catchment wetness and therefore spring flow varies.
15
5 Discussion
5.1 Karst hydrology
Karst landscapes are produced by groundwaters percolating through limestone rock and gradually dissolving the carbonate minerals. Limestones are commonly well-jointed, and water initially penetrates slowly along joints. In time, solution of carbonate
20
minerals by the water gradually widens the joints into fissures. Eventually an intercon-nected system of solution cavities forms allowing water to move easily from sinks in the recharge area through the rock to emerge as springs at the foot of the catchment.
Arthur Marble is a thermally metamorphosed limestone produced by recrystallisation of the constituent carbonate grains. The development of a crystalline matrix will have
25
reduced the primary matrix porosity of the original limestone, and solution of the joints 1239
HESSD
4, 1215–1264, 2007Conceptual flow model for karst
springs M. K. Stewart and J. T. Thomas Title Page Abstract Introduction Conclusions References Tables Figures ◭ ◮ ◭ ◮ Back Close
Full Screen / Esc
Printer-friendly Version Interactive Discussion
will have enhanced the secondary fissure porosity. Consequently, the rates of flow in the two media of pores and solution cavities will differ by orders of magnitude producing a markedly dual porosity aquifer.
The idea of karst hydrology being controlled by two integrated subsystems with differ-ent porosities (represdiffer-enting fissured-porous matrix and solution cavities respectively)
5
has been used very widely in karst studies (e.g. page 1, Ford and Williams, 1989), and has been applied to interpret tritium and oxygen-18 measurements in karst springs by Rank et al. (1992); Maloszewski et al. (2002). Figure 9a (adapted from Maloszewski et al., 2002) illustrates the nature of flow in karst aquifers. Connected porosity occurs in small-scale fissures and porous matrix of the marble providing the majority of the
10
storage in the system (the fissured-porous aquifer), and a low-volume but high-velocity conduit system (karstic channels) conveys water from entrances to exits while interact-ing with water in the pores on the way.
5.2 Conceptual model of the Arthur Marble Aquifer Flow System
The conceptual model presented here (Fig. 9b), however, is different. It is based on the
15
measurements and deductions described above. The AMA flow system supplying the Waikoropupu Springs is conceived of as containing two flow systems, each being dual porosity aquifers like that illustrated schematically in Fig. 9a. Springs generally draw on deeper groundwater sources during low flow conditions, with the water becoming older as flow decreases. And, in particular, springs fed by the dual porosity aquifer of Fig. 9a
20
would become older with decreasing flow because more of the water would come from the porous matrix. However, with the Waikoropupu Springs the opposite happens, the water becomes younger as flow decreases (Fig. 5). This leads logically to the idea of two flow systems with different recharge sources.
The deep system supplies the majority of the flow to the Main Spring complex via one
25
or more major fissures or solution channels, which connect the deep fissure network to the springs. The system includes the deep parts of the marble below the Takaka Valley floor and the marble on both sides of the valley. The marble outcrops on the
HESSD
4, 1215–1264, 2007Conceptual flow model for karst
springs M. K. Stewart and J. T. Thomas Title Page Abstract Introduction Conclusions References Tables Figures ◭ ◮ ◭ ◮ Back Close
Full Screen / Esc
Printer-friendly Version Interactive Discussion
sides of the valley show strong evidence of karstification, based on surface expression and the presence of caves (with the most famous cave being Harwood’s Hole with a 183 m vertical drop). The marble beneath the valley will also have been karstified down to at least 130 m during lower sea-level stands. 18O evidence shows that recharge for the deep water component is from the small tributary streams and rainfall on the karst
5
uplands on each side of the valley. The pressure from the higher water tables on the sides of the valley (especially the karst plateau on the east side), transmitted by the solution channel network, plus the confining layer in the lower valley, produce high piezometric levels in the confined area. Most of the deep system recharge eventually emerges at the Main Spring complex where the confining layer thins – about 80%
10
of the water entering the deep system is discharged by the Main Spring complex on average (Table 4). Lesser amounts emerge in the Fish Creek Springs (9%) and the rest can probably be accounted for by seepages upwards into the mostly overlying shallow system. Hence, it is unlikely that much water escapes into the sea from the deep system in spite of the evident presence of sea water at depth in the aquifer. The
15
source of the sea water is believed to be present-day infiltration (possibly by a venturi effect, Williams, 1977; Fleury et al., 2007), although presence of remnant or fossil sea water from an earlier incursion of sea water or even operation of a complex ion exchange-diffusion process through a sediment interface cannot be entirely ruled out. The powerful upflow in the deep system near the springs carries sea water from depth
20
into the springs’ discharge.
The mean residence time of the deep water (measured in the Main Spring) is long (10.2 yr) and the storage capacity of the aquifer very large (water volume estimated from flow times age = 9200 l/s×10.2 yr=3.0 km3). Much of the saturated part of the system is below sea level. Interaction between channel network water and
fissured-25
porous matrix water may affect the chemical and isotopic concentrations of the channel water (e.g. Elliot et al., 1999), although the marble probably has a very low porosity. There is possibly much older water resident in less accessible parts of the porous matrix, as shown by the results for Balls bore.
HESSD
4, 1215–1264, 2007Conceptual flow model for karst
springs M. K. Stewart and J. T. Thomas Title Page Abstract Introduction Conclusions References Tables Figures ◭ ◮ ◭ ◮ Back Close
Full Screen / Esc
Printer-friendly Version Interactive Discussion
The shallow system underlies the Takaka Valley. The unconfined part in the Central Valley includes Arthur Marble, Takaka Limestone and Takaka Gravel, while the con-fined part in the Lower Valley is in Arthur Marble beneath the Motupipi Coal Measures. Recharge is from both the Upper Takaka River and valley rainfall. Much of the water (52%) bypasses the Pupu Springs and is discharged offshore in springs and seeps,
5
some (25%) appears in the Main Spring complex and 23% in the Fish Creek Springs (Table 4). The water discharged in the Pupu Springs is estimated to have a mean resi-dence time of 1.2 years. The water volume estimated from flow times age is 0.4 km3. 5.3 Location of the Waikoropupu Springs and the relationship between the two flow
systems
10
A question that arises is: why do these two systems act as if they are separate, al-though apparently residing in the same aquifer? Williams (1977) discussed the related question of why the springs are located in a small tributary valley on the west side of the Takaka fault-angle valley, and 5 km from the line of shortest distance between the upper valley and the sea. He found this a surprising location, and considered that there
15
must be a special local circumstance at Takaka to explain it. One of his hypothesised explanations for the location helps to shed light on the relationship between the two systems.
Williams had two alternative explanations for the location of the springs. The first was that there is a diorite intrusion in the marble at shallow levels under the Takaka Valley,
20
which blocks water in the deep system from flowing towards the sea. The diorite, which is not shown on geological maps of the area (Rattenbury et al., 1998), was suggested by Jones (1939) from a survey of magnetic anomalies in the Takaka region. Jones’s zero magnetic anomaly outline for the suggested intrusive is shown in Fig. 1. The diorite, which lies parallel to and is shown on Section A in Fig. 2, would divert water in
25
the deep system very effectively towards the Pupu Springs in the west, while allowing the shallow system water to flow towards the sea and escape via submarine outlets. The Pupu Springs themselves, occurring where the cap rock is thinnest and artesian
HESSD
4, 1215–1264, 2007Conceptual flow model for karst
springs M. K. Stewart and J. T. Thomas Title Page Abstract Introduction Conclusions References Tables Figures ◭ ◮ ◭ ◮ Back Close
Full Screen / Esc
Printer-friendly Version Interactive Discussion
pressures highest, would also induce convergence of flow and draw both deep water, and a proportion of the shallow water to the springs.
The second explanation was that the marble is more limited in extent than shown in Fig. 1 and strikes in the direction of Pupu, thereby channelling the flow in that direction. This is not considered a viable explanation in view of the geology and the current
5
results.
6 Conclusions
The paper examines the evidence on recharge sources to the Arthur Marble Aquifer and establishes a new recharge model using the most reliable information. This recharge model is used with estimates of the averageδ18O values of the three groups
10
of recharge sources to derive an18O mass balance for the inputs and outputs of the AMA by means of a spreadsheet (Table 4). The results show that the Main Spring is sourced mainly from the karst uplands (74%), with smaller contributions from the Upper Takaka River (18%) and valley rainfall (8%). In contrast, Fish Creek Springs are fed mainly by Upper Takaka River (50%), with valley rainfall (25%) and karst
up-15
lands (25%). The unexpected consequence of the mass balance is that much of the Upper Takaka River contribution to the aquifer (58%) must bypass the springs and be discharged via offshore springs and seeps.
The chemical concentrations of the Waikoropupu Springs reflect input of sea water, at average rates of 0.5% in the Main Spring and 0.1% in Fish Creek Springs, but varying
20
with flow. The chloride is carried by the karst uplands-sourced deep water. Tritium measurements spanning 40 years, and CFC-11 measurements, give a mean residence time of 8 years for the Main Spring water. Fish Spring water has mean residence time of 3.5 yr. The measurements are best explained by a two-component model, with different proportions of deep (MRT 10.2 yr) and shallow (MRT 1.2 yr) components contributing
25
to each spring. Monthly18O measurements on the springs corroborate the proportions and residence time of the shallow component in the spring flows.